


Network Topology Mapping Explained
Network topology mapping is the process of discovering and visualizing how devices, endpoints, and services connect across a network. It captures both physical (Layer 2) relationships - which switch port links to which device - and logical (Layer 3) relationships - how subnets, routes, and autonomous systems reach each other. A topology map can range from a hand-drawn diagram to a live, continuously updated graph built from protocol data such as LLDP, CDP, ARP, FDB, OSPF, and BGP.
What Is Network Topology Mapping?
At its core, network topology mapping answers a deceptively simple question: “What is connected to what?” The answer matters because almost every operational task - diagnosing a slow application, planning a capacity upgrade, isolating a failed link, verifying segmentation - depends on understanding the connectivity graph.
Topology maps serve several purposes:
- Visibility: operators can see the full fabric at a glance instead of tracing cables or reading configuration files one device at a time.
- Root cause analysis: when an application or endpoint is unreachable, the map shows the path and highlights where it breaks.
- Change validation: after a configuration change or hardware swap, the updated map confirms that the intended connections exist and no unexpected ones appeared.
- Security and compliance: mapping can reveal unauthorized devices, rogue access points, or segmentation violations.
A topology map is typically represented as a graph: nodes are devices, interfaces, VLANs, or even application processes, and edges are links, adjacencies, or connections.
How Network Topology Mapping Works
Topology mapping is fundamentally a data-collection and correlation problem. The map is only as accurate as the underlying data sources, and different sources reveal different layers of connectivity.
Layer 2 (Physical) Discovery
Layer 2 topology answers “which physical port on which switch connects to which device.” The primary data sources are:
| Source | What It Reveals | Limitations |
|---|---|---|
| LLDP (Link Layer Discovery Protocol) | Directly connected neighbors, port descriptions, chassis IDs | Must be enabled on both ends; not all endpoints speak LLDP |
| CDP (Cisco Discovery Protocol) | Same as LLDP but Cisco-proprietary | Only works between Cisco devices |
| FDB / MAC address table | Which MAC address is on which switch port | Must be read from every switch; ages out quickly |
| STP (Spanning Tree Protocol) state | Which ports are forwarding vs blocking | Only shows the tree, not all physical links |
| ARP table | IP-to-MAC mappings | Per-device; ages out (minutes to hours) |
LLDP and CDP are the most reliable sources for directly connected network devices because they explicitly advertise neighbor identity and port information. However, many endpoints - servers, IoT devices, virtual machines - do not run these protocols, so their position must be inferred by combining ARP tables (IP to MAC) with FDB entries (MAC to port). Some environments also use DHCP snooping tables or 802.1X accounting logs to improve endpoint positioning.
This inference is probabilistic. If the FDB entry for a MAC has aged out, the endpoint cannot be confidently placed on a specific port. A topology built from a partial snapshot is inherently less reliable than one built from fresh, complete data.
Layer 3 (Logical) Discovery
Layer 3 topology answers “how do subnets, routes, and autonomous systems reach each other?” The data sources include:
- Routing tables: show installed routes, next hops, and interfaces.
- OSPF (Open Shortest Path First): link-state database reveals the full area topology, including router adjacencies and link costs.
- BGP (Border Gateway Protocol): reveals AS-level connectivity, peering relationships, and path attributes.
Layer 3 maps are especially valuable in multi-site, data center, or cloud environments where traffic traverses multiple routing domains. They help operators understand reachability, traffic engineering paths, and failover behavior.
Application Layer Discovery
Beyond network devices, modern topology mapping can extend to the application layer. Live TCP and UDP connections between processes, containers, and services form an application connectivity graph that sits on top of the network fabric. This is critical for microservice architectures where the logical service topology changes far more frequently than the physical network.
Key Data Sources at a Glance
| Layer | Data Source | Information Gained |
|---|---|---|
| L2 | LLDP / CDP | Direct neighbor identity and ports |
| L2 | FDB / MAC table | MAC-to-switch-port mapping |
| L2 | STP state | Forwarding vs blocked links |
| L2 | ARP table | IP-to-MAC resolution |
| L3 | Routing table | Installed routes and next hops |
| L3 | OSPF LSDB | Area topology and adjacencies |
| L3 | BGP | AS-level peering and path info |
| App | TCP/UDP connection tables | Process and container connectivity |
A Concrete Example
Consider a data center with two core switches, four top-of-rack (ToR) switches, and forty servers. LLDP is enabled on all network devices, so the core-to-ToR links are immediately visible. However, the servers do not run LLDP.
To place each server on the topology map:
- The mapper collects the ARP table from the ToR switch, learning the MAC address associated with each server IP.
- It collects the FDB from the same ToR switch, learning which physical port hosts each MAC address.
- The two tables are joined: IP -> MAC -> port.
If a server was recently powered on and its FDB entry has not yet been learned, the mapper cannot confidently place it. Similarly, if a server has been silent for longer than the FDB aging time, its position may go stale. This is why topology that relies on a single snapshot degrades quickly.
Static Diagrams vs Live Topology
The traditional approach to topology mapping is a manually maintained diagram in a tool like Visio or draw.io. These diagrams have a well-known problem: they are accurate only at the moment of creation. Networks change constantly - devices are added, links are re-cabled, VLANs are reconfigured, failover paths activate. A static diagram is a point-in-time artifact that goes stale almost immediately.
| Aspect | Static Diagram | Live Topology Map |
|---|---|---|
| Freshness | Stale on creation | Continuously updated |
| Effort to maintain | Manual, error-prone | Automated from protocol data |
| Change detection | None | Immediate |
| Root cause usefulness | Limited | High - shows current state |
| Scale | Hard to maintain | Handles large fabrics |
Live topology mapping addresses this by continuously polling or streaming discovery data from the devices themselves. The map reflects the actual state of the network, not someone’s best recollection of last quarter’s design.
Common Pitfalls and Misconceptions
“LLDP gives me the complete topology.” LLDP only reports directly connected neighbors that also run LLDP. Endpoints, virtual machines, and devices from vendors that disable LLDP by default will be invisible without supplementary FDB and ARP correlation.
“One snapshot is enough.” FDB and ARP tables age out within minutes. A topology map built from a single poll is a probabilistic snapshot, not a ground-truth statement. The more frequently data is collected, the more reliable the map.
“Layer 2 and Layer 3 are the same map.” They are related but distinct. A Layer 2 map shows physical links and switch ports. A Layer 3 map shows routing adjacencies and reachability. A single physical link can carry multiple logical paths, and a single logical path can traverse many physical links.
“Topology mapping is only for network engineers.” Application teams benefit from understanding the connectivity graph too. Knowing which container talks to which database over which network segment is essential for troubleshooting latency, planning segmentation, and validating service meshes.
Network Topology Mapping with Netdata
The Netdata Topology Viewer builds the connectivity map live, directly in the agent. It maps the SNMP device fabric using LLDP, CDP, BGP, and OSPF, supplemented by FDB and STP inference with tunable confidence levels for endpoints that do not advertise themselves via neighbor discovery protocols.
Beyond the network fabric, the Topology Viewer also maps the application layer - live TCP and UDP connections between processes and containers. This means you can see not only how switches and routers are connected, but how applications actually use those connections.
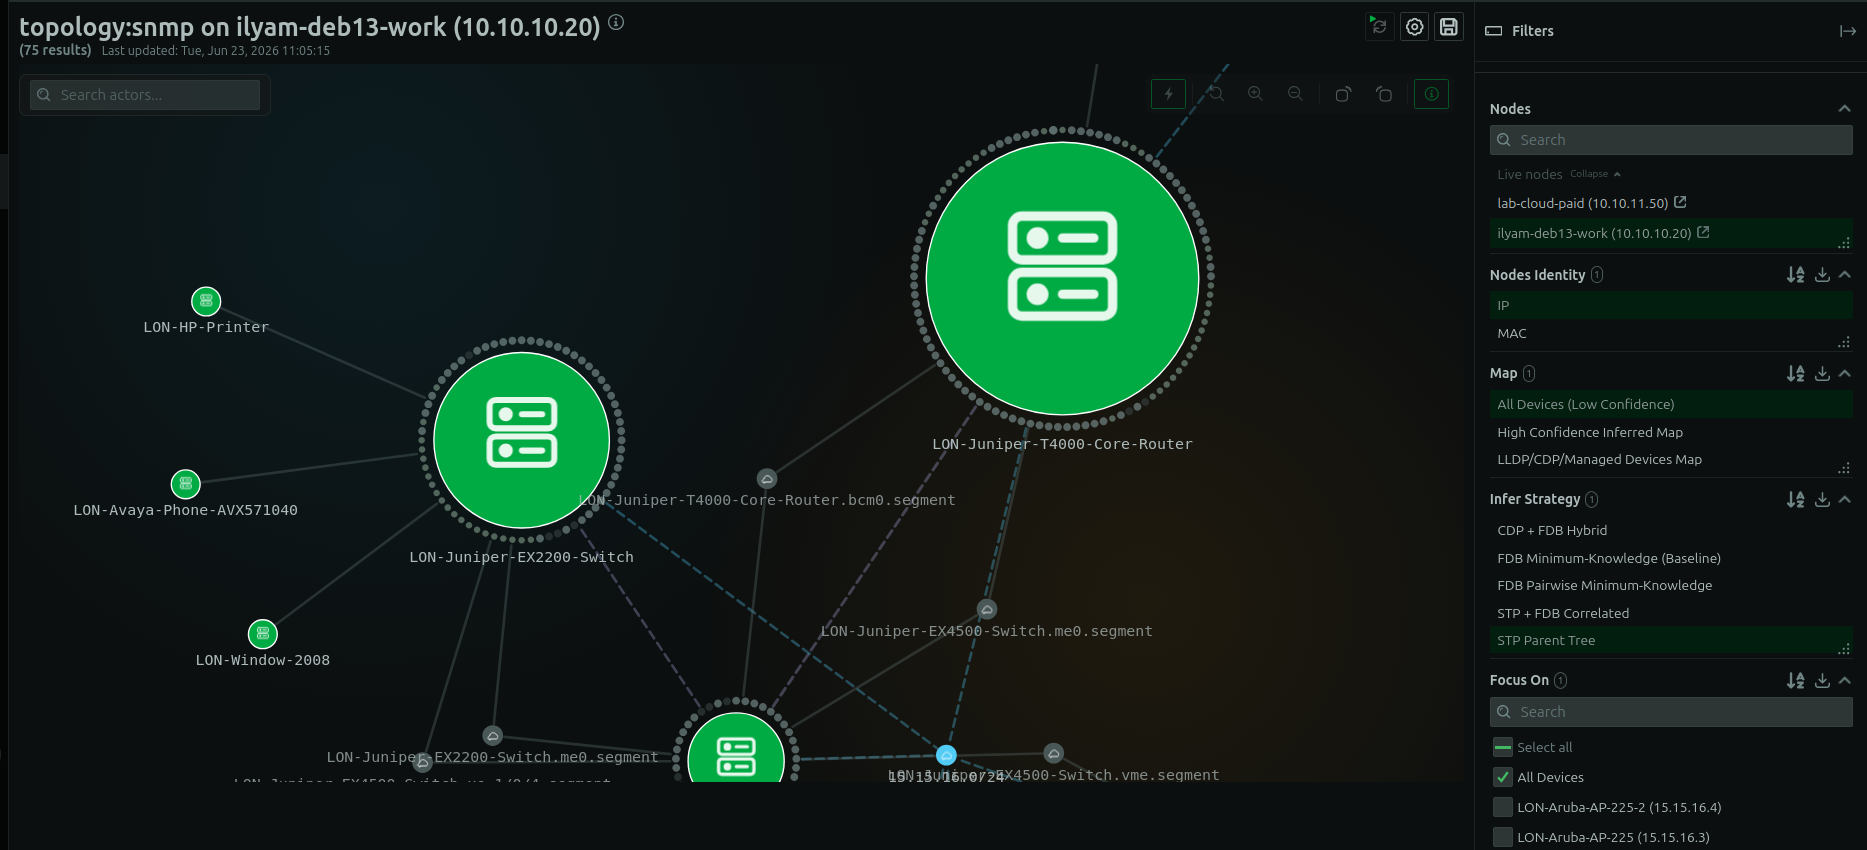
You can click any actor in the map - a network device, a container, a process, or a node - to trace its dependencies (what it connects out to) and its dependants (what connects in to it). This turns the topology map from a static picture into an interactive troubleshooting tool.
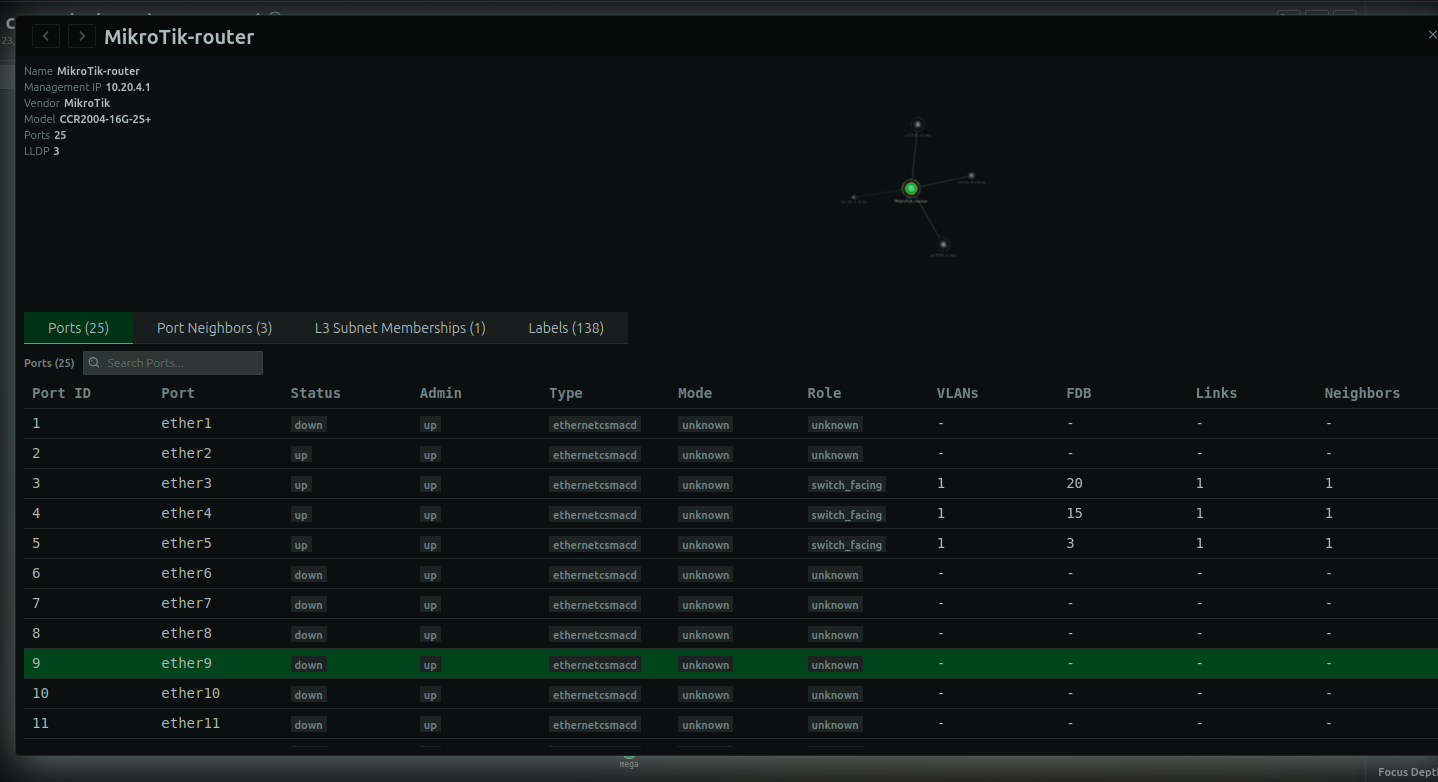
For teams that need end-to-end visibility, Netdata’s network device monitoring complements the topology view with per-interface metrics, SNMP-based health data, and alerts. Combined with SNMP monitoring, the topology map stays grounded in real protocol data rather than guesses.
FAQ
What is network topology mapping?
Network topology mapping is the process of discovering and visualizing how devices, endpoints, and services are connected. It covers physical (Layer 2) connections like switch ports and links, and logical (Layer 3) connections like routing adjacencies and subnets.
What protocols are used for network topology discovery?
Common discovery protocols include LLDP and CDP for direct neighbor discovery, FDB/MAC tables and ARP tables for endpoint positioning, STP for link state, and OSPF and BGP for Layer 3 routing topology.
What is the difference between Layer 2 and Layer 3 topology?
Layer 2 topology shows physical connections - which switch port links to which device. Layer 3 topology shows logical routing relationships - how subnets, areas, and autonomous systems reach each other. Both are needed for a complete picture.
Why do static network diagrams go stale?
Static diagrams are manually created snapshots. Because networks change frequently through device additions, link changes, VLAN reconfigurations, and failover events, a static diagram becomes inaccurate almost immediately after it is created.
Can topology mapping show application connections?
Yes. Modern topology tools can map live TCP and UDP connections between processes, containers, and services, providing an application-layer connectivity graph on top of the physical and logical network fabric.
How does Netdata build its topology map?
The Netdata Topology Viewer builds the map live from LLDP, CDP, BGP, OSPF, FDB/STP inference, and live application-layer connections. It supports tunable confidence levels for inferred endpoints and lets you trace dependencies and dependants for any node in the graph.