


SNMP Monitoring Guide: How to Monitor Network Devices
To monitor SNMP devices you enable an SNMP agent on the device, open UDP/161 from the monitoring host, point your monitoring tool at the device with the correct credentials, and poll interface and health counters on a fixed interval. SNMP works by having a central manager query an agent that exposes numeric objects (OIDs) defined in MIBs, with optional push notifications (traps) for event-driven signals. The bulk of day-to-day network monitoring (interface utilization, errors, port state, CPU, memory) comes from periodic polling of those OIDs.
This guide walks through the practical steps, the protocol choices you need to make, and how to verify your setup is actually returning useful data.
What you are actually monitoring
SNMP is the standard protocol for monitoring network gear: switches, routers, firewalls, load balancers, wireless controllers, and similar appliances. The model has two moving parts:
- Manager - the monitoring system that initiates polls.
- Agent - the service running on the device that answers polls and optionally sends traps.
The manager polls the agent over UDP/161. The agent can also push unsolicited notifications called traps to the manager over UDP/162. Most metrics come from polling; traps are used for asynchronous events such as a link going down or a power supply failure.
The data itself is exposed as OIDs (object identifiers), organized into MIBs (Management Information Bases). An OID is a dotted numeric path (for example 1.3.6.1.2.1.2.2.1.10) that points to a specific value. MIB files provide the human-readable names and type definitions for those OIDs.
Interface OIDs you will rely on
For interface monitoring, a small set of OIDs does most of the work:
| OID name | What it gives you | Notes |
|---|---|---|
ifOperStatus | Operational state of the interface (up/down/testing) | Use for link state alerts |
ifInOctets / ifOutOctets | Bytes in/out (32-bit counters) | Use ifHCInOctets / ifHCOutOctets on fast links to avoid counter rollover |
ifHCInOctets / ifHCOutOctets | Bytes in/out (64-bit counters) | Prefer these on Gigabit+ links |
ifInErrors / ifOutErrors | Packet errors seen on the interface | Rising rate indicates physical or duplex problems |
ifInDiscards / ifOutDiscards | Packets intentionally dropped | Often buffer pressure or policy drops |
Rates are not returned directly. The monitoring tool computes them from counter deltas anchored to sysUpTime, so consistent polling intervals matter.
SNMP versions: pick the right one
There are three protocol versions in common use. The choice affects security more than functionality.
| Version | Auth model | Encryption | When to use |
|---|---|---|---|
| SNMPv1 | Plaintext community string | None | Legacy only; avoid |
| SNMPv2c | Plaintext community string | None | Acceptable on isolated management networks |
| SNMPv3 (USM) | Username + auth (MD5 or SHA) | Optional privacy (DES or AES) | Preferred for production |
SNMPv2c is the pragmatic default in controlled lab environments because it is simple to configure. In production, especially across routed segments or shared infrastructure, SNMPv3 should be the default. The community string in v1/v2c travels in cleartext on every poll, and anyone who captures it can read (and in some configurations write) device state.
How to monitor SNMP devices: step by step
Step 1 - Enable SNMP on the device
Log into the device and enable the SNMP agent. The exact commands vary by vendor, but the decisions are the same:
- Decide on the protocol version (v2c or v3).
- If v2c: set a community string and restrict which source IPs can use it.
- If v3: create a USM user with an auth password (and optionally a privacy password).
- Restrict access to the management interface or specific VLAN where possible.
Example pattern for v2c (vendor syntax differs): enable SNMP, set a read-only community, and allow the monitoring host’s IP.
Example pattern for v3: create a group with authPriv access, create a user in that group with SHA auth and AES privacy, and bind the SNMP process to the management interface.
Step 2 - Allow UDP/161 from the monitoring host
Make sure the path between your monitoring system and the device is open:
- Permit UDP/161 inbound on the device ACL or firewall from the monitoring host (or its source NAT address).
- If the monitoring host is behind a NAT or jump host, confirm the source IP the device will actually see.
- For traps, also allow UDP/162 inbound on the monitoring host if you plan to receive them.
Do not open UDP/161 to broad subnets. Scope the rule to the monitoring system.
Step 3 - Point the monitoring tool at the device
In your monitoring tool, add the device with:
- IP address or hostname
- Port (default 161, UDP)
- SNMP version
- Credentials (community string for v2c, or USM user/auth/priv for v3)
If the tool supports vendor profiles or MIB auto-detection, let it identify the device from its system OID rather than hand-mapping OIDs. This avoids a lot of trial and error.
Step 4 - Verify with a poll
Before declaring success, confirm you are getting real data:
- Poll
sysDescrandsysUpTimeto confirm the agent responds and you have the right device. - Walk the interface table (
ifTable/ifXTable) and check that interface names and counters come back. - Confirm
ifOperStatusreflects the ports you expect to be up. - Let the tool run for at least two polling cycles so rates can be computed from deltas.
If the poll times out, check the obvious causes first: wrong community string or USM credentials, UDP/161 blocked by a firewall, SNMP not enabled on the device, or the agent bound to the wrong interface.
Step 5 - Decide your polling interval
The polling interval is a tradeoff between visibility and device load:
- Every 1-5 seconds - high-fidelity, suitable for critical links and capable devices. Needed if you want to catch microbursts or short outages.
- Every 30-60 seconds - typical default. Good balance for most environments.
- Every 5-15 minutes - low load, but you will miss short events and rate calculations get coarse.
Be aware that polling a device too aggressively, especially walking large tables, can stress its control plane. See our guide on SNMP polling storms for how to diagnose and avoid this.
Step 6 - Optionally enable traps
Polling is periodic; traps give you immediate notification of specific events. Common trap sources include link down/up, BGP session changes, power supply failures, and environmental thresholds.
To use traps:
- Configure the device to send traps to the monitoring host on UDP/162.
- Allow UDP/162 inbound on the monitoring host.
- Load the relevant MIBs in your trap receiver so the notifications are decoded into readable names.
Traps complement polling; they do not replace it. A trap tells you something happened, but you still poll counters to quantify the impact.
Common problems and fixes
| Symptom | Likely cause | Fix |
|---|---|---|
| Poll times out | UDP/161 blocked or wrong credentials | Verify firewall rules and community/USM settings |
| Data returns but rates are zero | Only one poll completed | Wait for at least two cycles so deltas can be computed |
| Interface counters wrap unexpectedly | Using 32-bit ifOctets on high-speed links | Switch to 64-bit ifHC* counters |
| Traps not arriving | UDP/162 blocked on receiver | Check inbound firewall on the monitoring host |
| Device CPU spikes during polling | Walking too many OIDs too frequently | Increase interval or narrow the OID set |
How SNMP device monitoring looks in practice
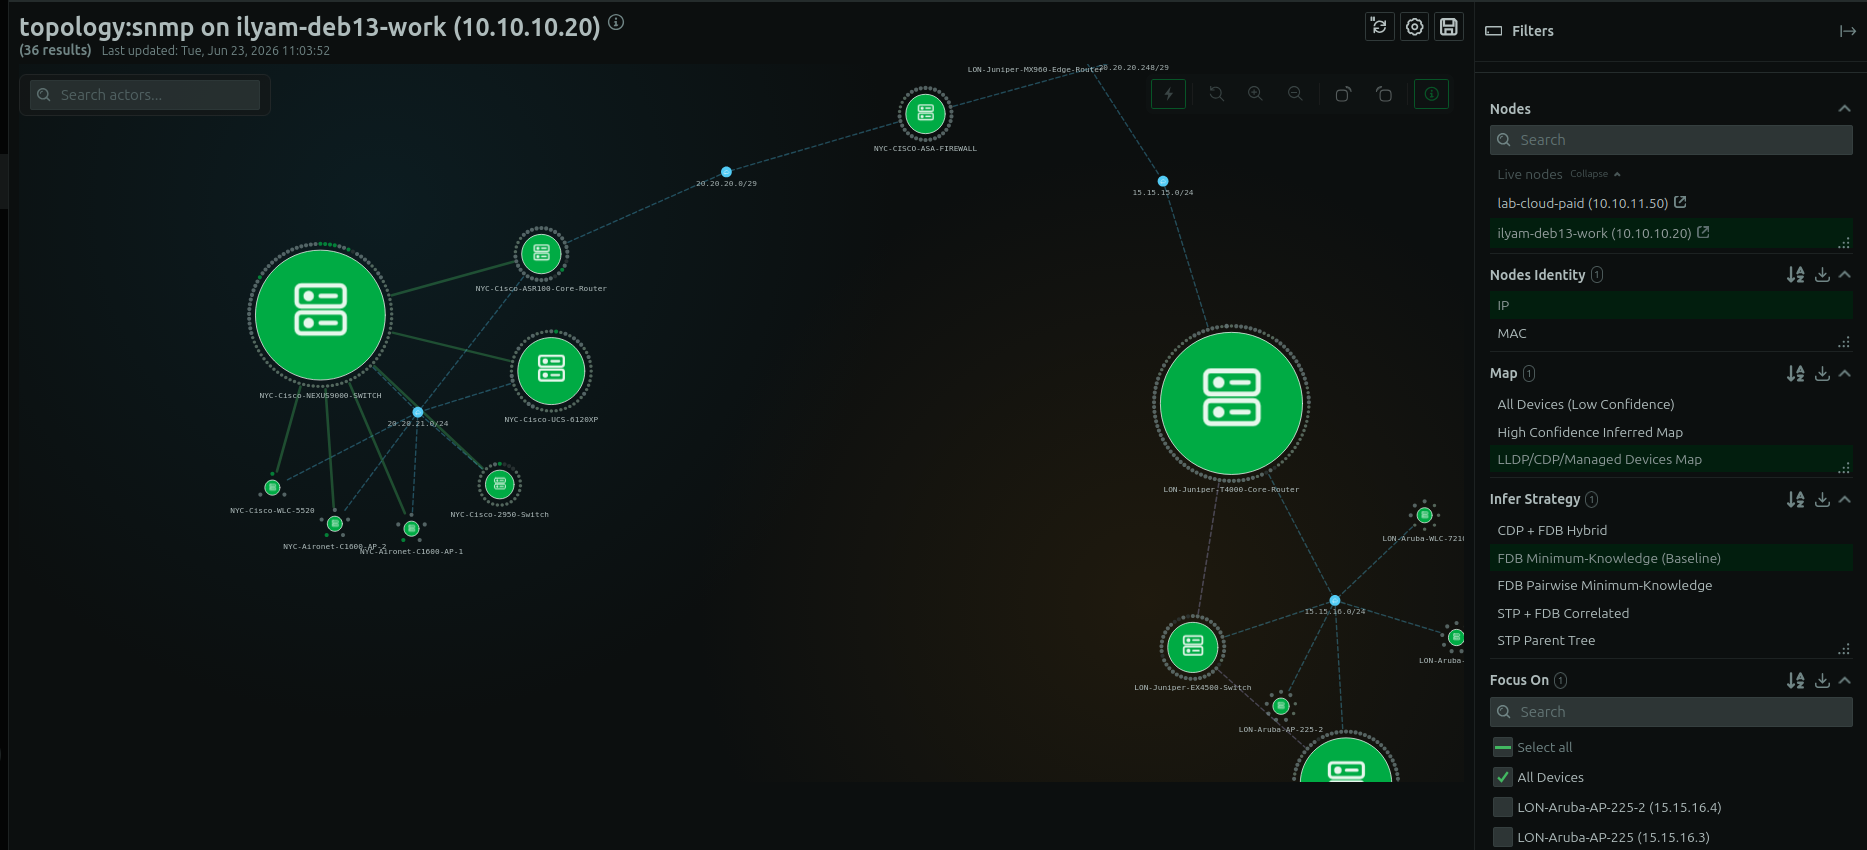
Once devices are discovered and polled, they show up in a dashboard with interface metrics, device health, and topology context. The goal is to go from “is the device up?” to “which interface is saturating, and what is connected to it?” in a single view.

SNMP monitoring with Netdata
Netdata automates much of the manual work described above. Rather than hand-mapping MIBs and OIDs, Netdata ships 100+ vendor profiles (Cisco, Juniper, Aruba, Palo Alto, FortiGate, F5, and more) that auto-match a device by its system OID. The correct OIDs are polled automatically with no manual MIB mapping.
Key capabilities:
- Protocol support - SNMPv1, v2c, and v3 (USM with auth and encryption).
- Auto-discovery - zero-config device discovery across subnets (must be explicitly enabled), so newly added devices show up without manual registration.
- Vendor profiles - 100+ profiles that match on system OID and poll the right objects per device type.
- Fast polling - per-second polling where the device can sustain it, so you get high-resolution visibility instead of minute-level averages.
- Anomaly detection - machine learning flags unusual behaviour on interface metrics without manual thresholds.
Discovered devices appear in the Network Monitor dashboard and on the live topology map, so you can see both device health and the relationships between devices. For a broader look at what Netdata covers, see network device monitoring and device discovery, or browse the network monitoring use cases.
FAQ
What port does SNMP use?
SNMP polling uses UDP/161. SNMP traps are sent to UDP/162 on the monitoring host.
Should I use SNMPv2c or SNMPv3?
Use SNMPv3 in production. SNMPv2c uses a plaintext community string that is transmitted in cleartext on every poll. SNMPv3 adds USM authentication (MD5 or SHA) and optional encryption (DES or AES). SNMPv2c is acceptable only on isolated, trusted management networks.
What OIDs should I poll for interface monitoring?
Start with ifOperStatus for link state, ifHCInOctets and ifHCOutOctets for traffic volume (the 64-bit counters), and ifInErrors, ifOutErrors, ifInDiscards, and ifOutDiscards for error and drop rates. On fast links, always prefer the 64-bit ifHC* counters over the 32-bit if* counters to avoid rollover.
How often should I poll SNMP devices?
It depends on the device and your visibility needs. Every 30-60 seconds is a common default. Per-second polling is useful for critical links but only on devices that can sustain the load. Avoid walking large tables too frequently, as it can stress the device control plane.
Do I need traps if I am already polling?
Traps are optional but useful. Polling tells you the current state on a fixed cadence; traps deliver immediate notification of events like link down, BGP changes, or hardware failures. The two complement each other: traps alert you fast, polling quantifies the impact.