


SNMP Traps vs Polling: What Is the Difference?
SNMP polling is a pull model where a monitoring server periodically queries a device over UDP port 161 to read metrics and state. SNMP traps are a push model where the device itself sends an unsolicited notification over UDP port 162 the instant an event occurs. The two are not competing choices: mature network monitoring uses polling for continuous metrics and traps for immediate event alerts.
What is SNMP polling?
Polling is the classic request-response model at the heart of SNMP-based monitoring. A central manager (your monitoring system) sends a GET, GETNEXT, or GETBULK request to an SNMP agent running on a router, switch, UPS, or other networked device. The agent responds with the requested values.
Key characteristics:
- Scheduled and deterministic. You decide the interval - every 30 seconds, every minute, every five minutes - so data points arrive at a predictable cadence.
- Ideal for continuous metrics. Interface counters, CPU load, memory usage, environmental sensor readings, and configuration state all lend themselves to polling because you want a steady time series, not a one-off event.
- Reliable at the application layer. If a poll fails, the manager simply retries on the next cycle. Missing data points are visible as gaps, which is acceptable for trend analysis.
- Blind between polls. If a link flaps and recovers within your poll interval, you may never see it. The faster things change, the less a fixed schedule captures.
- Scalability ceiling. Polling thousands of OIDs across hundreds of devices at short intervals can exhaust the poller. When the poller falls behind, data becomes late or missing across the board - a problem that grows with fleet size.
What is an SNMP trap?
A trap is an unsolicited, event-driven notification pushed by the device. When something noteworthy happens - a port goes down, an authentication fails, a power supply faults, a BGP session drops - the device sends a trap to a configured management address without being asked.
Key characteristics:
- Immediate. The notification leaves the device the moment the event is detected, not at the next scheduled poll.
- Low overhead. The device only sends data when something happens, which is efficient for both the network and the device CPU when events are rare.
- No delivery guarantee. Traps use UDP port 162, so there is no acknowledgement and no retry at the transport layer. A trap dropped during a burst (a power event that triggers hundreds of devices simultaneously) is gone unless something retransmits it.
- Vendor-flavored. Trap payloads depend heavily on vendor MIBs. Two vendors may describe the same condition differently, which complicates parsing and normalization.
- INFORMs add acknowledgement. SNMPv2c and SNMPv3 introduce INFORM requests, which are essentially acknowledged traps. The receiver must confirm receipt, enabling retransmission. This improves reliability at the cost of more protocol overhead.
Traps are not a substitute for continuous metrics. They tell you that an event happened, but they do not give you the ongoing time-series data needed to understand baselines, trends, or the full picture of device health.
SNMP traps vs polling: comparison table
| Dimension | Polling | Traps |
|---|---|---|
| Communication direction | Pull (manager requests) | Push (device sends) |
| Transport / port | UDP / 161 | UDP / 162 |
| Timing | Scheduled interval | Event-driven, immediate |
| Reliability | Manager retries on next cycle | No transport-level guarantee (INFORMs add acknowledgement) |
| Best for | Continuous metrics and state (counters, CPU, memory, topology) | Immediate event notification (link down, auth failure, hardware fault) |
| Key weakness | Blind between polls; poller scalability limits | Lossy under burst; vendor-specific payloads; no time-series coverage |
How the two models work together
Polling and traps answer different questions. Polling answers “what is the current state and how is it trending over time?” Traps answer “what just happened that I should know about right now?”
Consider a core switch. Polling tells you that interface utilization on port 47 has been climbing for the last hour and that CPU is at 80%. A trap tells you that the BGP session to your upstream provider went down at 14:03:07. Neither message is complete on its own. The trap gives you the precise moment and nature of the event; the polled metrics give you the context to understand why it mattered and whether the device was already under stress.
A monitoring strategy that relies only on traps will miss slow degradation and capacity trends. A strategy that relies only on polling will miss transient events that occur between cycles. Doing both is the standard approach in production network operations.
Common pitfalls and misconceptions
“Traps replace polling.” They do not. Traps carry event data, not time-series metrics. You cannot reconstruct bandwidth utilization, CPU trends, or environmental baselines from traps alone.
“Polling is more reliable than traps.” Only in the sense that the manager controls the cadence and retries. But polling is subject to its own failure mode - poller overload - which can silently degrade data collection across the entire fleet.
“Traps always arrive.” Standard traps (v1 and v2c) use unacknowledged UDP. Under burst conditions or congestion, traps are dropped. If delivery matters, use INFORMs (SNMPv2c/v3) and ensure your receiver handles acknowledgements.
“All vendors describe the same trap.” Trap definitions vary significantly across vendors. A “linkDown” trap from vendor A may include different OIDs and formatting than one from vendor B. Without proper MIB coverage and decoding, traps arrive as opaque hex or generic text, limiting their usefulness.
“Polling faster solves everything.” Reducing the poll interval helps with latency to detection, but it increases load on both the poller and the devices. Eventually the poller cannot keep up, and data quality degrades across all devices, not just the busy ones.
A real-world example
A datacenter has 500 network devices. The monitoring system polls interface counters, CPU, memory, and environmental sensors every 10 seconds. This produces the baseline time series used for dashboards, capacity planning, and anomaly detection.
One morning, a power distribution unit in rack 12 reports a fault. The PDU sends a trap immediately - it does not wait for the next poll. The trap receiver decodes it, assigns a severity, and correlates it against the polled metrics for that device. The on-call engineer sees both the event (power supply fault at 03:14) and the context (the PDU’s temperature had been rising for the previous 40 minutes, visible in the polled data).
Without polling, the rising temperature trend would be invisible. Without traps, the precise moment of the fault and its vendor-specific details would be missed or delayed until the next poll cycle.
SNMP traps and polling with Netdata
Netdata supports both models, so you do not have to choose one or build a separate pipeline for each.
On the polling side, Netdata collects metrics from SNMP devices using 100+ vendor profiles, covering the OIDs and data collection patterns specific to each manufacturer. Where the device and network can sustain it, Netdata polls at per-second granularity, giving you high-resolution time series rather than coarse averages.
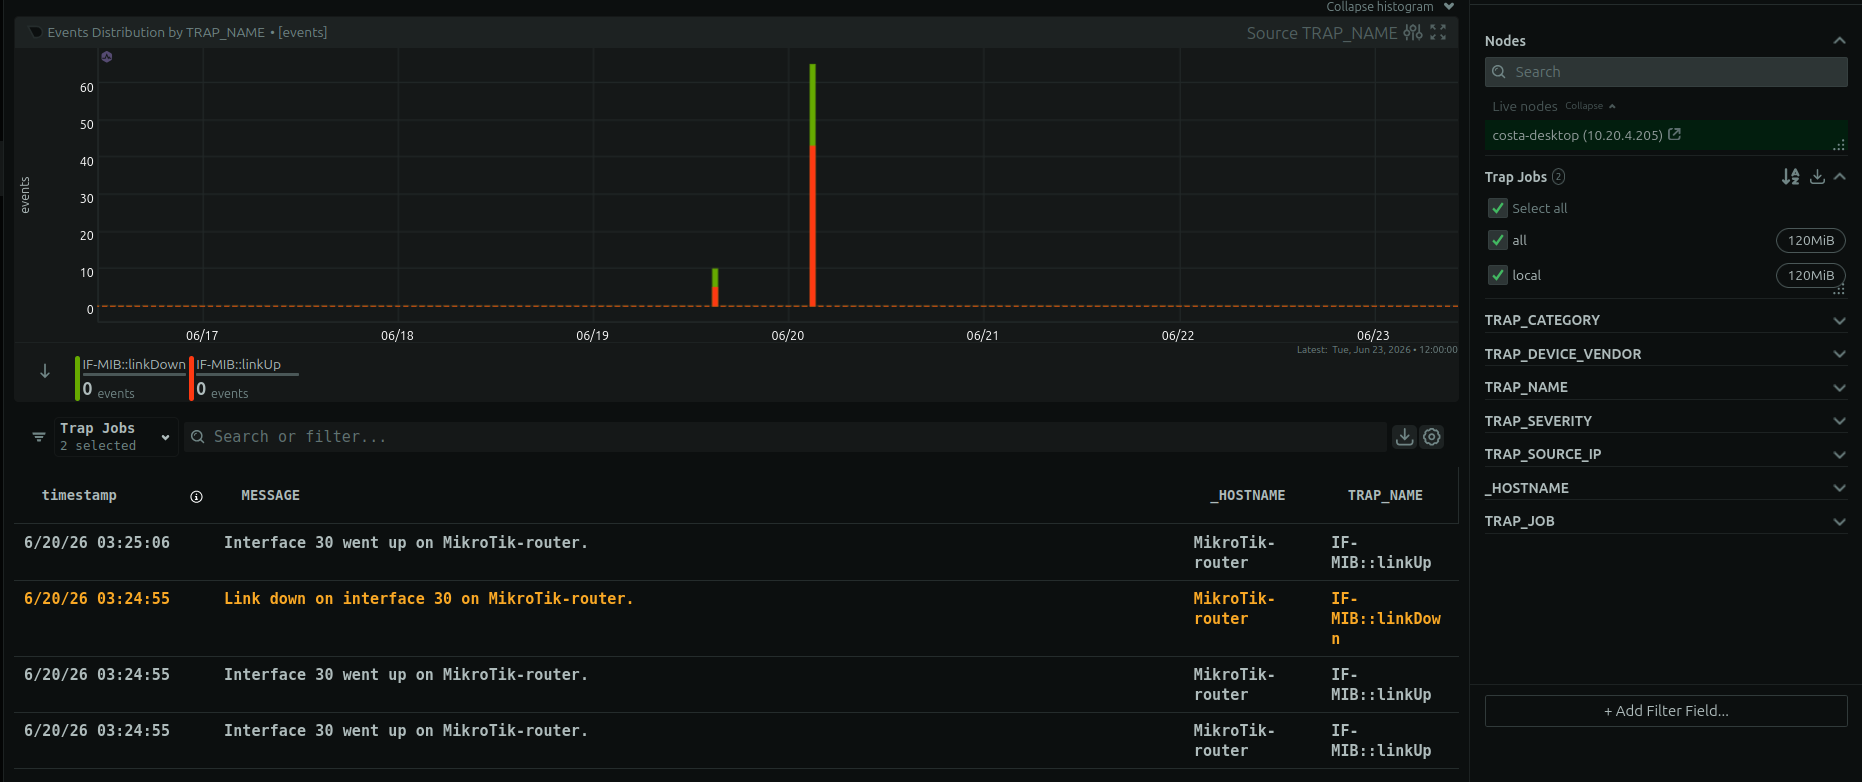
On the trap side, Netdata includes a native SNMP trap receiver that decodes v1, v2c, and v3 traps and INFORMs against a library of 150,000+ trap definitions from 800+ vendors. Each decoded trap becomes a structured, categorized, severity-tagged log entry. Because traps, metrics, and topology are unified in one place, you can correlate an event with the exact device metrics and surrounding context without switching tools.
For a deeper look at setting up collection, see the SNMP monitoring guide. To understand how traps are received and decoded in detail, visit the SNMP traps feature page. For the broader picture of monitoring routers, switches, and other network infrastructure, see network device monitoring and the network monitoring solutions page.
FAQ
Should I use SNMP traps or polling?
Use both. Polling gives you continuous metrics and state over time. Traps give you immediate, event-driven notifications. Relying on only one leaves a gap in visibility - polling misses transient events, and traps miss trends and baselines.
Why are SNMP traps unreliable?
Standard SNMP traps (v1 and v2c) use unacknowledged UDP on port 162. There is no transport-level delivery guarantee, and traps can be dropped during bursts or congestion. INFORM requests (v2c and v3) add acknowledgement and retransmission, improving reliability.
What port does SNMP polling use? What port do traps use?
Polling uses UDP port 161 for GET, GETNEXT, and GETBULK requests from the manager to the agent. Traps and INFORMs use UDP port 162, sent from the device to the management station.
Can traps replace polling for monitoring?
No. Traps are event notifications, not time-series data. They tell you something happened, but they cannot provide continuous metrics like interface throughput, CPU utilization, or memory usage over time.
What is the difference between a trap and an INFORM?
A trap is an unacknowledged notification - the device sends it and moves on. An INFORM (introduced in SNMPv2c, also in v3) is an acknowledged notification - the receiver must confirm receipt, and the sender retransmits if no acknowledgement arrives. INFORMs are more reliable but add protocol overhead.