


What are the important Cassandra metrics to monitor and how to monitor them.
What Is Cassandra & Why Use It
Cassandra is an open-source, distributed, wide-column NoSQL database management system written in Java. Cassandra was originally developed by Avinash Lakshmanan and Prashant Malik at Facebook and then released as open source, eventually becoming part of the Apache project.
Cassandra is a NoSQL database - NoSQL (also known as “not only SQL”) databases do not require data to be stored in tabular format. They provide flexible schemas and scale easily with large amounts of data and high user loads.
Cassandra also offers some key advantages over other NoSQL databases:
- High scalability (Throughput scales almost linearly with size of cluster)
- High availability (No single point of failure)
- Handles high volumes like a champ
For these reasons Cassandra is used by large organizations such as Apple, Netflix, Facebook and others.
How To Monitor Cassandra Performance
When using Cassandra in production it becomes crucial to quickly detect any issues or problems (including but not limited to read/write latency, errors and exceptions) that may arise and rectify them as soon as possible.
To achieve this, thorough monitoring of Cassandra is essential!
Cassandra exposes metrics via JMX (Java Management Extensions) and there are a few different ways in which you can access them including nodetool, Jconsole or a JMX integration. While nodetool and Jconsole are very useful tools and the right choice if you just want a quick view of what’s happening right now - a more comprehensive JMX integration is the way to go for detailed troubleshooting. Netdata uses the Prometheus JMX integration to collect Cassandra metrics.
Cassandra Monitoring - Best Practices
Effective monitoring is crucial to ensure the optimal performance and reliability of your Cassandra database. By following these best practices, you can proactively identify and address potential issues before they impact your operations.
- Baseline Performance: Establish baseline metrics for normal operation to detect anomalies.
- Continuous Monitoring: Set up continuous monitoring to catch issues early.
- Comprehensive Coverage: Monitor all critical aspects, including latency, throughput, resource utilization, and node health.
- Alert Configuration: Configure alerts for critical metrics to respond quickly to issues.
- Regular Maintenance: Perform regular maintenance tasks such as cleanup of tombstones and repair operations.
- Capacity Planning: Monitor and plan for capacity to handle growth in data and traffic.
The Role Of Nodetool In Monitoring Cassandra
Nodetool is a command-line tool that allows administrators to manage and monitor Cassandra clusters. Commonly used nodetool commands include:
- nodetool status: Provides the status of nodes in the cluster.
- nodetool info: Shows general information about the node.
- nodetool tpstats: Displays thread pool statistics.
- nodetool cfstats: Provides column family statistics.
- nodetool compactionstats: Shows compaction statistics.
Key Metrics To Monitor
There are hundreds of possible metrics that can be collected from Cassandra - and it can get a bit overwhelming. So let’s try and keep things simple, by going through the most important metrics that will help you to monitor the performance of your Cassandra cluster.
Throughput
Monitoring the throughput of a Cassandra cluster in terms of the read and write requests received is crucial to understand overall performance and activity levels. This information should also guide you when it comes to choosing the right compaction strategy - which may vary, depending on whether your workload is read-heavy or write-heavy.
- Read request rate: Client reads per second.
- Write request rate: Client writes per second.
If your data is modeled properly, Cassandra offers near linear scalability.

Source: Benchmarking Cassandra Scalability (Netflix Tech Blog)
Latency
Latency often acts as the canary in the coal mine and monitoring latency gives you an early warning about upcoming performance bottlenecks or a shift in usage patterns. Latency can be impacted by disk access, network latency or replication configuration.
Latency is measured in a couple of different ways. Latency across reads and writes are measured as a histogram with percentile bins of 50th, 75th, 95th, 98th, 99th, 99.9th so you understand the latency distribution across time. Cassandra uses a histogram with an exponentially decaying reservoir which is representative (roughly) of the last 5 minutes of data. The total latency (summed across all requests) is also measured and presented in a different chart.
Total Read latency: Total response latency summed over all read requests.
Total Write latency: Total response latency summed over all write requests.
Read latency histogram: 50th, 75th, 90th, 95th, 99th, 99.9th percentile values of read latency.
Write latency histogram: 50th, 75th, 90th, 95th, 99th, 99.9th percentile values of write latency.
Consistently high latency or even occasional and infrequent spikes in latency could point to systemic issues with the cluster such as:
- Reaching the limits of available processing capacity
- Issues with the data model
- Issues with the underlying infrastructure
Cache
Cassandra provides built-in efficient caching functionality through the key cache and row cache. Key caching is enabled by default and holds the location of keys in memory per column family. It is recommended for most common scenarios and a high key cache utilization is desirable. If the key cache hit ratio is consistently < 80% or cache misses are consistently seen, consider increasing the key cache size.
- Key cache hit ratio: Key cache hit ratio indicates the efficiency of the key cache.
- Key cache hit rate: Key cache hits and misses per second.
- Key cache utilization: Utilization of key cache in percentage.
- Key cache size: Size of key cache.
Row cache, unlike the key cache, is not enabled by default and stores the entire contents of the row in memory and is intended for more specialized use-cases. For example, if you have a small subset of data that gets access frequently, and with each access you need almost all of the columns returned using a row cache would be a good fit. For these specialized use-cases row cache can bring about very significant gains in efficiency and performance.
- Row cache hit ratio: Row cache hit ratio indicates the efficiency of the key cache.
- Row cache hit rate: Row cache hits and misses per second.
- Row cache utilization: Utilization of row cache in percentage.
- Row cache size: Size of row cache.
Disk Usage
Monitoring disk usage levels and patterns is key for Cassandra - as it is for other data stores. It is recommended to budget for free disk space at all times so that there is always available disk space for Cassandra to perform operations which temporarily use up additional disk space, such as compaction. How much free disk space should be maintained depends on the compaction strategy, but 30% is generally considered a reasonable default.
- Disk space used by live data: Amount of live disk space used. This does not include obsolete data waiting to be garbage collected.

Compaction
In Cassandra, writes are written to the commit log and to the active Memtable. Memtables are later flushed to disk, to a file called SSTable. Compaction is the background process by which Cassandra reconciles copies of data spread across different SSTables. Compaction is crucial for improving read performance and enables Cassandra to store fewer SSTables.
Picking the right compaction strategy based on the workload will ensure the best performance for both querying and for compaction itself.
The different compaction strategies that Cassandra uses are:
- Size Tiered Compaction Strategy (STCS): The default compaction strategy. Useful as a fallback when other strategies don’t fit the workload. Most useful for non-pure time series workloads with spinning disks, or when the I/O from LCS is too high.
- Leveled Compaction Strategy (LCS): Leveled Compaction Strategy (LCS) is optimized for read heavy workloads, or workloads with lots of updates and deletes. It is not a good choice for immutable time series data.
- Time Window Compaction Strategy (TWCS): Time Window Compaction Strategy is designed for TTL’ed, mostly immutable time series data.
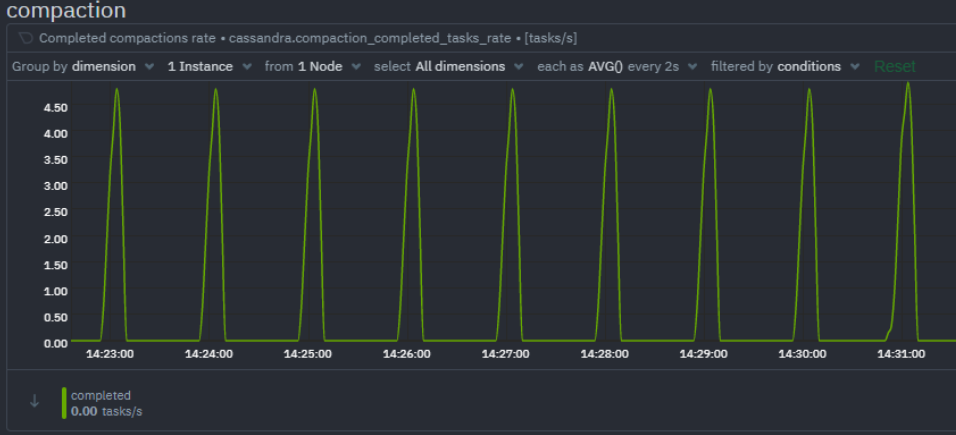
Compaction performance can be understood by monitoring the rate of completed compaction tasks and pending compaction tasks. A growing queue of pending compaction tasks means the Cassandra cluster is struggling to keep up with the workload.
- Completed compactions rate: Compaction tasks completed per second.
- Compaction tasks pending: Total pending compaction tasks in queue.
- Compaction data rate: Compaction rate
Thread Pools
Cassandra, being based on Staged Event Driven Architecture (SEDA) separates different tasks in stages. Each stage has a queue and a thread pool. If these queues are filled up it could indicate potential performance issues.
- Active tasks: Total tasks currently being processed.
- Pending tasks: Total tasks in queue awaiting a thread for processing.
- Blocked tasks: Total tasks that cannot yet be queued for processing.
- Blocked tasks rate: Rate per second of tasks that cannot be queued for processing.
JVM Runtime
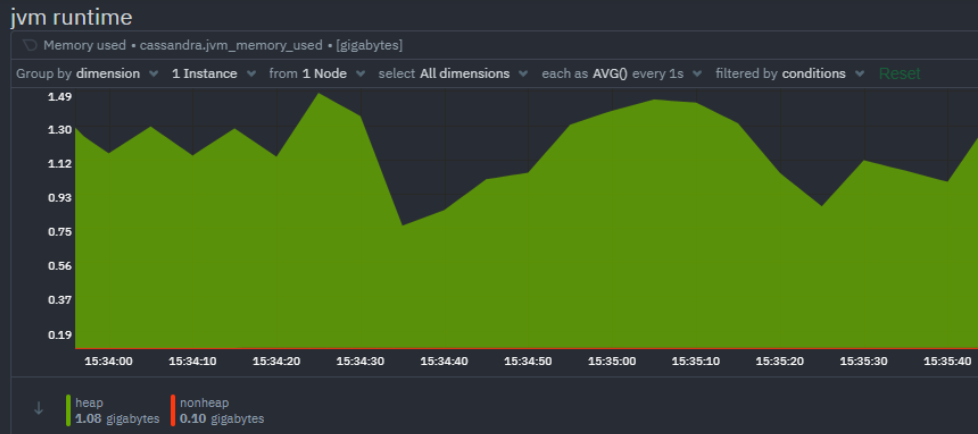
Cassandra is a Java application and utilizes the JVM runtime. There are of course a multitude of JVM metrics available but monitoring the memory usage and the garbage collection stats are of particular importance for Cassandra.
ParNew (young-generation) garbage collections occur relatively often. All application threads pause while ParNew garbage collection happens, so keep a close eye on ParNew latency as any significant increase here will considerably impact Cassandra’s performance.
ConcurrentMarkSweep or CMS (old-generation) garbage collection also temporarily stops application threads, but it does so intermittently. If CMS latency is consistently high it could mean your cluster is running out of memory and more nodes may need to be added to the cluster.
- Memory used: Total JVM memory used by Cassandra. Separate dimensions are used to measure heap memory usage vs non heap memory usage.
- Garbage collection rate
- ParNew: Rate of young generation garbage collection.
- CMS (ConcurrentMarkSweep): Rate of old generation garbage collection.
- Garbage collection time
- ParNew: Elapsed time of young generation garbage collection.
- CMS (ConcurrentMarkSweep): Elapsed time of old generation garbage collection.

Errors
It is crucial to monitor Cassandra’s own error and exception metrics. Possibly the most important one is the rate of unavailable exceptions, which could indicate that there are one or more nodes which have gone down.
- Timeout exceptions: Requests which were not acknowledged within the configurable timeout window.
- Unavailable exceptions: Requests for which the required number of nodes was unavailable.
- Storage exceptions: Requests for which a storage exception was encountered.
- Dropped messages: One minute rate of dropped messages.
- Failures: Client request failure rate.
Let Us Hear From You
All of the crucial Cassandra performance monitoring metrics mentioned above are monitored at high fidelity by Netdata. To find out more about how Netdata monitors Cassandra and how you can troubleshoot your Cassandra cluster, don’t forget to read the next part of this monitoring guide. We’d love to hear from you – if you have any questions, complaints or feedback please reach out to us on Discord or Github.
Happy Troubleshooting!
P.S If you haven’t already, sign up now for a free Netdata account!
Note: This post is the first part of a Cassandra monitoring series. Be sure to read our second entry here.