














A chart shows you that CPU jumped at 15:57. It doesn’t show you that a deploy went out at 15:56. Chart annotations let you pin a note to the exact moment on a chart, and it stays there for everyone in your Space, permanently, the next time anyone looks at that chart.
Pin a note to a moment
Deployments, incidents, config changes, maintenance windows: these events explain the shape of your metrics, but they usually live somewhere your dashboard can’t see, like a deploy log, a ticket, or a Slack thread someone will eventually delete. Chart annotations put that context on the chart itself, so you don’t have to cross-reference a separate system by hand.
An annotation is available in Netdata Cloud on any chart. Once created, it’s shared: every Space member looking at that chart sees it, with no separate lookup required.

Priority and color
Every annotation gets a priority, and priority sets its color:
| Priority | Color | Typical use |
|---|---|---|
| Debug | Grey | Experimental notes |
| Info | Blue (default) | Deployments, config changes |
| Warning | Yellow | Items that need attention |
| Error | Red | Failures, incidents |
| Critical | Dark red | Major outages, data loss |
A saved annotation renders as a solid, color-coded vertical line with a small dot at the top of the chart, so severity is visible before you even open it. An unsaved draft shows as a dashed grey marker until someone commits it.
Creating one
With the default Pan tool active, click anywhere on a chart at the timestamp you want to mark. A “New annotation” box opens right there. Type the note, pick a priority color, and press Enter (or the checkmark) to save.
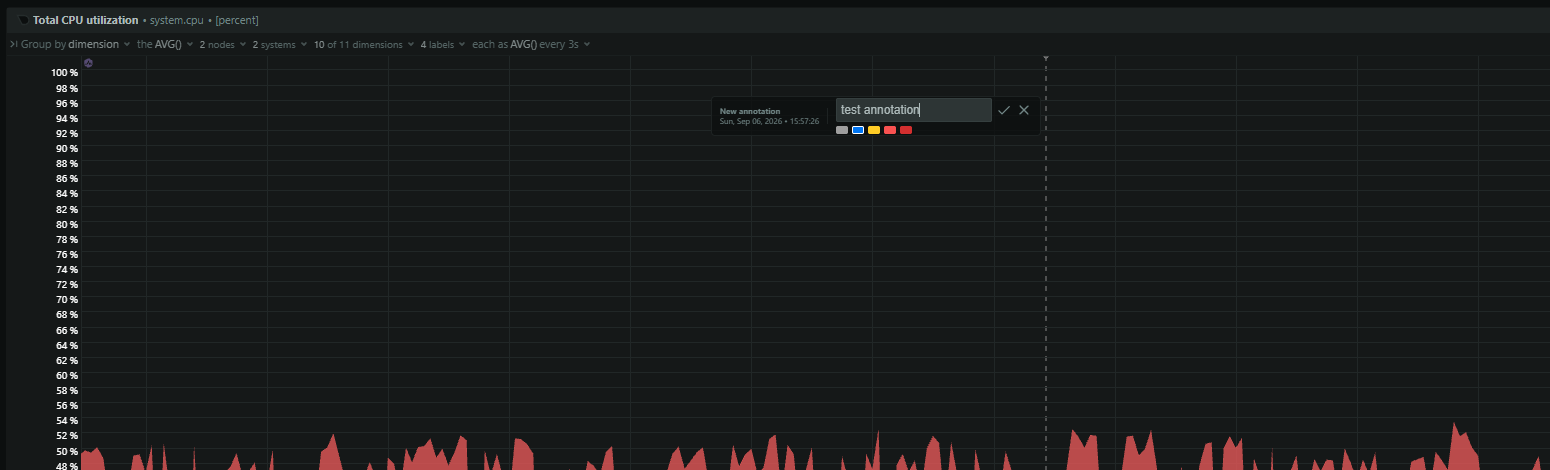
Chart-specific, global, or just for now
Annotations operate at three scopes:
- Chart-specific (the default): the annotation appears on every chart in the Space that shares the same context as the one you annotated.
- Global: double-click the globe icon on an annotation to promote it to every chart in the Space, for events like a full deploy or an incident that touched everything.
- Temporarily synced: while you’re looking at a chart with an annotation, dashed, semi-transparent copies briefly appear on other visible charts to help you spot correlated timing. They vanish on reload; nothing is created.
From annotation to root cause in one click
Click a saved annotation and the action bar shows the next step:
- Sync / make global: the globe icon promotes the annotation to every chart in the Space.
- Run metrics correlation: centered on a five-minute window around the annotation, so you can see what else moved at the same time.
- Copy URL: shares the dashboard with the time range already scoped to the annotation.
- Edit or delete: update the text or priority, or remove it.
The correlation button is the useful part: it gives you a starting point for the next investigation.
Who can create them
Chart annotations are a Netdata Cloud feature, so they don’t exist on a standalone Agent dashboard; they depend on being shared across a Space. Space Admins can create, edit, and delete annotations; every other role sees them read-only.
Getting started
Chart annotations are available now in Netdata Cloud. No configuration required; just click a chart. Full details, including the exact scope rules and action bar behavior, are in the chart annotations documentation.