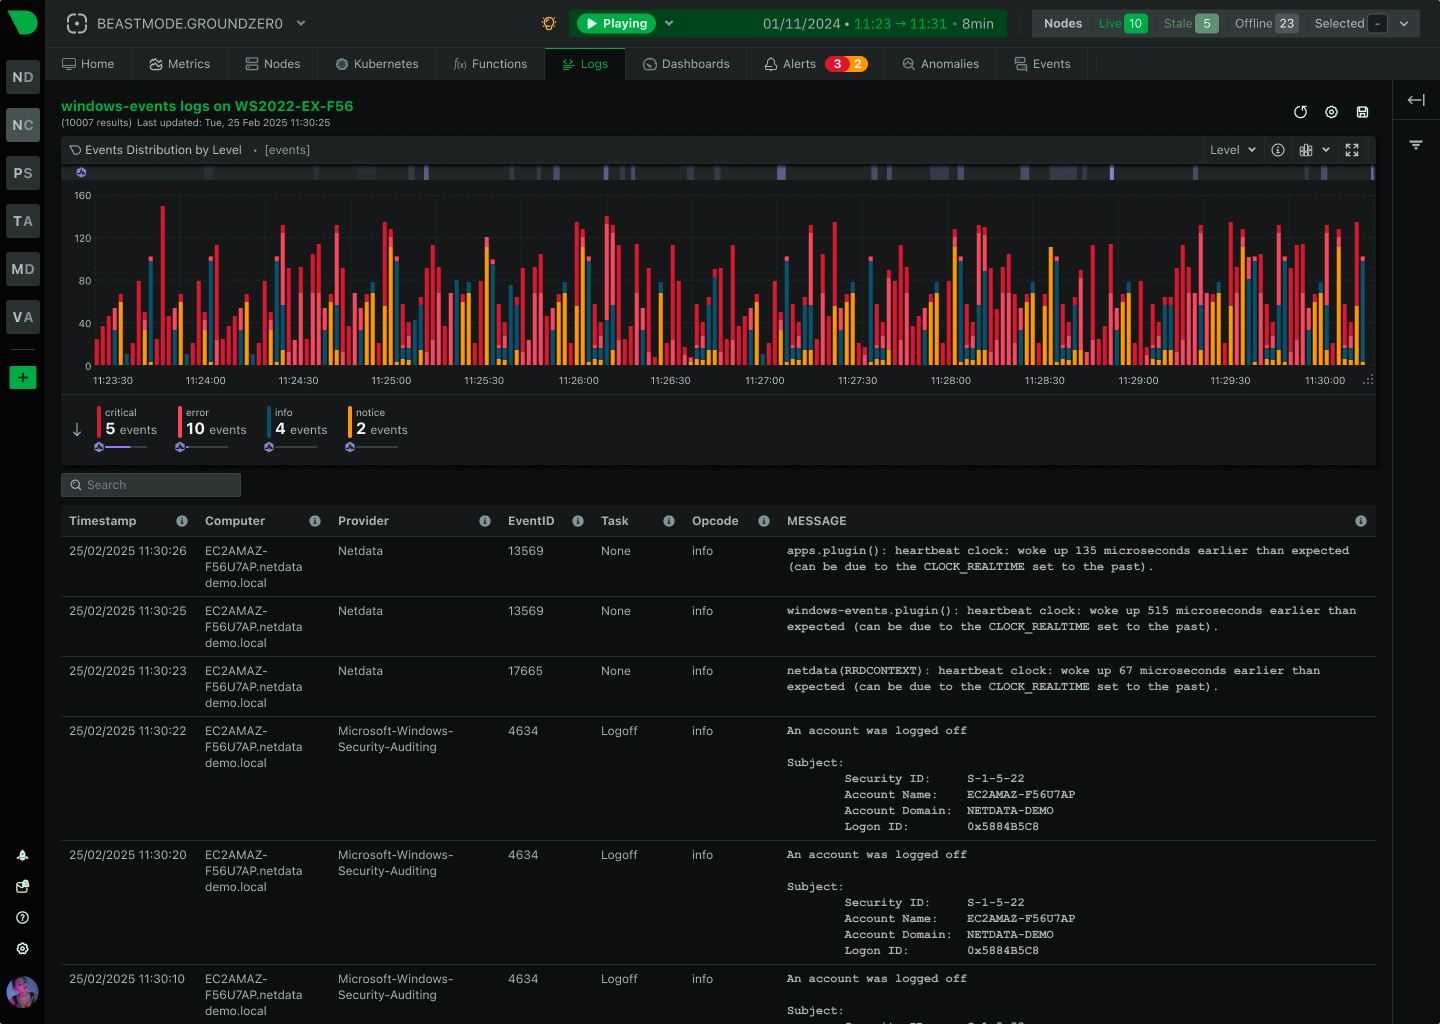
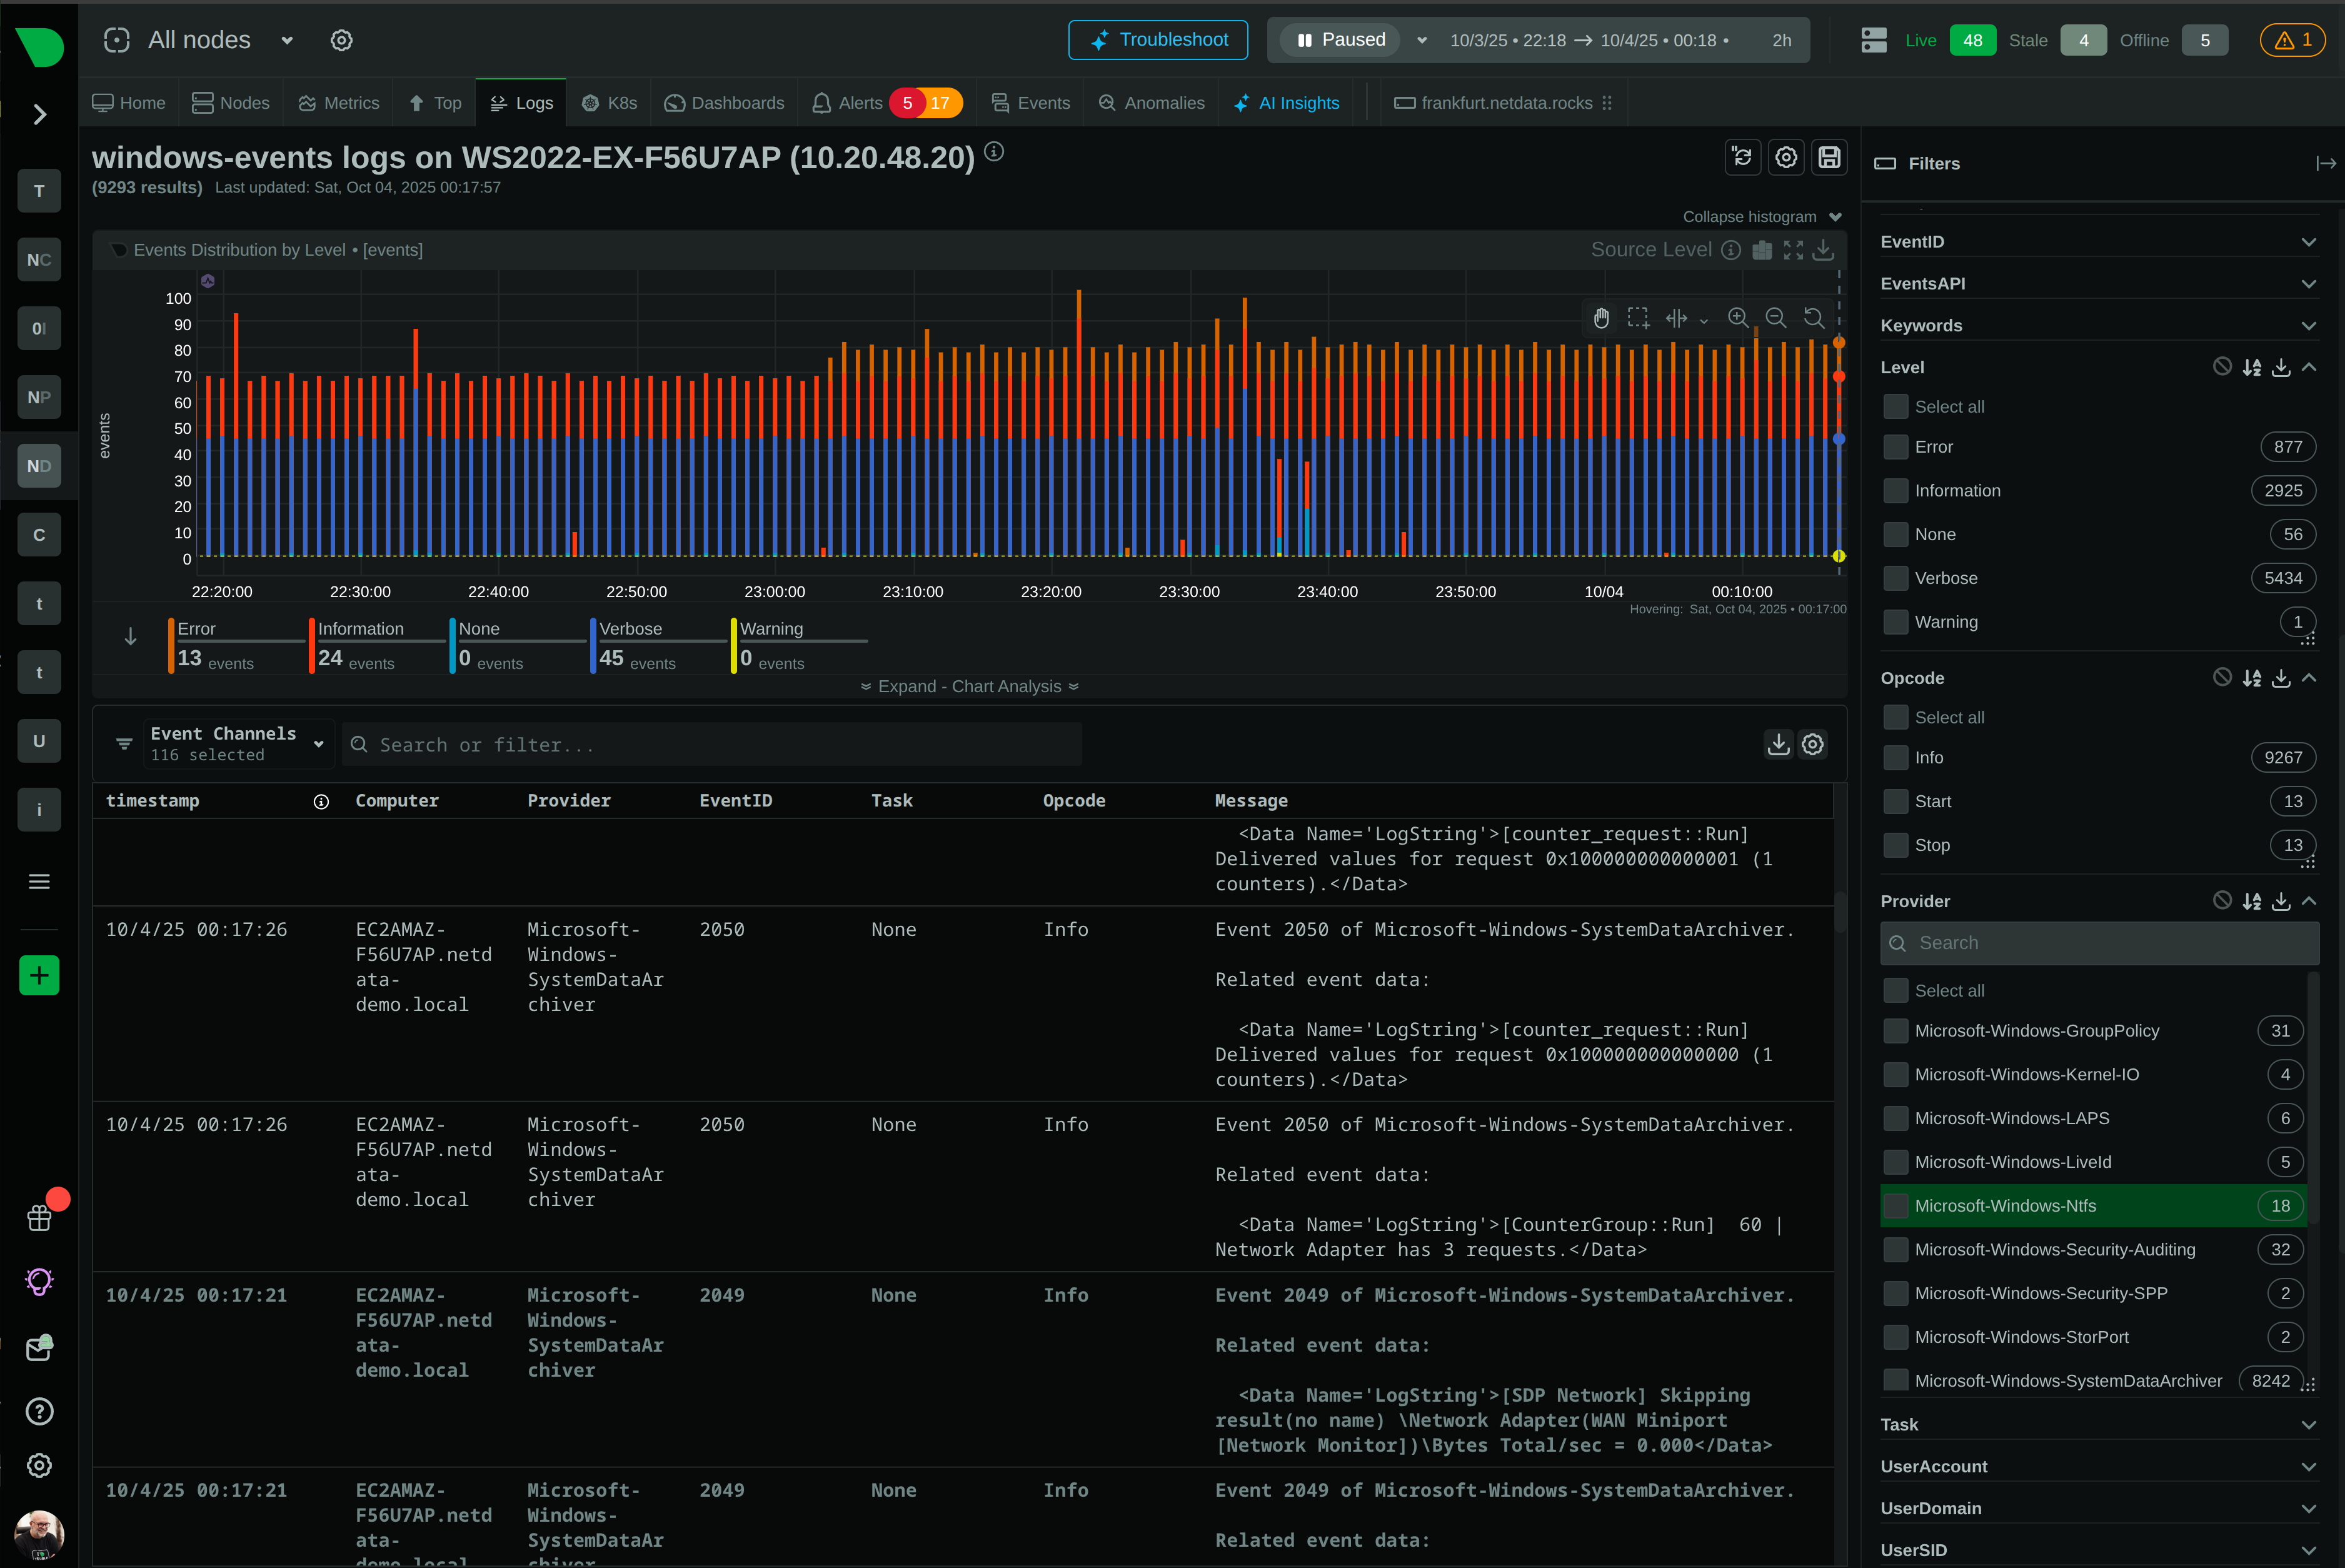
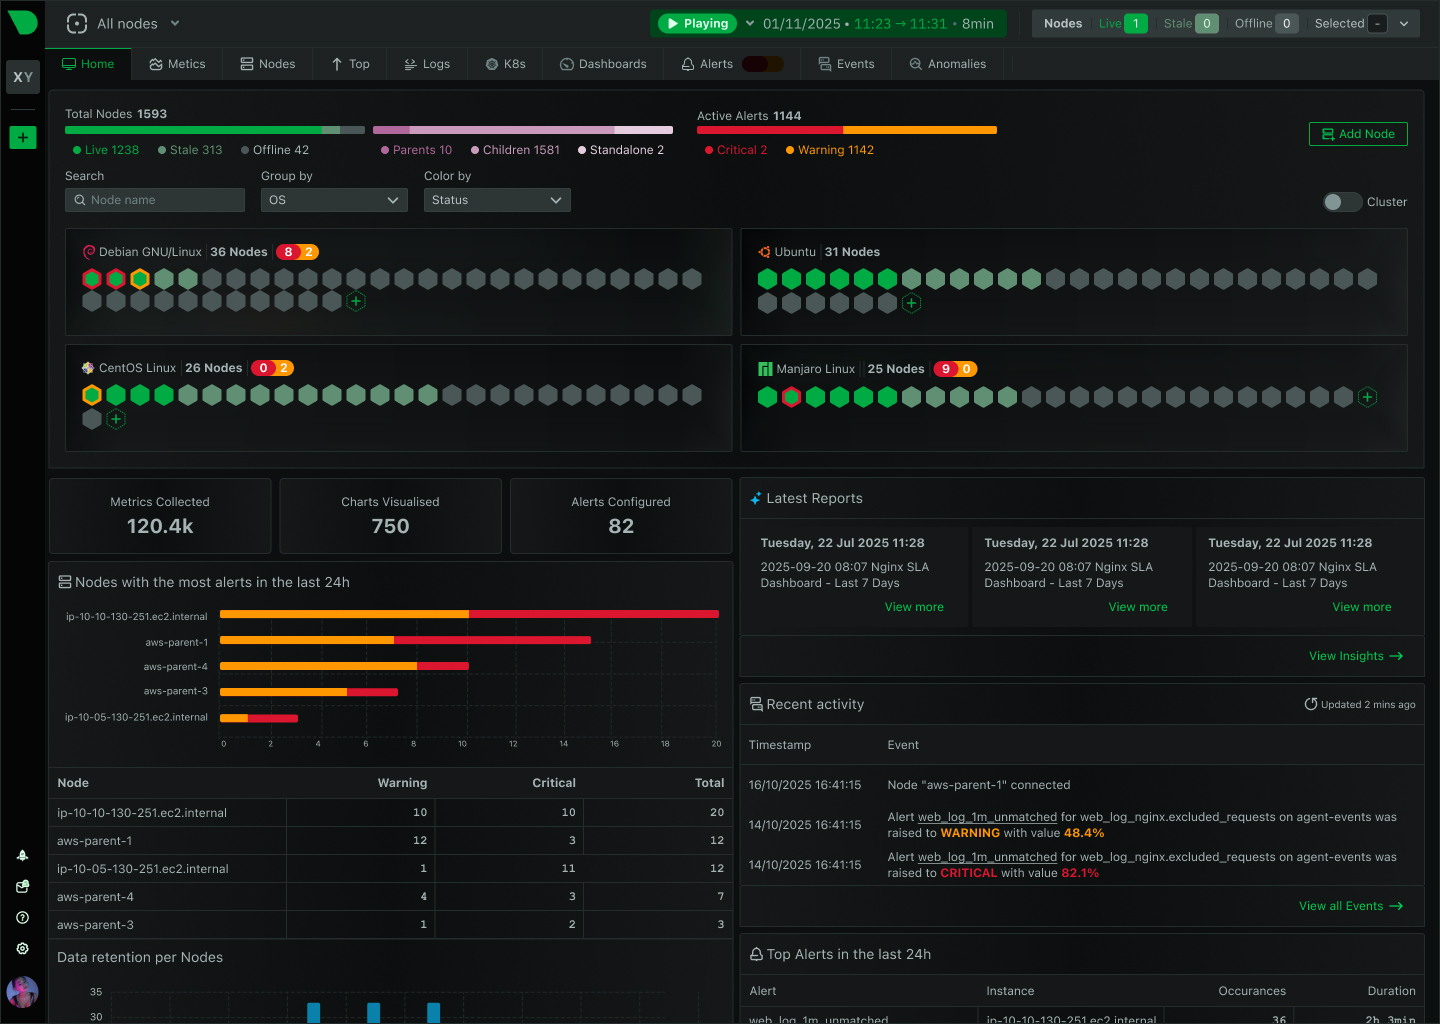
How to monitor Windows systems with Netdata

Comprehensive Monitoring Solutions for Windows Environments

Note: Please check out the latest blog on the improvements to Windows monitoring and the Windows demo room.

Whether you’re a site reliability engineer (SRE), DevOps engineer, or any other role that plays a part in maintaining uptime for your company’s infrastructure, it’s critical to have visibility into all of your systems, regardless of their operating system. This includes monitoring Windows systems, which is a popular use case for Netdata’s community.

Here’s the caveat: Netdata has no native Windows monitoring agent. We decided to focus our engineering efforts on creating the best single-node and infrastructure monitoring tool for the vast majority of production systems. If we split our resources between UNIX and Windows, the result would be two worse products competing for our valuable engineers’ time.

And despite the lack of native support, we’ve developed a few unique and fully-capable ways to help you get visibility into system- and application-level metrics from your Windows machines.

To monitor Windows systems with Netdata, you must install the open-source Netdata Agent on a compatible system, which you will use to remotely collect the exposed metrics from your Windows hosts and the applications they run. You have a few options:

  • A separate node running Linux or a different supported operating system.
  • A VM running a supported operating system on your Windows host.
Once you have this separate system running the Netdata Agent, you have three options for collecting metrics from Windows systems and applications, based on your needs:
  • Collect system metrics (CPU, memory, and so on), using the WMI collector and the windows_exporter program.
  • Collect application metrics
    • Collect application metrics from any supported application running on Windows, such as a MySQL database or Java Springboot 2 application, using the associated collector.
    • Collect application metrics from any supported Prometheus endpoint using our generic Prometheus collector.
Most users are just looking to monitor CPU and memory utilization for Windows systems. If this sounds like you, the WMI collector and windows_exporter will have you more than covered. Monitoring applications takes a bit more work, but both our supported collectors and Prometheus support bring native-like monitoring to your Windows systems.

Monitor Windows health and performance using windows_exporter

To monitor your Windows machines with Netdata, you can leverage windows_exporter, a well-known exporter supported by the Prometheus community, and Netdata’s WMI collector. This method will provide you with meaningful charts on your systems’ health metrics, including CPU, memory, disk utilization, network traffic, and more, which you can use to troubleshoot anomalies or downtime on your Windows systems.

The WMI collector collects only a subset of the metrics that windows_exporter offers, as shown in the WMI documentation.

To get started, download and install windows_exporter on your Windows system(s). Once you run it, it starts exposing metrics on port 9182. Now hop back over to the node running the Netdata Agent and configure the WMI collector.

If you’re new to configuring the Netdata Agent, see our node configuration doc.


The WMI collector can collect data from any number of Windows systems running windows_exporter. In the WMI configuration file, define a separate job for each system, with a unique name and the appropriate URL.

> Keep in mind that windows_exporter exposes metrics in plain HTTP. If this is a concern for you, you may want to secure the exposed metrics using a VPN or allowing only connections from the local network. See the windows_exporter project for details.

The configuration below collects metrics on CPU, memory, disk, networking, and more, from two unique Windows systems.

Once you have configured the WMI collector, and you have started both windows_exporter and the Netdata Agent, you should be able to monitor and troubleshoot the core components of your Windows machine(s).

Monitor Windows applications using Netdata’s collectors

Netdata is entirely capable of collecting and visualizing metrics from applications running on your Windows systems, in the same manner that it was able to collect data from the windows_exporter. As we outline in our documentation, various Windows applications expose their metrics via HTTP endpoints, which can be reached by Netdata collectors even if Netdata is installed in a different system.

You will need to configure these collectors, just as you might have configured WMI in the section above. For example, let’s say you have a MySQL database with a root password of my-secret-pw running on a Windows system with the IP address 203.0.113.0. First, open up the MySQL collector’s configuration file. If you’re not sure how to do that, follow the below steps, or check out our doc on enabling or configuring a collector.

Configure the MySQL collector by creating a job that looks for a MySQL database at 203.0.113.0:3306, with your completely secure and totally un-guessable password.

You can apply this exact logic to any of our supported collectors and applications running on your Windows systems. By configuring jobs, you can effectively monitor your Windows-based infrastructure using Netdata, despite our lack of native Windows support.

Use real-time visualizations to troubleshoot anomalies, or claim the node(s) you use to monitor Windows to your Space in Netdata Cloud for Windows infrastructure monitoring. And if you don’t see the Windows application you’re interested, perhaps our generic Prometheus collector can be of service.

Monitor applications with Prometheus endpoints

Our previous monitoring method is a great way to get visibility into your Windows applications’ health and performance, but only works for Netdata’s officially supported collectors. What about all the other Windows applications?

We recently introduced a new method to collect metrics in order to support even a wider array of applications, by leveraging the already existing Prometheus endpoints and scraping them with our very own Prometheus collector.

Using the Prometheus exposition format, a simple, text-based standard for exposing metrics, you get meaningful visualizations all in real-time. The generic Prometheus collector auto-detects metrics from over 600 Prometheus endpoints to instantly generate new charts with the same high-granularity, per-second frequency as other collectors. Once configured, Netdata will produce one or more charts for every metric collected via a Prometheus endpoint. The number of charts is based on the number of exposed metrics.

Let’s say you want to monitor Microsoft SQL Server with Netdata. You can use sql_exporter to expose its metrics, then configure the Netdata Agent node to capture its metrics using the Prometheus collector. Get started by opening the prometheus.conf file.

Then, edit the sql_exporter_local job to point to the URL where sql_exporter exposes your SQL server’s metrics.

Once you restart the Netdata Agent, you can view real-time metrics from your Windows application.

While this functionality allows you to collect metrics and view visualizations for Windows systems and/or applications, you may need to configure filtering and grouping. These configuration features help you add the same layer of meaningful presentation to Prometheus metrics that you would find with one of Netdata’s native collectors. For full instructions, visit our documentation and our latest Agent release.

Feedback on Windows-based infrastructure monitoring

We’re confident these Windows monitoring strategies will work for a vast majority of users and their infrastructure, and we’re committed to building monitoring solutions that are flexible and dynamic enough to seamlessly integrate anywhere.

As we continue to develop an interoperable and extensible monitoring agent, we’d like to hear your feedback on Windows support. Are you using Netdata to monitor Windows? Do one of the above solutions work for you? Jump into our community forum and let us know what you think. We’ll use your use case and results to shape our future support and development for Windows systems and applications.

Happy (Windows) monitoring!

Discover More