The only agent that thinks for itself

Autonomous Monitoring with self-learning AI built-in, operating independently across your entire stack.

Unlimited Metrics & Logs
Machine learning & MCP
5% CPU, 150MB RAM
3GB disk, >1 year retention
800+ integrations, zero config
Dashboards, alerts out of the box
> Discover Netdata Agents

Centralized metrics streaming and storage

Aggregate metrics from multiple agents into centralized Parent nodes for unified monitoring across your infrastructure.

Stream from unlimited agents
Long-term data retention
High availability clustering
Data replication & backup
Scalable architecture
Enterprise-grade security
> Learn about Parents

Fully managed cloud platform

Access your monitoring data from anywhere with our SaaS platform. No infrastructure to manage, automatic updates, and global availability.

Zero infrastructure management
99.9% uptime SLA
Global data centers
Automatic updates & patches
Enterprise SSO & RBAC
SOC2 & ISO certified
> Explore Netdata Cloud

Deploy Netdata Cloud in your infrastructure

Run the full Netdata Cloud platform on-premises for complete data sovereignty and compliance with your security policies.

Complete data sovereignty
Air-gapped deployment
Custom compliance controls
Private network integration
Dedicated support team
Kubernetes & Docker support
> Learn about Cloud On-Premises

Powerful, intuitive monitoring interface

Modern, responsive UI built for real-time troubleshooting with customizable dashboards and advanced visualization capabilities.

Real-time chart updates
Customizable dashboards
Dark & light themes
Advanced filtering & search
Responsive on all devices
Collaboration features
> Explore Netdata UI

Monitor on the go

Native iOS and Android apps bring full monitoring capabilities to your mobile device with real-time alerts and notifications.

iOS & Android apps
Push notifications
Touch-optimized interface
Offline data access
Biometric authentication
Widget support
> Download apps

Best energy efficiency

True real-time per-second

100% automated zero config

Centralized observability

Multi-year retention

High availability built-in

Zero maintenance

Always up-to-date

Enterprise security

Complete data control

Air-gap ready

Compliance certified

Millisecond responsiveness

Infinite zoom & pan

Works on any device

Native performance

Instant alerts

Monitor anywhere

80% Faster Incident Resolution

AI-powered troubleshooting from detection, to root cause and blast radius identification, to reporting.

True Real-Time and Simple, even at Scale

Linearly and infinitely scalable full-stack observability, that can be deployed even mid-crisis.

90% Cost Reduction, Full Fidelity

Instead of centralizing the data, Netdata distributes the code, eliminating pipelines and complexity.

Control Without Surrender

SOC 2 Type 2 certified with every metric kept on your infrastructure.

Integrations

800+ collectors and notification channels, auto-discovered and ready out of the box.

800+ data collectors
Auto-discovery & zero config
Cloud, infra, app protocols
Notifications out of the box
> Explore integrations
Real Results
46% Cost Reduction

Reduced monitoring costs by 46% while cutting staff overhead by 67%.

— Leonardo Antunez, Codyas

Zero Pipeline

No data shipping. No central storage costs. Query at the edge.

From Our Users
"Out-of-the-Box"

So many out-of-the-box features! I mostly don't have to develop anything.

— Simon Beginn, LANCOM Systems

No Query Language

Point-and-click troubleshooting. No PromQL, no LogQL, no learning curve.

Enterprise Ready
67% Less Staff, 46% Cost Cut

Enterprise efficiency without enterprise complexity—real ROI from day one.

— Leonardo Antunez, Codyas

SOC 2 Type 2 Certified

Zero data egress. Only metadata reaches the cloud. Your metrics stay on your infrastructure.

Full Coverage
800+ Collectors

Auto-discovered and configured. No manual setup required.

Any Notification Channel

Slack, PagerDuty, Teams, email, webhooks—all built-in.

Built for the People Who Get Paged

Because 3am alerts deserve instant answers, not hour-long hunts.

Every Industry Has Rules. We Master Them.

See how healthcare, finance, and government teams cut monitoring costs 90% while staying audit-ready.

Monitor Any Technology. Configure Nothing.

Install the agent. It already knows your stack.
From Our Users
"A Rare Unicorn"

Netdata gives more than you invest in it. A rare unicorn that obeys the Pareto rule.

— Eduard Porquet Mateu, TMB Barcelona

99% Downtime Reduction

Reduced website downtime by 99% and cloud bill by 30% using Netdata alerts.

— Falkland Islands Government

Real Savings
30% Cloud Cost Reduction

Optimized resource allocation based on Netdata alerts cut cloud spending by 30%.

— Falkland Islands Government

46% Cost Cut

Reduced monitoring staff by 67% while cutting operational costs by 46%.

— Codyas

Real Coverage
"Plugin for Everything"

Netdata has agent capacity or a plugin for everything, including Windows and Kubernetes.

— Eduard Porquet Mateu, TMB Barcelona

"Out-of-the-Box"

So many out-of-the-box features! I mostly don't have to develop anything.

— Simon Beginn, LANCOM Systems

Real Speed
Troubleshooting in 30 Seconds

From 2-3 minutes to 30 seconds—instant visibility into any node issue.

— Matthew Artist, Nodecraft

20% Downtime Reduction

20% less downtime and 40% budget optimization from out-of-the-box monitoring.

— Simon Beginn, LANCOM Systems

Pay per Node. Unlimited Everything Else.

One price per node. Unlimited metrics, logs, users, and retention. No per-GB surprises.

Free tier—forever
No metric limits or caps
Retention you control
Cancel anytime
> See pricing plans

What's Your Monitoring Really Costing You?

Most teams overpay by 40-60%. Let's find out why.

Expose hidden metric charges
Calculate tool consolidation
Customers report 30-67% savings
Results in under 60 seconds
> See what you're really paying

Your Infrastructure Is Unique. Let's Talk.

Because monitoring 10 nodes is different from monitoring 10,000.

On-prem & air-gapped deployment
Volume pricing & agreements
Architecture review for your scale
Compliance & security support
> Start a conversation

Monitoring That Sells Itself

Deploy in minutes. Impress clients in hours. Earn recurring revenue for years.

30-second live demos close deals
Zero config = zero support burden
Competitive margins & deal protection
Response in 48 hours
> Apply to partner

Per-Second Metrics at Homelab Prices

Same engine, same dashboards, same ML. Just priced for tinkerers.

Community: Free forever · 5 nodes · non-commercial
Homelab: $90/yr · unlimited nodes · fair usage
> Start monitoring your lab—free

$1,000 Per Referral. Unlimited Referrals.

Your colleagues get 10% off. You get 10% commission. Everyone wins.

10% of subscriptions, up to $1,000 each
Track earnings inside Netdata Cloud
PayPal/Venmo payouts in 3-4 weeks
No caps, no complexity
> Get your referral link
Cost Proof
40% Budget Optimization

"Netdata's significant positive impact" — LANCOM Systems

Calculate Your Savings

Compare vs Datadog, Grafana, Dynatrace

Savings Proof
46% Cost Reduction

"Cut costs by 46%, staff by 67%" — Codyas

30% Cloud Bill Savings

"Reduced cloud bill by 30%" — Falkland Islands Gov

Enterprise Proof
"Better Than Combined Alternatives"

"Better observability with Netdata than combining other tools." — TMB Barcelona

Real Engineers, <24h Response

DPA, SLAs, on-prem, volume pricing

Why Partners Win
Demo Live Infrastructure

One command, 30 seconds, real data—no sandbox needed

Zero Tickets, High Margins

Auto-config + per-node pricing = predictable profit

Homelab Ready
"Absolutely Incredible"

"We tested every monitoring system under the sun." — Benjamin Gabler, CEO Rocket.Net

76k+ GitHub Stars

3rd most starred monitoring project

Worth Recommending
Product That Delivers

Customers report 40-67% cost cuts, 99% downtime reduction

Zero Risk to Your Rep

Free tier lets them try before they buy

Never Fight Fires Alone

Docs, community, and expert help—pick your path to resolution.

Learn.netdata.cloud docs
Discord, Forums, GitHub
Premium support available
> Get answers now

60 Seconds to First Dashboard

One command to install. Zero config. 850+ integrations documented.

Linux, Windows, K8s, Docker
Auto-discovers your stack
> Read our documentation

See Netdata in Action

Watch real-time monitoring in action—demos, tutorials, and engineering deep dives.

Product demos and walkthroughs
Real infrastructure, not staged
> Start with the 3-minute tour

Level Up Your Monitoring

Real problems. Real solutions. 112+ guides from basic monitoring to AI observability.

76,000+ Engineers Strong

615+ contributors. 1.5M daily downloads. One mission: simplify observability.

Per-Second. 90% Cheaper. Data Stays Home.

Side-by-side comparisons: costs, real-time granularity, and data sovereignty for every major tool.

See why teams switch from Datadog, Prometheus, Grafana, and more.

> Browse all comparisons
Edge-Native Observability, Born Open Source
Per-second visibility, ML on every metric, and data that never leaves your infrastructure.
Founded in 2016
615+ contributors worldwide
Remote-first, engineering-driven
Open source first
> Read our story
Promises We Publish—and Prove
12 principles backed by open code, independent validation, and measurable outcomes.
Open source, peer-reviewed
Zero config, instant value
Data sovereignty by design
Aligned pricing, no surprises
> See all 12 principles
Edge-Native, AI-Ready, 100% Open
76k+ stars. Full ML, AI, and automation—GPLv3+, not premium add-ons.
76,000+ GitHub stars
GPLv3+ licensed forever
ML on every metric, included
Zero vendor lock-in
> Explore our open source
Build Real-Time Observability for the World
Remote-first team shipping per-second monitoring with ML on every metric.
Remote-first, fully distributed
Open source (76k+ stars)
Challenging technical problems
Your code on millions of systems
> See open roles
Talk to a Netdata Human in <24 Hours
Sales, partnerships, press, or professional services—real engineers, fast answers.
Discuss your observability needs
Pricing and volume discounts
Partnership opportunities
Media and press inquiries
> Book a conversation
Your Data. Your Rules.
On-prem data, cloud control plane, transparent terms.
Trust & Scale
76,000+ GitHub Stars

One of the most popular open-source monitoring projects

SOC 2 Type 2 Certified

Enterprise-grade security and compliance

Data Sovereignty

Your metrics stay on your infrastructure

Validated
University of Amsterdam

"Most energy-efficient monitoring solution" — ICSOC 2023, peer-reviewed

ADASTEC (Autonomous Driving)

"Doesn't miss alerts—mission-critical trust for safety software"

Community Stats
615+ Contributors

Global community improving monitoring for everyone

1.5M+ Downloads/Day

Trusted by teams worldwide

GPLv3+ Licensed

Free forever, fully open source agent

Why Join?
Remote-First

Work from anywhere, async-friendly culture

Impact at Scale

Your work helps millions of systems

Compliance
SOC 2 Type 2

Audited security controls

GDPR Ready

Data stays on your infrastructure

Blog

Introducing Netdata's Dynamic Configuration Manager

Simplifying Collector and Alert Configurations!
by Satyadeep Ashwathnarayana · June 5, 2024

We are thrilled to unveil the latest addition to the Netdata platform: the Dynamic Configuration Manager. This powerful new feature revolutionizes how you manage your monitoring and alerting configurations, making it easier and more efficient than ever before.

Key Features of the Dynamic Configuration Manager

  1. Create and Modify Alerts from Every Chart
    • You can now create and modify alerts directly from any chart on your dashboard or from the dedicated Alerts tab. This streamlined process allows for quick adjustments and ensures your monitoring is always aligned with your current needs.
  2. Configure Collectors from the Integrations Section on the Dashboard
    • Currently available for go.d collectors, this feature lets you configure collectors straight from the Integrations section. This means you can quickly identify what Netdata can monitor and set up your configurations in one go, without having to dig through multiple settings pages.
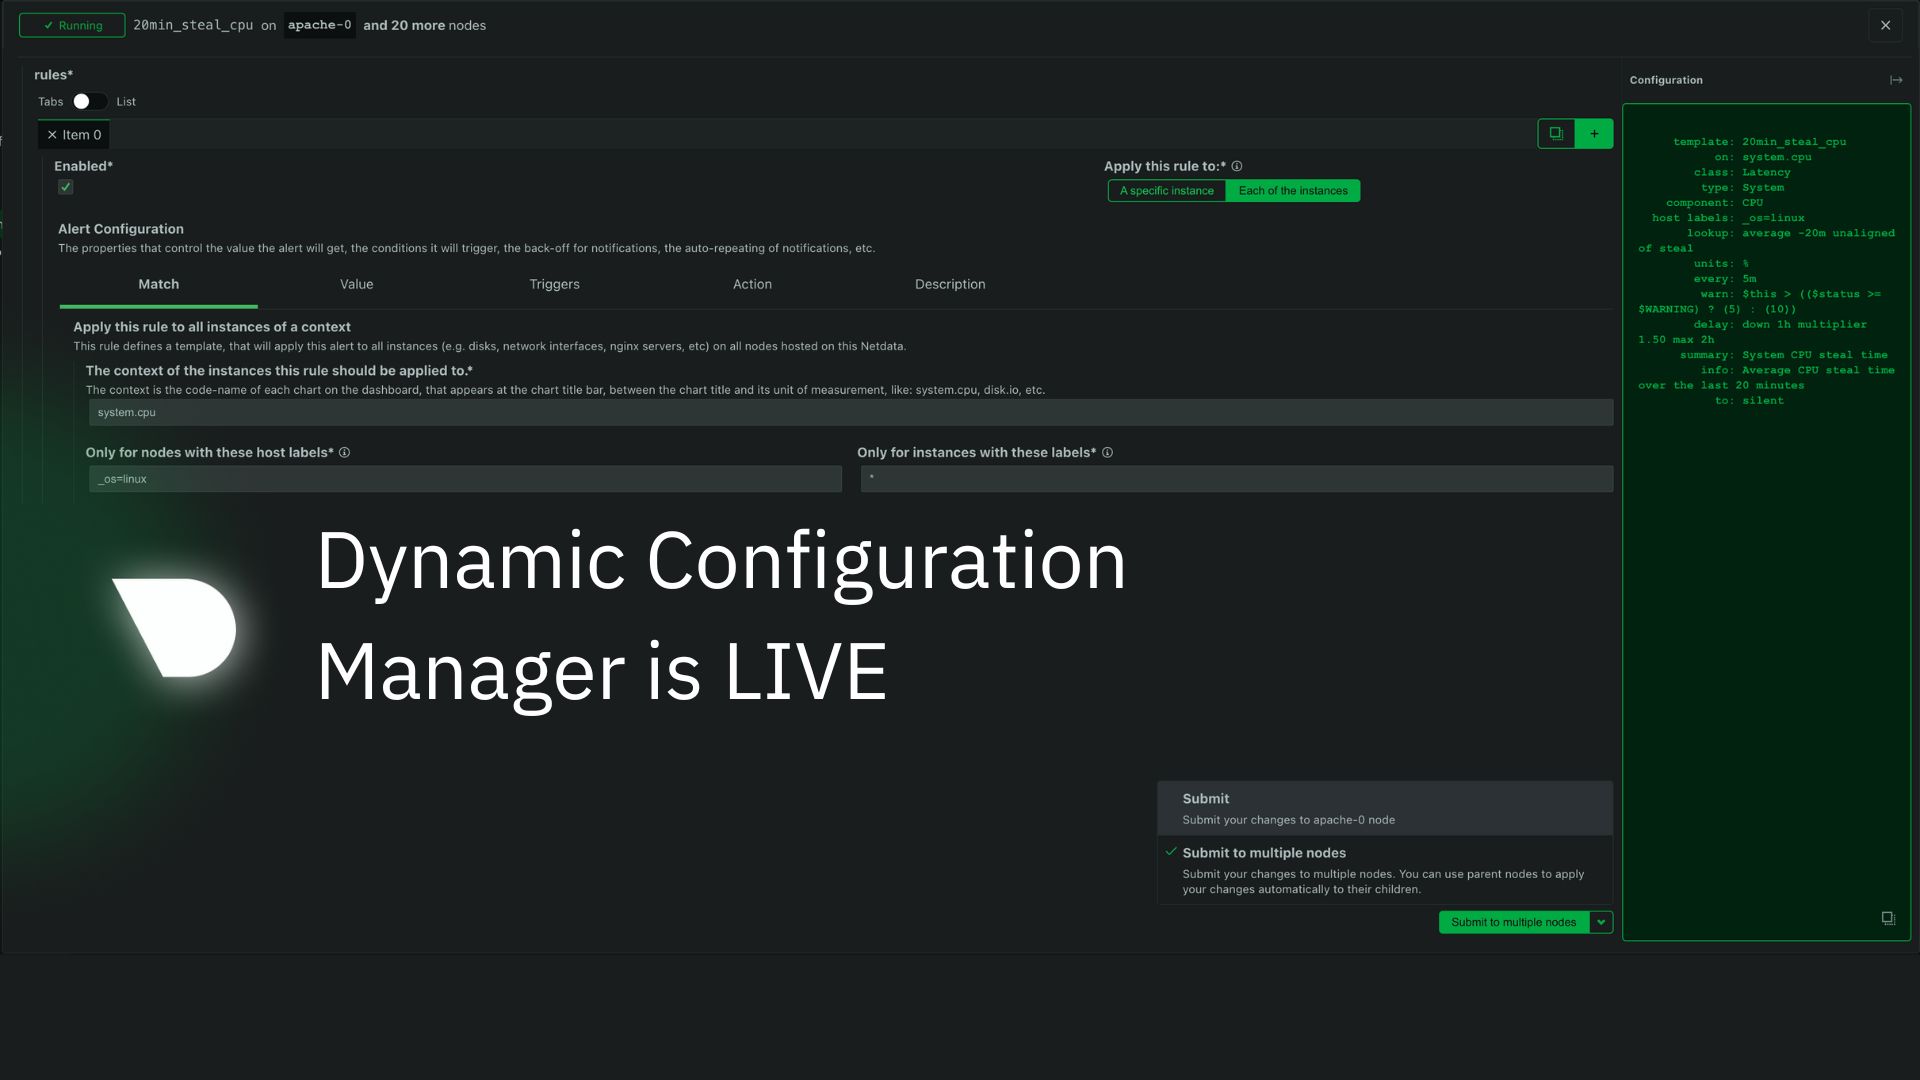
  3. Submit Configurations to Multiple Nodes with One Click
    • Managing configurations across a large infrastructure can be time-consuming. With the Dynamic Configuration Manager, you can now submit configurations to multiple nodes simultaneously, saving you valuable time and effort.
  4. Construct and Copy Configurations for IaC Solutions
    • For those using Infrastructure as Code (IaC) solutions, this feature allows you to construct and copy configurations easily, integrating them into your IaC workflows. This ensures your configurations are consistent and reproducible across different environments.

How to Use the Dynamic Configuration Manager

To help you get started with the Dynamic Configuration Manager, we’ve put together a quick guide using the Netdata demo environment.

1. Edit and Create New Alerts from Every Chart

In the Netdata demo, navigate to any chart. You’ll notice a new option to create or edit alerts directly from the chart itself. Here’s how:

  • Step 1: Navigate to the chart (context) that you would like to create an alert on.
  • Step 2: Click on the Alert icon (bell icon) on top of the chart to edit an existing alert or create a new one.
  • Step 3: Configure your alert parameters, such as rules, instances, thresholds etc, and submit your changes.

Create Alerts from a Chart

2. Edit Alerts from the Alerts Tab

To modify existing alerts:

  • Step 1: Go to the Alerts tab on your Netdata dashboard.
  • Step 2: Locate the alert you wish to modify and click on it.
  • Step 3: Adjust the thresholds and other parameters to match your specific needs and save the changes.

Edit Alerts from Alerts tab

3. Configure Collectors from the Integrations Marketplace

Configuring collectors is now a breeze:

  • Step 1: Navigate to the Integrations section on the dashboard.
  • Step 2: Browse through the available collectors.
  • Step 3: Click on the Configure button. Once configured, they will start collecting data as specified.

Configure Collectors

4. Submit Configurations to Multiple Nodes at Once

To push configurations to multiple nodes:

  • Step 1: Configure your collectors or alerts.
  • Step 2: Use the new feature to submit to multiple target nodes.
  • Step 3: Submit your configuration, and it will be applied to all selected nodes instantly.

Multi node configs

5. Access the Configuration Manager from Space Settings

To push configurations to multiple nodes:

  • Step 1: Go to Space Settings on your Dashboard.
  • Step 2: Navigate to the Configurations section.
  • Step 3: Explore, create and edit collector, health and logs configurations.

Configuration Manager

Try It Out Now!

Experience the efficiency and power of the Dynamic Configuration Manager in Netdata today. Whether you’re managing a handful of nodes or a vast infrastructure, this feature will make your monitoring and alerting tasks smoother and more intuitive. Visit the Netdata demo to explore these capabilities firsthand and see how they can enhance your monitoring workflows.

Stay tuned for more updates and enhancements as we continue to innovate and improve the Netdata platform. Happy monitoring!