The only agent that thinks for itself

Autonomous Monitoring with self-learning AI built-in, operating independently across your entire stack.

Unlimited Metrics & Logs
Machine learning & MCP
5% CPU, 150MB RAM
3GB disk, >1 year retention
800+ integrations, zero config
Dashboards, alerts out of the box
> Discover Netdata Agents
Centralized metrics streaming and storage

Aggregate metrics from multiple agents into centralized Parent nodes for unified monitoring across your infrastructure.

Stream from unlimited agents
Long-term data retention
High availability clustering
Data replication & backup
Scalable architecture
Enterprise-grade security
> Learn about Parents
Fully managed cloud platform

Access your monitoring data from anywhere with our SaaS platform. No infrastructure to manage, automatic updates, and global availability.

Zero infrastructure management
99.9% uptime SLA
Global data centers
Automatic updates & patches
Enterprise SSO & RBAC
SOC2 & ISO certified
> Explore Netdata Cloud
Deploy Netdata Cloud in your infrastructure

Run the full Netdata Cloud platform on-premises for complete data sovereignty and compliance with your security policies.

Complete data sovereignty
Air-gapped deployment
Custom compliance controls
Private network integration
Dedicated support team
Kubernetes & Docker support
> Learn about Cloud On-Premises
Powerful, intuitive monitoring interface

Modern, responsive UI built for real-time troubleshooting with customizable dashboards and advanced visualization capabilities.

Real-time chart updates
Customizable dashboards
Dark & light themes
Advanced filtering & search
Responsive on all devices
Collaboration features
> Explore Netdata UI
Monitor on the go

Native iOS and Android apps bring full monitoring capabilities to your mobile device with real-time alerts and notifications.

iOS & Android apps
Push notifications
Touch-optimized interface
Offline data access
Biometric authentication
Widget support
> Download apps

Best energy efficiency

True real-time per-second

100% automated zero config

Centralized observability

Multi-year retention

High availability built-in

Zero maintenance

Always up-to-date

Enterprise security

Complete data control

Air-gap ready

Compliance certified

Millisecond responsiveness

Infinite zoom & pan

Works on any device

Native performance

Instant alerts

Monitor anywhere

80% Faster Incident Resolution
AI-powered troubleshooting from detection, to root cause and blast radius identification, to reporting.
True Real-Time and Simple, even at Scale
Linearly and infinitely scalable full-stack observability, that can be deployed even mid-crisis.
90% Cost Reduction, Full Fidelity
Instead of centralizing the data, Netdata distributes the code, eliminating pipelines and complexity.
Control Without Surrender
SOC 2 Type 2 certified with every metric kept on your infrastructure.
Integrations

800+ collectors and notification channels, auto-discovered and ready out of the box.

800+ data collectors
Auto-discovery & zero config
Cloud, infra, app protocols
Notifications out of the box
> Explore integrations
Real Results
46% Cost Reduction

Reduced monitoring costs by 46% while cutting staff overhead by 67%.

— Leonardo Antunez, Codyas

Zero Pipeline

No data shipping. No central storage costs. Query at the edge.

From Our Users
"Out-of-the-Box"

So many out-of-the-box features! I mostly don't have to develop anything.

— Simon Beginn, LANCOM Systems

No Query Language

Point-and-click troubleshooting. No PromQL, no LogQL, no learning curve.

Enterprise Ready
67% Less Staff, 46% Cost Cut

Enterprise efficiency without enterprise complexity—real ROI from day one.

— Leonardo Antunez, Codyas

SOC 2 Type 2 Certified

Zero data egress. Only metadata reaches the cloud. Your metrics stay on your infrastructure.

Full Coverage
800+ Collectors

Auto-discovered and configured. No manual setup required.

Any Notification Channel

Slack, PagerDuty, Teams, email, webhooks—all built-in.

Built for the People Who Get Paged
Because 3am alerts deserve instant answers, not hour-long hunts.
Every Industry Has Rules. We Master Them.
See how healthcare, finance, and government teams cut monitoring costs 90% while staying audit-ready.
Monitor Any Technology. Configure Nothing.
Install the agent. It already knows your stack.
From Our Users
"A Rare Unicorn"

Netdata gives more than you invest in it. A rare unicorn that obeys the Pareto rule.

— Eduard Porquet Mateu, TMB Barcelona

99% Downtime Reduction

Reduced website downtime by 99% and cloud bill by 30% using Netdata alerts.

— Falkland Islands Government

Real Savings
30% Cloud Cost Reduction

Optimized resource allocation based on Netdata alerts cut cloud spending by 30%.

— Falkland Islands Government

46% Cost Cut

Reduced monitoring staff by 67% while cutting operational costs by 46%.

— Codyas

Real Coverage
"Plugin for Everything"

Netdata has agent capacity or a plugin for everything, including Windows and Kubernetes.

— Eduard Porquet Mateu, TMB Barcelona

"Out-of-the-Box"

So many out-of-the-box features! I mostly don't have to develop anything.

— Simon Beginn, LANCOM Systems

Real Speed
Troubleshooting in 30 Seconds

From 2-3 minutes to 30 seconds—instant visibility into any node issue.

— Matthew Artist, Nodecraft

20% Downtime Reduction

20% less downtime and 40% budget optimization from out-of-the-box monitoring.

— Simon Beginn, LANCOM Systems

Pay per Node. Unlimited Everything Else.

One price per node. Unlimited metrics, logs, users, and retention. No per-GB surprises.

Free tier—forever
No metric limits or caps
Retention you control
Cancel anytime
> See pricing plans
What's Your Monitoring Really Costing You?

Most teams overpay by 40-60%. Let's find out why.

Expose hidden metric charges
Calculate tool consolidation
Customers report 30-67% savings
Results in under 60 seconds
> See what you're really paying
Your Infrastructure Is Unique. Let's Talk.

Because monitoring 10 nodes is different from monitoring 10,000.

On-prem & air-gapped deployment
Volume pricing & agreements
Architecture review for your scale
Compliance & security support
> Start a conversation
Monitoring That Sells Itself

Deploy in minutes. Impress clients in hours. Earn recurring revenue for years.

30-second live demos close deals
Zero config = zero support burden
Competitive margins & deal protection
Response in 48 hours
> Apply to partner
Per-Second Metrics at Homelab Prices

Same engine, same dashboards, same ML. Just priced for tinkerers.

Community: Free forever · 5 nodes · non-commercial
Homelab: $90/yr · unlimited nodes · fair usage
> Start monitoring your lab—free
$1,000 Per Referral. Unlimited Referrals.

Your colleagues get 10% off. You get 10% commission. Everyone wins.

10% of subscriptions, up to $1,000 each
Track earnings inside Netdata Cloud
PayPal/Venmo payouts in 3-4 weeks
No caps, no complexity
> Get your referral link
Cost Proof
40% Budget Optimization

"Netdata's significant positive impact" — LANCOM Systems

Calculate Your Savings

Compare vs Datadog, Grafana, Dynatrace

Savings Proof
46% Cost Reduction

"Cut costs by 46%, staff by 67%" — Codyas

30% Cloud Bill Savings

"Reduced cloud bill by 30%" — Falkland Islands Gov

Enterprise Proof
"Better Than Combined Alternatives"

"Better observability with Netdata than combining other tools." — TMB Barcelona

Real Engineers, <24h Response

DPA, SLAs, on-prem, volume pricing

Why Partners Win
Demo Live Infrastructure

One command, 30 seconds, real data—no sandbox needed

Zero Tickets, High Margins

Auto-config + per-node pricing = predictable profit

Homelab Ready
"Absolutely Incredible"

"We tested every monitoring system under the sun." — Benjamin Gabler, CEO Rocket.Net

76k+ GitHub Stars

3rd most starred monitoring project

Worth Recommending
Product That Delivers

Customers report 40-67% cost cuts, 99% downtime reduction

Zero Risk to Your Rep

Free tier lets them try before they buy

Never Fight Fires Alone

Docs, community, and expert help—pick your path to resolution.

Learn.netdata.cloud docs
Discord, Forums, GitHub
Premium support available
> Get answers now
60 Seconds to First Dashboard

One command to install. Zero config. 850+ integrations documented.

Linux, Windows, K8s, Docker
Auto-discovers your stack
> Read our documentation
See Netdata in Action

Watch real-time monitoring in action—demos, tutorials, and engineering deep dives.

Product demos and walkthroughs
Real infrastructure, not staged
> Start with the 3-minute tour
Level Up Your Monitoring
Real problems. Real solutions. 112+ guides from basic monitoring to AI observability.
76,000+ Engineers Strong
615+ contributors. 1.5M daily downloads. One mission: simplify observability.
Per-Second. 90% Cheaper. Data Stays Home.
Side-by-side comparisons: costs, real-time granularity, and data sovereignty for every major tool.

See why teams switch from Datadog, Prometheus, Grafana, and more.

> Browse all comparisons
Edge-Native Observability, Born Open Source
Per-second visibility, ML on every metric, and data that never leaves your infrastructure.
Founded in 2016
615+ contributors worldwide
Remote-first, engineering-driven
Open source first
> Read our story
Promises We Publish—and Prove
12 principles backed by open code, independent validation, and measurable outcomes.
Open source, peer-reviewed
Zero config, instant value
Data sovereignty by design
Aligned pricing, no surprises
> See all 12 principles
Edge-Native, AI-Ready, 100% Open
76k+ stars. Full ML, AI, and automation—GPLv3+, not premium add-ons.
76,000+ GitHub stars
GPLv3+ licensed forever
ML on every metric, included
Zero vendor lock-in
> Explore our open source
Build Real-Time Observability for the World
Remote-first team shipping per-second monitoring with ML on every metric.
Remote-first, fully distributed
Open source (76k+ stars)
Challenging technical problems
Your code on millions of systems
> See open roles
Talk to a Netdata Human in <24 Hours
Sales, partnerships, press, or professional services—real engineers, fast answers.
Discuss your observability needs
Pricing and volume discounts
Partnership opportunities
Media and press inquiries
> Book a conversation
Your Data. Your Rules.
On-prem data, cloud control plane, transparent terms.
Trust & Scale
76,000+ GitHub Stars

One of the most popular open-source monitoring projects

SOC 2 Type 2 Certified

Enterprise-grade security and compliance

Data Sovereignty

Your metrics stay on your infrastructure

Validated
University of Amsterdam

"Most energy-efficient monitoring solution" — ICSOC 2023, peer-reviewed

ADASTEC (Autonomous Driving)

"Doesn't miss alerts—mission-critical trust for safety software"

Community Stats
615+ Contributors

Global community improving monitoring for everyone

1.5M+ Downloads/Day

Trusted by teams worldwide

GPLv3+ Licensed

Free forever, fully open source agent

Why Join?
Remote-First

Work from anywhere, async-friendly culture

Impact at Scale

Your work helps millions of systems

Compliance
SOC 2 Type 2

Audited security controls

GDPR Ready

Data stays on your infrastructure

Blog

Monitor & Troubleshoot ISP Performance With Netdata

Tracking Connectivity For Optimal Online Experience
by Shyam Sreevalsan · November 28, 2022

Find out how to monitor your Internet speed and quality and how well your ISP is performing.

logo

What Factors Affect My Internet Speed?

Several factors can influence your internet speed, ranging from your ISP’s infrastructure to your home setup. Here’s a breakdown:

1. ISP Plan & Bandwidth

The speed you experience depends on the plan you choose from your ISP. Higher-tier plans offer more bandwidth, which means faster speeds for downloading, streaming, and gaming.

2. Network Congestion

During peak hours (evenings or weekends), many users share the same network resources, leading to slower speeds. This is more common with cable internet, where bandwidth is shared in a neighborhood.

3. Router & Modem Quality

Outdated or low-quality routers and modems can bottleneck your internet speed. Ensure your equipment supports the speed offered by your ISP and current standards like Wi-Fi 6.

4. Device Performance

Older devices may not be able to handle high-speed connections. Ensure your computer, smartphone, or tablet is updated and supports the latest Wi-Fi standards.

5. Distance From Router

The farther you are from your router, the weaker the Wi-Fi signal. Walls, floors, and other obstacles can also interfere with signal strength.

6. Connection Type (Wired vs. Wireless)

Wired connections (e.g., Ethernet) typically offer faster and more stable speeds compared to wireless connections. Use a direct Ethernet connection for bandwidth-heavy activities like gaming or streaming.

7. Interference From Other Devices

Devices like microwaves, cordless phones, and other wireless networks can interfere with Wi-Fi signals. Choose the least congested channel for your router or switch to a 5 GHz band if supported.

8. Server Distance

When accessing websites or services hosted far away, data takes longer to travel, affecting speeds. This is measured as latency and can be more noticeable with international websites or gaming.

9. Background Applications

Apps or devices using bandwidth in the background (e.g., software updates, cloud backups) can slow down your connection. Monitor and prioritize bandwidth usage.

10. ISP Infrastructure

The technology your ISP uses (fiber, cable, DSL) greatly impacts speed and reliability. Fiber-optic connections offer the fastest and most consistent speeds, followed by cable and DSL.

Monitoring ISP Performance & Internet Speed

There’s nothing quite as frustrating as a slow internet connection. Whether you’re trying to stream a movie, download a large file, or just browse the web, a slow connection can make even the simplest tasks a pain. That’s why it’s important to keep an eye on your internet speed, and hold your ISP accountable if they’re not providing the level of service they promised.

There are a number of online speed tests you can take to see how your internet is performing. But if you’ve ever tried them out, you’d know that speed tests can give varying results each time you run them and during different times of the day - so what you really need is to monitor the internet speeds your ISP is delivering.

So one-off speed tests on your browser are just not going to cut it. We need a way to continually monitor internet speed and visualize these results over time.

The Key Tools For ISP Speed Monitoring

We’re going to use Ookla’s Speedtest CLI to run speed tests and collect key ISP performance. Ookla is pretty much the gold standard when it comes to speed tests and Speedtest CLI is a developer friendly linux native command line tool backed by Ookla.

And we will use Netdata to periodically collect the speed test metrics, visualize them as time series charts over time and do much more.

How To Install & Configure Speedtest Monitoring

1. Install Netdata

Sign up for a free Netdata account, and copy the command you see when you click on the “Connect Nodes” button.

Paste this command on your terminal to install Netdata.

2. Install Speedtest CLI

If you are using another variant of Linux or FreeBSD or macOS use the appropriate installation commands mentioned in the Speedtest CLI website.

sudo apt-get install curl
curl -s https://packagecloud.io/install/repositories/ookla/speedtest-cli/script.deb.sh | sudo bash
sudo apt-get install speedtest

3. Run Speedtest CLI

Run Speedtest CLI as the Netdata user and accept the license agreements.

sudo -u netdata speedtest

4. Run The Command

The Speedtest collector is a community maintained collector and not available as part of the Netdata agent by default. To install this collector just run this command:

sudo wget -O /tmp/install-collector.sh https://raw.githubusercontent.com/netdata/community/main/utilities/install-collector.sh && sudo bash /tmp/install-collector.sh charts.d.plugin/speedtest

After a few seconds, you see the new speedtest section in your Netdata Overview tab along with all of the Speedtest metrics being monitored by Netdata. As you will see, there’s a lot more than just your Download Speed and Upload Speed that we can monitor.

Key Speed Test Metrics For ISP Performance Monitoring

Speed

Speed displays the download speed and upload speed that the speedtest was able to achieve, measured in Mbps. This is the most obvious measure of ISP performance that all users are aware of - and the easiest to check against what the ISP promised you when you made a contract with them.

The results below show my Internet speeds are pretty steady with upload speeds of roughly 10% of the download speeds. This is still significantly lower than what my ISP claims, so maybe it’s time I had a chat with them.

image

image

Packet Loss

Packet Loss measures the percentage of packets dropped during the speed test,and should ideally be close to zero most of the time. Packet loss occurs when packets of data are lost in transit. This can happen for a number of reasons, including network congestion, faulty equipment, and bad weather. Packet loss can significantly impact a user’s quality of experience, especially for applications such as VoIP and video calls and video streaming.

In my case, I see that the packet loss is zero most of the time, except for a few sporadic spikes of 20%(!!)… I should probably take a closer look at what’s going on there.

image

Latency

Latency (sometimes called “ping”) measures how quickly your device gets a response after you’ve sent out a request. As internet speeds have steadily increased globally, latency issues have become easier to spot. Latency directly correlates with the quality of experience when it comes to latency sensitive applications like video calls, live streaming, and especially online gaming.

Three distinct latency metrics are collected to give a more fine grained understanding of potential bottlenecks in the network:

  • Idle Latency is measured at the beginning of a speed test while the network is (relatively) not in use.

image

  • Download Latency is measured while the download test is in progress to see how it is affected by download activity on your network, like a household member downloading a large game while you’re trying to work.

image

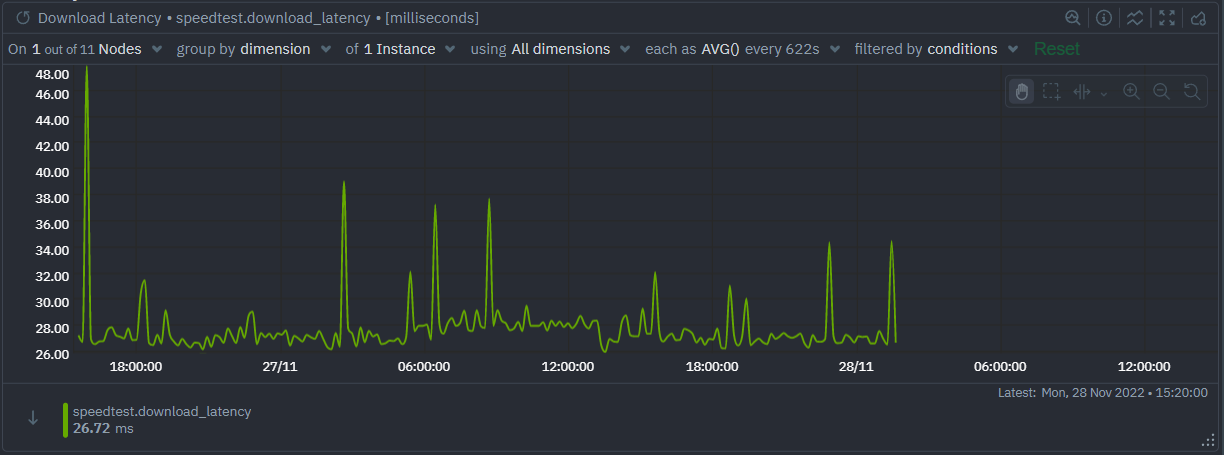
  • Upload Latency is measured while the upload test is in progress to see how it is affected by upload activity on your network, like someone on your home network uploading a year’s worth of photos.

image

How do I solve latency problems?

  • If your idle latency is high, you have an overall latency problem. Try running speedtest on another device, and, if you see the same problem try restarting your router. If the problem continues, consider moving your router someplace more central.
  • If your download or upload latency is high, check your router/network configurations and/or contact your internet service provider (ISP) to see if they can help.

Jitter

Network jitter is the variance in latency between data packets. Basically, if it’s pretty stable from packet to packet, you have minimal jitter. If there are random spikes that deviate from the usual numbers you’re getting, you’ve got some jitter. For many users jitter is not something that will be very noticeable, but there are certain scenarios such as interactive gaming where jitter could be very troublesome.

Similar to latency, three distinct jitter metrics are collected.

  • Idle Jitter is measured at the beginning of a speed test while the network is (relatively) not in use.

image

  • Download Jitter is measured while the download test is in progress to see how it is affected by download activity on your network.

image

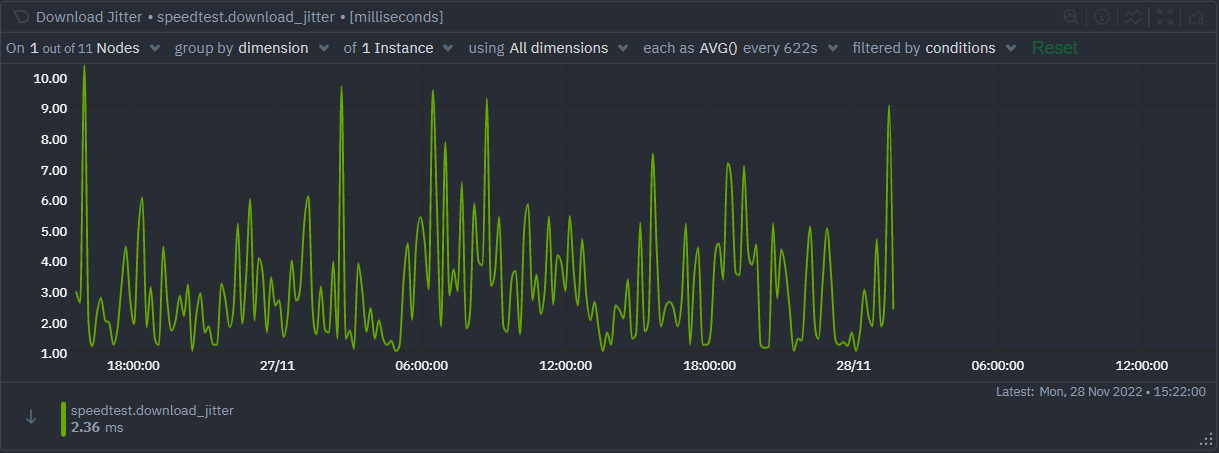
  • Upload Jitter is measured while the upload test is in progress to see how it is affected by upload activity on your network.

image

How do I minimize jitter?

  • First check if it is a momentary problem or a more longer term issue, Netdata’s jitter time series chart should help you do this. You may notice momentary issues due to, for example, heavy load, that may go away on its own.
  • Prefer using an Ethernet cable whenever possible
  • And if you must use Wi-Fi, prefer the less congested 5 GHz band and move closer to your router to minimize transmission distance, noise, and signal loss
  • Try restarting your wireless router to have it automatically reconnect to the least congested channel available
  • Check your router/network configurations and/or try contacting your ISP.

Bytes consumed

Bytes consumed is the measure of how many bytes of data have been downloaded and uploaded as part of the speed tests we’re running. It’s good to keep an eye on this because speed tests can be quote bandwidth hungry and if you’re not on an unlimited plan things might get ugly.

image

image

Simplifying Monitoring & Troubleshooting With Netdata

Netdata can do a lot more than monitor metrics and visualize it for you, it comes with powerful troubleshooting features such as:

Alerts

Netdata has built-in support for alerts to reduce the monitoring burden for you. To create your own alert for another metric – please follow the instructions here.

For example, you could set up trigger actions when an alert condition is met. A few years ago I was having some trouble with an ISP under delivering and wrote a script that auto tweeted complaints to my ISP’s twitter account every time my internet misbehaved due to network issues. I’m not suggesting you do that, but I’m not suggesting you don’t do it either :-)

Anomaly Advisor

Anomaly Advisor lets you quickly identify if the system you are monitoring has any anomalies and allows you to drill down into which metrics are behaving anomalously.

To learn more about how to use Anomaly Advisor to troubleshoot your Apache web server check out the documentation or visit the anomalies tab in the demo space to play with it right now.

Metric Correlations

Metric Correlations lets you quickly find metrics and charts related to a particular window of interest that you want to explore further. By displaying the standard Netdata dashboard, filtered to show only charts that are relevant to the window of interest, you can get to the root cause sooner.

Stay Connected: Share Feedback & Troubleshooting Insights

So don’t suffer in silence next time your internet is slow. Take a stand and demand the speeds you deserve!

If you haven’t already, sign up now for a free Netdata account!

We’d love to hear from you – if you have any questions, complaints or feedback please reach out to us on Discord or Github.

Happy Troubleshooting!