The only agent that thinks for itself

Autonomous Monitoring with self-learning AI built-in, operating independently across your entire stack.

Unlimited Metrics & Logs
Machine learning & MCP
5% CPU, 150MB RAM
3GB disk, >1 year retention
800+ integrations, zero config
Dashboards, alerts out of the box
> Discover Netdata Agents

Centralized metrics streaming and storage

Aggregate metrics from multiple agents into centralized Parent nodes for unified monitoring across your infrastructure.

Stream from unlimited agents
Long-term data retention
High availability clustering
Data replication & backup
Scalable architecture
Enterprise-grade security
> Learn about Parents

Fully managed cloud platform

Access your monitoring data from anywhere with our SaaS platform. No infrastructure to manage, automatic updates, and global availability.

Zero infrastructure management
99.9% uptime SLA
Global data centers
Automatic updates & patches
Enterprise SSO & RBAC
SOC2 & ISO certified
> Explore Netdata Cloud

Deploy Netdata Cloud in your infrastructure

Run the full Netdata Cloud platform on-premises for complete data sovereignty and compliance with your security policies.

Complete data sovereignty
Air-gapped deployment
Custom compliance controls
Private network integration
Dedicated support team
Kubernetes & Docker support
> Learn about Cloud On-Premises

Powerful, intuitive monitoring interface

Modern, responsive UI built for real-time troubleshooting with customizable dashboards and advanced visualization capabilities.

Real-time chart updates
Customizable dashboards
Dark & light themes
Advanced filtering & search
Responsive on all devices
Collaboration features
> Explore Netdata UI

Monitor on the go

Native iOS and Android apps bring full monitoring capabilities to your mobile device with real-time alerts and notifications.

iOS & Android apps
Push notifications
Touch-optimized interface
Offline data access
Biometric authentication
Widget support
> Download apps

The future of infrastructure observability

See our strategic direction across AI-native observability, full-stack signals, operational intelligence, and enterprise platform maturity.

AI-native observability
Full-stack signal coverage
Operational intelligence
Enterprise platform maturity
Agent releases every 6 weeks
Cloud continuous delivery
> Explore Product Roadmap

Best energy efficiency

True real-time per-second

100% automated zero config

Centralized observability

Multi-year retention

High availability built-in

Zero maintenance

Always up-to-date

Enterprise security

Complete data control

Air-gap ready

Compliance certified

Millisecond responsiveness

Infinite zoom & pan

Works on any device

Native performance

Instant alerts

Monitor anywhere

AI-native observability

Continuous delivery

Open source foundation

80% Faster Incident Resolution

AI-powered troubleshooting from detection, to root cause and blast radius identification, to reporting.

True Real-Time and Simple, even at Scale

Linearly and infinitely scalable full-stack observability, that can be deployed even mid-crisis.

90% Cost Reduction, Full Fidelity

Instead of centralizing the data, Netdata distributes the code, eliminating pipelines and complexity.

See and Map Your Entire Network

Live topology, flow analytics, and SNMP device and trap monitoring — unified with your full-stack observability.

Control Without Surrender

SOC 2 Type 2 certified with every metric kept on your infrastructure.

Integrations

800+ collectors and notification channels, auto-discovered and ready out of the box.

800+ data collectors
Auto-discovery & zero config
Cloud, infra, app protocols
Notifications out of the box
> Explore integrations
Real Results
46% Cost Reduction

Reduced monitoring costs by 46% while cutting staff overhead by 67%.

— Leonardo Antunez, Codyas

Zero Pipeline

No data shipping. No central storage costs. Query at the edge.

From Our Users
"Out-of-the-Box"

So many out-of-the-box features! I mostly don't have to develop anything.

— Simon Beginn, LANCOM Systems

No Query Language

Point-and-click troubleshooting. No PromQL, no LogQL, no learning curve.

Enterprise Ready
67% Less Staff, 46% Cost Cut

Enterprise efficiency without enterprise complexity—real ROI from day one.

— Leonardo Antunez, Codyas

SOC 2 Type 2 Certified

Zero data egress. Only metadata reaches the cloud. Your metrics stay on your infrastructure.

Full Coverage
800+ Collectors

Auto-discovered and configured. No manual setup required.

Any Notification Channel

Slack, PagerDuty, Teams, email, webhooks—all built-in.

Built for the People Who Get Paged

Because 3am alerts deserve instant answers, not hour-long hunts.

Every Industry Has Rules. We Master Them.

See how healthcare, finance, and government teams cut monitoring costs 90% while staying audit-ready.

Monitor Any Technology. Configure Nothing.

Install the agent. It already knows your stack.
From Our Users
"A Rare Unicorn"

Netdata gives more than you invest in it. A rare unicorn that obeys the Pareto rule.

— Eduard Porquet Mateu, TMB Barcelona

99% Downtime Reduction

Reduced website downtime by 99% and cloud bill by 30% using Netdata alerts.

— Falkland Islands Government

Real Savings
30% Cloud Cost Reduction

Optimized resource allocation based on Netdata alerts cut cloud spending by 30%.

— Falkland Islands Government

46% Cost Cut

Reduced monitoring staff by 67% while cutting operational costs by 46%.

— Codyas

Real Coverage
"Plugin for Everything"

Netdata has agent capacity or a plugin for everything, including Windows and Kubernetes.

— Eduard Porquet Mateu, TMB Barcelona

"Out-of-the-Box"

So many out-of-the-box features! I mostly don't have to develop anything.

— Simon Beginn, LANCOM Systems

Real Speed
Troubleshooting in 30 Seconds

From 2-3 minutes to 30 seconds—instant visibility into any node issue.

— Matthew Artist, Nodecraft

20% Downtime Reduction

20% less downtime and 40% budget optimization from out-of-the-box monitoring.

— Simon Beginn, LANCOM Systems

Pay per Node. Unlimited Everything Else.

One price per node. Unlimited metrics, logs, users, and retention. No per-GB surprises.

Free tier—forever
No metric limits or caps
Retention you control
Cancel anytime
> See pricing plans

What's Your Monitoring Really Costing You?

Most teams overpay by 40-60%. Let's find out why.

Expose hidden metric charges
Calculate tool consolidation
Customers report 30-67% savings
Results in under 60 seconds
> See what you're really paying

Your Infrastructure Is Unique. Let's Talk.

Because monitoring 10 nodes is different from monitoring 10,000.

On-prem & air-gapped deployment
Volume pricing & agreements
Architecture review for your scale
Compliance & security support
> Start a conversation

Monitoring That Sells Itself

Deploy in minutes. Impress clients in hours. Earn recurring revenue for years.

30-second live demos close deals
Zero config = zero support burden
Competitive margins & deal protection
Response in 48 hours
> Apply to partner

Per-Second Metrics at Homelab Prices

Same engine, same dashboards, same ML. Just priced for tinkerers.

Community: Free forever · 5 nodes · non-commercial
Homelab: $90/yr · unlimited nodes · fair usage
> Get the Homelab Plan

$1,000 Per Referral. Unlimited Referrals.

Your colleagues get 10% off. You get 10% commission. Everyone wins.

10% of subscriptions, up to $1,000 each
Track earnings inside Netdata Cloud
PayPal/Venmo payouts in 3-4 weeks
No caps, no complexity
> Get your referral link
Cost Proof
40% Budget Optimization

"Netdata's significant positive impact" — LANCOM Systems

Calculate Your Savings

Compare vs Datadog, Grafana, Dynatrace

Savings Proof
46% Cost Reduction

"Cut costs by 46%, staff by 67%" — Codyas

30% Cloud Bill Savings

"Reduced cloud bill by 30%" — Falkland Islands Gov

Enterprise Proof
"Better Than Combined Alternatives"

"Better observability with Netdata than combining other tools." — TMB Barcelona

Real Engineers, <24h Response

DPA, SLAs, on-prem, volume pricing

Why Partners Win
Demo Live Infrastructure

One command, 30 seconds, real data—no sandbox needed

Zero Tickets, High Margins

Auto-config + per-node pricing = predictable profit

Homelab Ready
Free Video Course

8-episode Netdata tutorial by LearnLinux.tv

76k+ GitHub Stars

3rd most starred monitoring project

Worth Recommending
Product That Delivers

Customers report 40-67% cost cuts, 99% downtime reduction

Zero Risk to Your Rep

Free tier lets them try before they buy

AI Support Assistant, Available 24/7

Nedi has access to all official documentation, source code, and resources. Ask any question about Netdata—responds in your language.

Deployment & configuration
Troubleshooting & sizing
Alerts & notifications
Evidence-based answers
> Ask Nedi now

Never Fight Fires Alone

Docs, community, and expert help—pick your path to resolution.

Learn.netdata.cloud docs
Discord, Forums, GitHub
Premium support available
> Get answers now

60 Seconds to First Dashboard

One command to install. Zero config. 850+ integrations documented.

Linux, Windows, K8s, Docker
Auto-discovers your stack
> Read our documentation

Level Up Your Monitoring

Real problems. Real solutions. 112+ guides from basic monitoring to AI observability.

76,000+ Engineers Strong

615+ contributors. 1.5M daily downloads. One mission: simplify observability.

Per-Second. 90% Cheaper. Data Stays Home.

Side-by-side comparisons: costs, real-time granularity, and data sovereignty for every major tool.

See why teams switch from Datadog, Prometheus, Grafana, and more.

> Browse all comparisons
Edge-Native Observability, Born Open Source
Per-second visibility, ML on every metric, and data that never leaves your infrastructure.
Founded in 2016
615+ contributors worldwide
Remote-first, engineering-driven
Open source first
> Read our story
Promises We Publish—and Prove
12 principles backed by open code, independent validation, and measurable outcomes.
Open source, peer-reviewed
Zero config, instant value
Data sovereignty by design
Aligned pricing, no surprises
> See all 12 principles
Edge-Native, AI-Ready, 100% Open
76k+ stars. Full ML, AI, and automation—GPLv3+, not premium add-ons.
76,000+ GitHub stars
GPLv3+ licensed forever
ML on every metric, included
Zero vendor lock-in
> Explore our open source
Build Real-Time Observability for the World
Remote-first team shipping per-second monitoring with ML on every metric.
Remote-first, fully distributed
Open source (76k+ stars)
Challenging technical problems
Your code on millions of systems
> See open roles
Meet the Team Behind Netdata
Conferences, meetups, and tradeshows where you can see Netdata in action and talk to the engineers who build it.
Live demos and deep dives
Book 1-on-1 meetings
Talks and panel sessions
Event recaps and photos
> See all events
Talk to a Netdata Human in <24 Hours
Sales, partnerships, press, or professional services—real engineers, fast answers.
Discuss your observability needs
Pricing and volume discounts
Partnership opportunities
Media and press inquiries
> Book a conversation
Your Data. Your Rules.
On-prem data, cloud control plane, transparent terms.
Trust & Scale
76,000+ GitHub Stars

One of the most popular open-source monitoring projects

SOC 2 Type 2 Certified

Enterprise-grade security and compliance

Data Sovereignty

Your metrics stay on your infrastructure

Validated
University of Amsterdam

"Most energy-efficient monitoring solution" — ICSOC 2023, peer-reviewed

ADASTEC (Autonomous Driving)

"Doesn't miss alerts—mission-critical trust for safety software"

Community Stats
615+ Contributors

Global community improving monitoring for everyone

1.5M+ Downloads/Day

Trusted by teams worldwide

GPLv3+ Licensed

Free forever, fully open source agent

Why Join?
Remote-First

Work from anywhere, async-friendly culture

Impact at Scale

Your work helps millions of systems

Netdata vs Auvik

See every packet, process, and anomaly in real time — not next minute

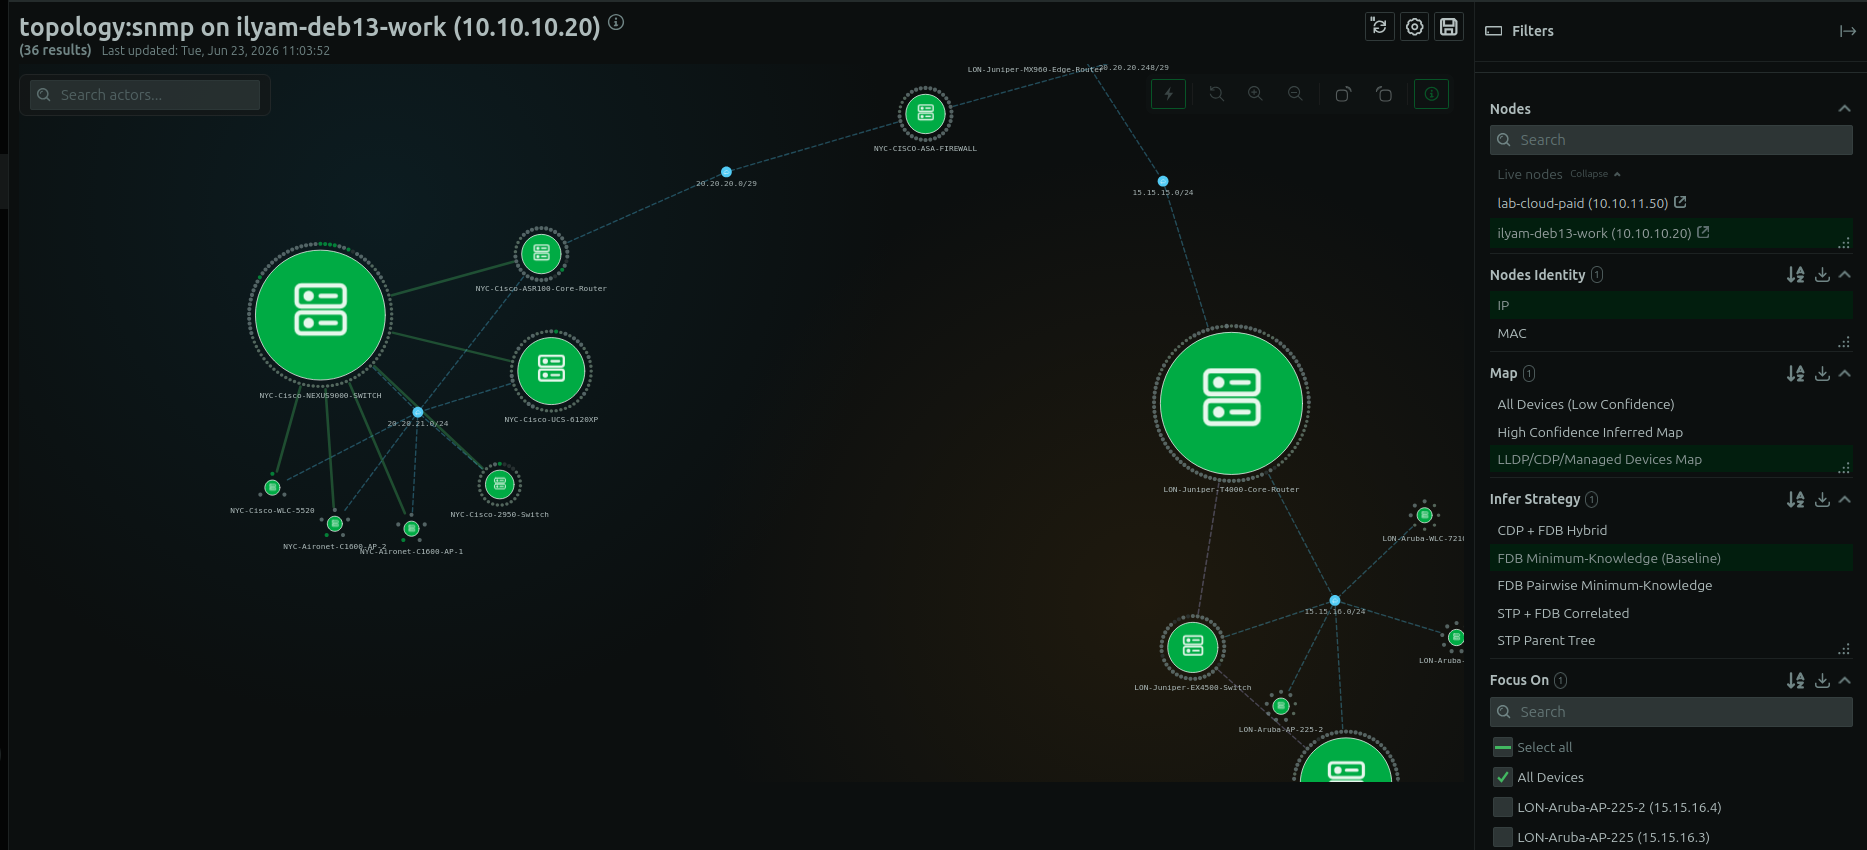
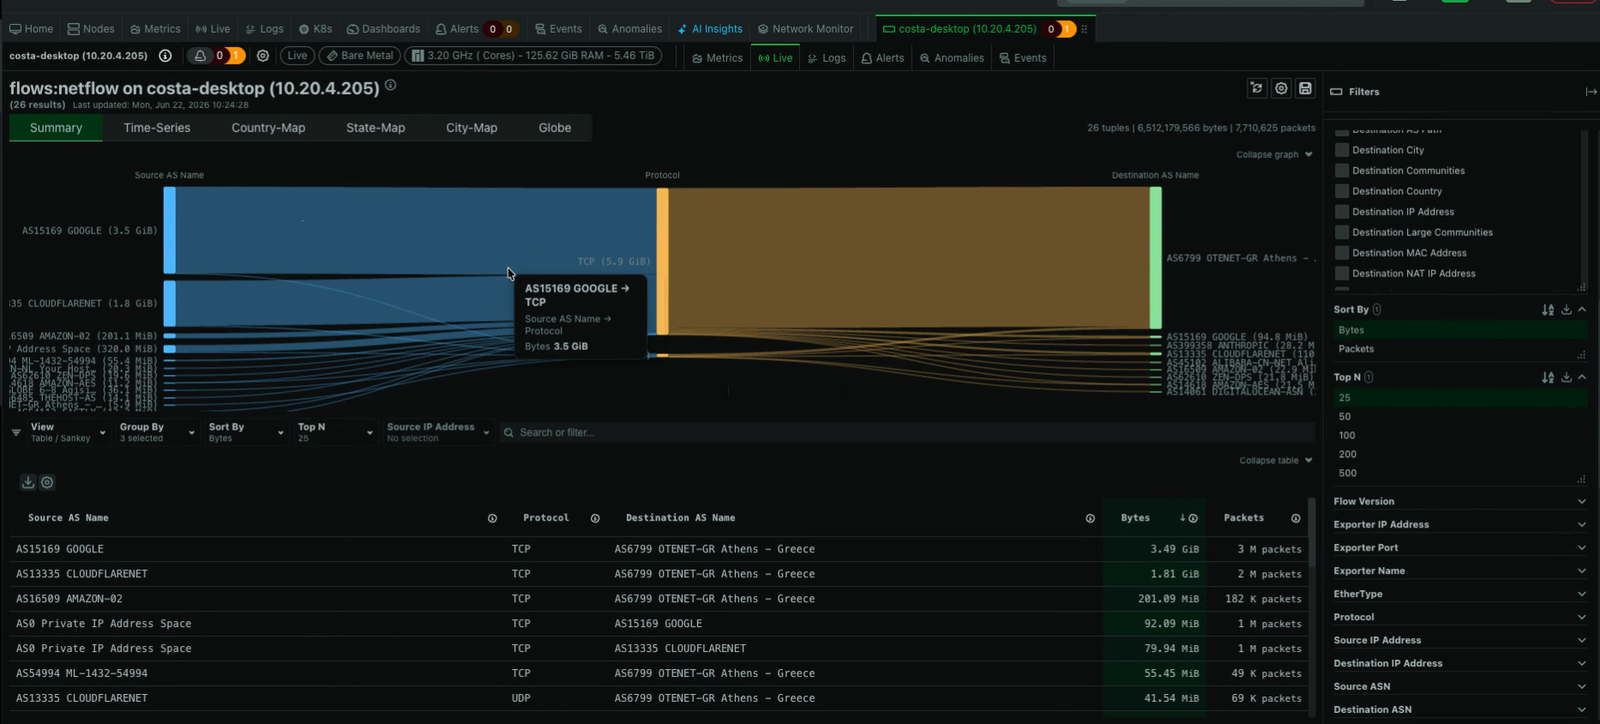
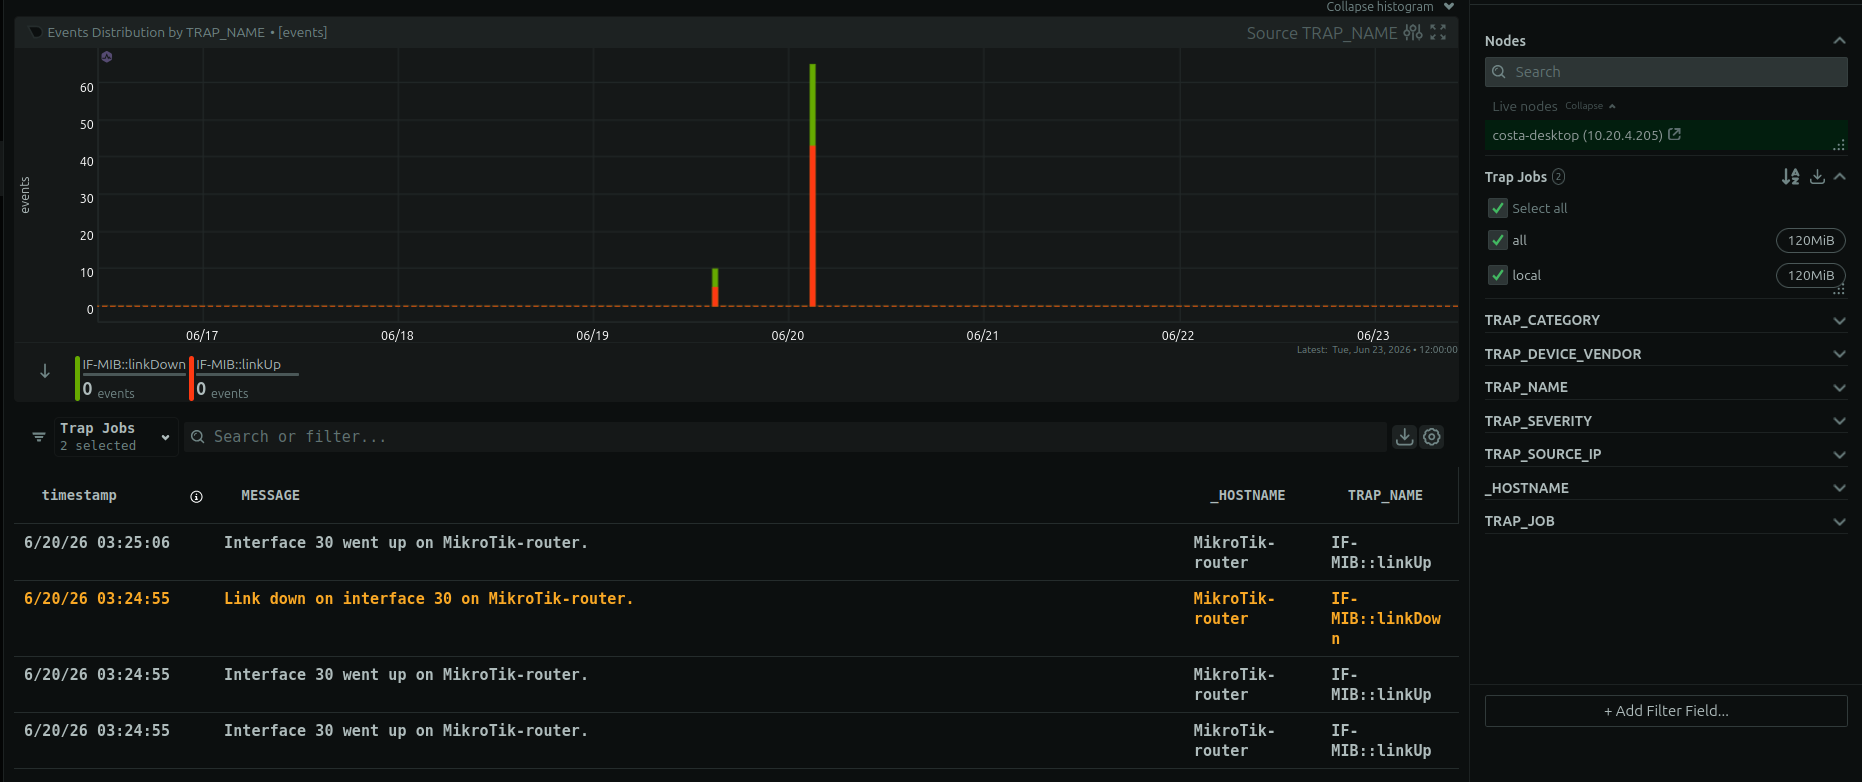
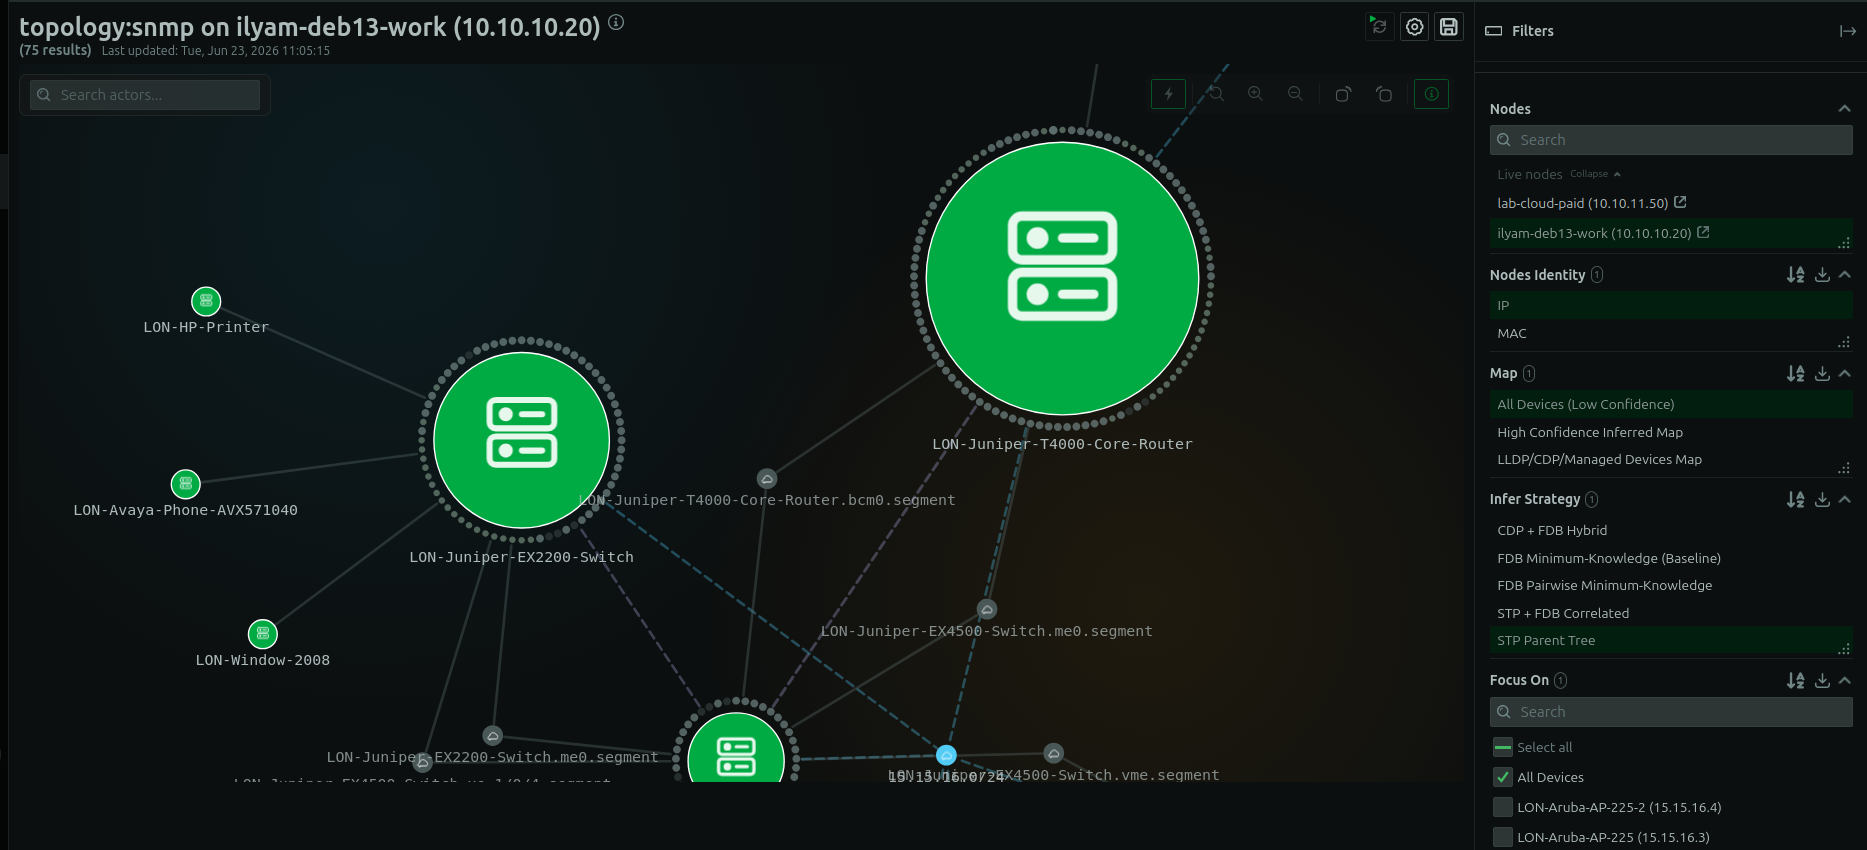
Auvik excels at automated network topology and MSP-grade config management. But if you need per-second visibility across servers, containers, applications, logs, and network fabric — with ML-powered anomaly detection and zero lock-in — Netdata delivers a fundamentally different class of observability.

Background Hero

Why teams switch from Auvik to Netdata

Six capabilities that change how you monitor and troubleshoot

Per-Second Granularity

Auvik polls at ~1-minute intervals. Netdata collects every second with sub-second visualization — catch microbursts, transients, and intermittent failures that minute-level polling simply misses.

ML Anomaly Detection

Auvik relies on threshold-based alerts. Netdata trains 18 unsupervised ML models per metric, cutting false positives by ~99% and surfacing anomalies before they trigger incidents.

Full-Stack Scope

Auvik is network-centric. Netdata unifies network, servers, containers, applications, and logs — one platform, one-second resolution, zero silos.

Native SNMP Trap Receiver

Netdata ships 150,000+ trap definitions from 800+ vendors as severity-tagged structured logs. Auvik’s trap handling is not clearly documented.

Richer Flow Analysis

Netdata’s built-in flow analyzer supports NetFlow v5/v7/v9, IPFIX, and sFlow v5 with Sankey diagrams, geographic maps to street level, and GeoIP/ASN enrichment.

Self-Hostable & Open

Auvik is SaaS-only — your data leaves the premises. Netdata agents are open-source, and with Netdata Parents you keep data on-prem with full sovereignty.

Trusted by DevOps, SRE, and network teams worldwide

Platform Overview

Netdata vs Auvik

Two fundamentally different philosophies: Auvik is a cloud-based network management platform built for MSPs. Netdata is a real-time, full-stack observability platform with edge intelligence and open-source agents.

Capability

Netdata

Auvik

Data Granularity

✅ Per-Second Collection
Sub-second visualization, real-time troubleshooting

⚠️ ~1-Minute Polling
Rolled up over time, misses transients

Scope

✅ Full-Stack
Network, servers, containers, apps, logs

⚠️ Network-Centric
Expanded to servers/endpoints, not full app/log stack

Anomaly Detection

✅ ML-Powered
18 models per metric, ~99% fewer false positives

⚠️ Threshold-Based
64+ preconfigured threshold alerts, no ML

Topology Mapping

✅ Full Dependency View
LLDP/CDP/BGP/OSPF fabric + app/process/container maps

✅ Strong L1–L3 Maps
Automated SNMP+CDP+LLDP, port-level, MSP-grade

Network Config Mgmt (NCM)

❌ Not Available
No config backup, diff, or rollback

✅ Advanced
Automatic backup, version diff, change audit, rollback

Flow Analysis

✅ Advanced
NetFlow v5/v7/v9, IPFIX, sFlow v5, Sankey, geo maps

✅ Good
TrafficInsights: NetFlow/sFlow traffic analysis by app/user/geo

SNMP Trap Reception

✅ Advanced
150,000+ trap definitions, 800+ vendors, structured logs

⚠️ Limited/Undocumented
Trap receiver support not clearly documented

Deployment Model

✅ Self-Hostable or SaaS
Open-source agents, data stays on-prem option

⚠️ SaaS-Only
Cloud mandatory, data leaves premises

AI Capabilities

✅ Advanced
AI troubleshooting, root cause analysis, reporting, MCP

❌ Not Available
No AI-powered analysis or reporting

MSP Multi-Tenancy

⚠️ Limited
Multi-space support, not MSP purpose-built

✅ Purpose-Built
Per-client isolation, per-client billing, MSP workflows

Pricing Model

✅ Per-Node
Open-source agents free to run, predictable per-node

⚠️ Per-Billable-Device SaaS
Quote-based subscription, tiered volume discounts

Open Source

✅ Yes
Agent is open-source, extensible, community-driven

❌ No
Proprietary SaaS platform

What changes when you move to Netdata

Troubleshoot at the speed of reality

Per-second data collection and sub-second visualization mean you see problems the moment they happen — not a minute later when the evidence has already been averaged away.

1s vs 60s

Learn about real-time architecture

Troubleshoot at the speed of reality

ML that cuts alert noise by ~99%

Instead of static thresholds that fire on every spike, Netdata’s unsupervised ML learns normal baselines for every metric and flags genuine anomalies — so your team focuses on what matters.

18 ML models per metric

Explore anomaly detection

ML that cuts alert noise by ~99%

Network + servers + apps + logs in one pane

Stop juggling tools. Netdata gives you SNMP device monitoring, server health, container metrics, application performance, and systemd/Windows logs — all at one-second resolution.

Unified full-stack

See full coverage

Network + servers + apps + logs in one pane

Your data stays where you want it

Auvik is SaaS-only — your network telemetry leaves your premises. Netdata agents are open-source, and with Netdata Parents you can keep all observability data on-premises with full sovereignty.

On-prem option

Learn about data sovereignty

Your data stays where you want it

Feature Coverage

Monitoring Features Side by Side

What can you monitor with each platform? Auvik is strong on network devices and server/endpoint basics. Netdata covers the full stack — from network fabric to container internals to application logs.

Monitoring Capability

Netdata

Auvik

Network Device Monitoring (SNMP)

✅ Advanced
100+ vendor profiles, SNMPv1/v2c/v3, auto-discovery

✅ Advanced
700+ vendors, 15,000+ device types, custom pollers

SNMP Trap Reception

✅ Advanced
Native receiver, 150k+ definitions, structured logs

⚠️ Limited
Trap handling not clearly documented

Flow / Traffic Analysis

✅ Advanced
NetFlow v5/v7/v9, IPFIX, sFlow v5, Sankey, geo maps

✅ Good
TrafficInsights: NetFlow/sFlow traffic by app/user/destination

Network Topology Mapping

✅ Good
LLDP/CDP/BGP/OSPF + process/container dependency maps

✅ Advanced
Best-in-class automated L1–L3 port-level topology

Network Config Management (NCM)

❌ Not Available
No config backup, diff, audit, or rollback

✅ Advanced
Automatic config backup, version diff, change auditing

Server / OS Monitoring

✅ Advanced
Per-second CPU, RAM, disk, network, systemd services

✅ Good
Windows server and endpoint monitoring expanded

Container Monitoring

✅ Advanced
Docker, Kubernetes per-second metrics, cgroup-level

❌ Not Available
Not a focus area for Auvik

Kubernetes Monitoring

✅ Advanced
Pod, container, node metrics at 1s resolution

❌ Not Available
Not part of Auvik’s platform

Log Management

✅ Advanced
Systemd journal, Windows events, zero-pipeline logs

❌ Not Available
No log collection or search

Application Metrics

✅ Advanced
800+ plugins, OpenMetrics, OpenTelemetry, StatsD

❌ Not Available
Not an application monitoring platform

Database Monitoring

✅ Advanced
PostgreSQL, MySQL, Redis, MongoDB, and more per-second

❌ Not Available
Not covered by Auvik

Process-Level Monitoring

✅ Advanced
Per-process CPU, memory, I/O, network connections

❌ Not Available
Not a process-level observability tool

Explore all integrations →

Netdata’s network capabilities in action

Live Topology

Flow Analysis

SNMP Traps

Network Dashboard

Auto-Discovery


LLDP/CDP/BGP/OSPF device fabric with per-process and container dependency maps. Click any actor to see its dependencies and dependants.
Tab Background Live Topology Dashboard

Use Case Fit

Netdata vs Auvik Use Cases

Which platform fits your team’s daily workflows? Auvik is optimized for MSP network management. Netdata is built for teams who need real-time, full-stack troubleshooting.

Use Case

Netdata

Auvik

Real-Time Infrastructure Monitoring

✅ Ideal
Per-second across network, servers, containers, apps

⚠️ Limited
~1-min polling, network + basic server/endpoint

Live Troubleshooting (SSH Replacement)

✅ Ideal
Per-second charts, live process/container views, logs

⚠️ Limited
Minute-level data, network-focused, no logs

Network Device Management (NCM)

❌ Not Available
No config backup, diff, or rollback capabilities

✅ Ideal
Automatic config backup, version diff, change auditing

MSP Multi-Tenant Operations

⚠️ Limited
Multi-space support, not MSP purpose-built

✅ Ideal
Per-client isolation, billing, MSP workflows

Container & Kubernetes Monitoring

✅ Ideal
Per-second cgroup, pod, node metrics

❌ Not Available
Not covered by Auvik

Anomaly Detection & AIOps

✅ Ideal
ML per metric, AI root cause, blast radius, reporting

⚠️ Threshold-Based
64+ preconfigured threshold alerts, no ML/AI

Log Analysis & SIEM Basics

✅ Advanced
Systemd journal, Windows events, zero-pipeline logs

❌ Not Available
No log collection or search capability

Data Sovereignty / On-Premises

✅ Ideal
Open-source agents, on-prem Parents, full control

❌ Not Available
SaaS-only, data leaves premises

Application Performance Monitoring

✅ Good
800+ plugins, metrics per-second (no distributed traces yet)

❌ Not Available
Not an APM platform

Capacity Planning

✅ Advanced
Tiered retention, historical trends, ML forecasting

⚠️ Limited
Network capacity trends at minute granularity

Frequently Asked Questions