





 Netdata
What the AI investigates from
Netdata
Per-second metrics, logs and traces Netdata holds, scored by ML as they are collected.
Resolve AI
Your existing tools, queried live; Resolve keeps no raw telemetry of its own.1
AI SRE comparison Reviewed Nov 2026
Resolve AI investigates by querying the tools you already run, so it sees what those tools kept, at the resolution they kept it, and learns where to look from the runbooks and guidance your team writes. Netdata AI starts from evidence Netdata already holds: every metric every second, scored by machine learning as it is collected, and ranked for the incident before the AI reads a single line. The root cause of any alert is one click away, and because the observability and the AI are one product, there is no AI layer to rent on top of the monitoring you already pay for.

One product, the full stack
Netdata
Per-second metrics, logs and traces Netdata holds, scored by ML as they are collected.
Resolve AI
Your existing tools, queried live; Resolve keeps no raw telemetry of its own.1
Netdata
Install Agents: ML starts on every metric. No runbooks, tags or service maps first.
Netdata
Data on your Agents and Parents; Cloud as SaaS or On-Prem, air-gapped included.
Netdata
Clicks any alert or schedules an investigation; reads the report in about two minutes.
Netdata
Per investigation or an annual bundle; conversations included on Business.
Resolve AI
Credits per chat, task, triage, investigation and incident, against a contract.7
Numbers in Resolve AI text refer to the sources at the end of this page, reviewed Nov 2026.
 Where Resolve AI fits
Using both
The Resolve AI side comes from Resolve AI’s own documentation; the Netdata side from the Netdata product description.
With Resolve AI
Accuracy is tuned in a loop: give feedback on a report, find the gap (a missing integration, a mis-scoped query or missing guidance), update the team’s knowledge, and re-run the investigation to compare.
With Netdata
Machine learning models every metric on its own, and Anomaly Advisor ranks what was anomalous or changed in the incident window. That ranking is the AI’s starting evidence, so nobody has to teach Netdata where to look.
With Resolve AI
Raw telemetry is queried live from the connected tools and not retained, so an investigation sees exactly what those tools kept: their sampling, their retention and their resolution.
With Netdata
Every metric is kept per second with its anomaly flag, every received span is stored and every log field is indexed, on your own infrastructure. The detail an incident needs was collected before anyone knew it would be needed.
With Resolve AI
Teams describe their system in a Resolve.md, attach runbooks to alert filters, add dashboard guidance and sample log queries, and package procedures as skills.
With Netdata
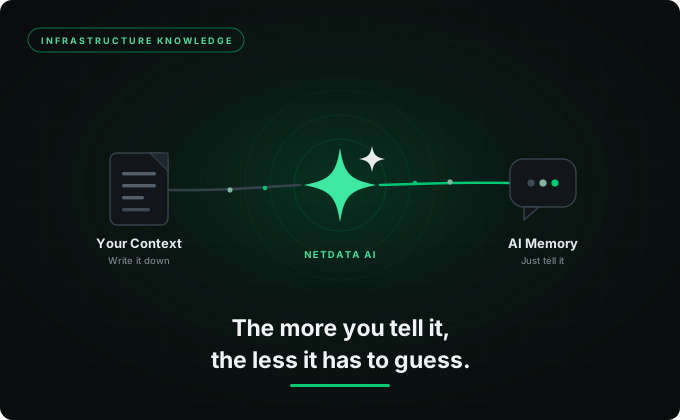
Collectors give every metric its meaning at collection time, and dependencies are learned from anomalies that cluster together. Infrastructure Knowledge, generated from the infrastructure itself, and AI Memory ground answers further.
With Resolve AI
Before Resolve takes pages first, it records whether it would close or escalate each real page, so the team can build trust; escalation criteria are written in plain language.
With Netdata
Every alert opens into its root cause one click away, with 1,100+ stock alerts already watching each instance. Teams that want investigations running on their own can talk to us about AI SRE.
With Resolve AI
Chats, tasks, triages, investigations and incidents each consume credits defined in the contract. Monthly caps pause automated work when reached, and deeper investigation modes do more work per alert.
With Netdata
AI Conversations are included on the Business plan, subject to fair use. AI Investigations are bought per investigation or as an annual bundle, next to observability priced per node.
Resolve AI features come from its documentation, checked on the date shown in Sources.
01
Netdata AI receives the answer’s raw material before it starts reasoning.
The result: 80% faster MTTR, with no runbooks, service maps or tagging rules between the alert and its root cause. Malmö stad cut a full day of troubleshooting to under 30 minutes (case study).

02
An AI SRE that queries other tools inherits their gaps. Netdata closes them at collection time.

03
Netdata distributes the code, instead of centralizing the data, and opens it to AI under the same access controls as the dashboard.

| Capability | Netdata | Resolve AI |
|---|---|---|
| Observability data | Full-stack data, built inInfrastructure, Kubernetes, 50+ databases, logs, OpenTelemetry traces, network devices, topology and flows, RUM and synthetic journeys, collected and stored by Netdata itself. | Needs an observability stackReads the tools you connect, such as Datadog, Grafana, Splunk, Elasticsearch, New Relic, Dynatrace, AWS, GCP and Azure.8 |
| Anomaly detection | ML on every metric18 unsupervised models per metric, with the anomaly flag stored with every sample, so anomaly rates exist for any metric, window and history. | Inherits your tools’ signalsInvestigations start from alerts flowing in from your monitoring tools; agents then query those tools for evidence.2 |
| Finding the cause | Ranked evidence, then AIAnomaly Advisor and Metric Correlations rank what was anomalous or changed most in the window; Netdata AI reasons over those few hundred metrics, with logs, traces and live views. | Parallel agents query your toolsA team of agents explores theories in parallel, builds a causal timeline and cites every query and data point in its report.2 |
| Service dependencies | Learned from behavior and connectionsDependencies found from anomalies that cluster together, plus a map of processes, containers and services built from live network connections and a service map built from traces. | A Satellite in each clusterThe Satellite watches the Kubernetes API and DNS Tap in clusters where it is deployed to infer how services interact.4 |
| Team knowledge | Meaning collected with the dataEvery metric arrives with its unit, family and aggregation; Infrastructure Knowledge and AI Memory, generated from the infrastructure or written, ground the AI further. | Written and tuned by the teamResolve.md, alert runbooks, dashboard guidance, sample queries and skills, improved through feedback and re-investigation.39 |
| Alerts and paging | Alerts on every instance, everywhere1,100+ stock alerts evaluated on every Agent and Parent, routed by room, role and severity through 30 Agent methods and 16 Netdata Cloud integrations. | Takes pages from your pagerPrimary On-Call sits first on the escalation policy of PagerDuty, incident.io, Rootly, Datadog On-Call or Splunk On-Call, and closes or escalates.6 |
| Actions and context | Code, tickets and incidents in contextMCP Connections bring GitHub, Atlassian (Jira, Confluence, Bitbucket), PagerDuty and custom MCP servers into Netdata AI investigations. | Write tools behind a policyAdmins set each write tool to Blocked, Needs approval or Always allow, for pull requests, workflow runs and paging.15 |
| Investigation depth and cost | One click, about two minutesAI Investigations from any alert, time window or question, also scheduled daily, weekly or monthly, with results in about two minutes and email notification. | Depth chosen per alert filterTriage, Adaptive or Always deep investigate per alert filter; each mode does a different amount of work against the credit allowance.710 |
| AI assistant access | MCP servers on every nodeMCP servers on every Agent, Parent and Netdata Cloud, with live Functions for processes, connections, logs, traces, topology and flows, under the user’s Netdata Cloud role. | MCP server for its findingsResolve MCP server and REST API, with plugins for Claude Code, Codex and Cursor to drive investigations.211 |
Numbers in Resolve AI cells refer to the sources at the end of this page.
Trusted by teams worldwide
















Finding the root cause has dropped in some cases to minutes.
Reviewed Nov 2026
Claims about Resolve AI come from its official documentation, checked on the dates shown.


