See Every Second, Not Every Five Minutes
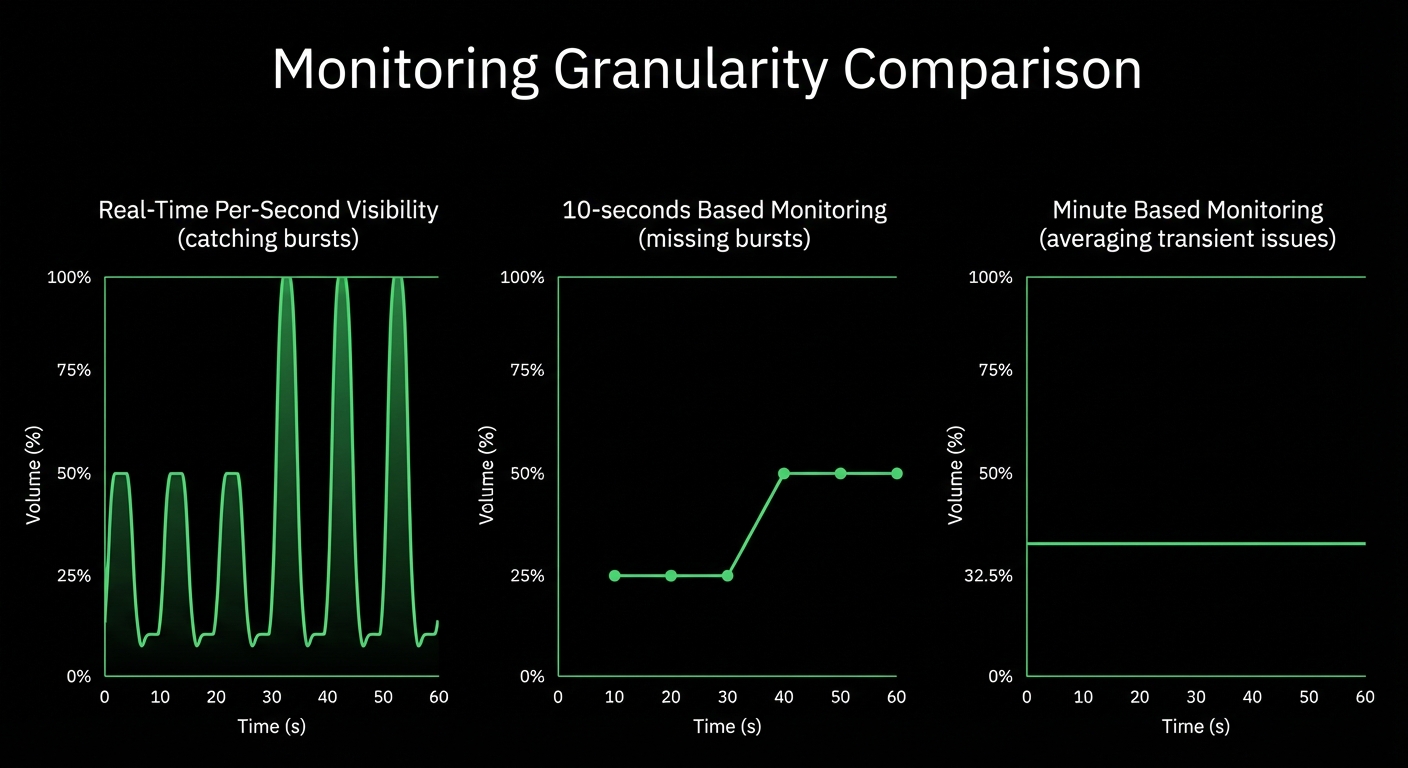
Site24x7’s 5-minute polling misses 90% of incidents. Netdata’s per-second monitoring catches transient issues, microbursts, and cascading failures - at 90% lower cost with zero configuration.

Site24x7’s 5-minute polling misses 90% of incidents. Netdata’s per-second monitoring catches transient issues, microbursts, and cascading failures - at 90% lower cost with zero configuration.

Real-time visibility without the complexity or cost
Per-second data collection catches issues Site24x7’s 5-minute polling misses - see actual spikes, not averaged-out problems.
Simple per-node pricing with unlimited metrics and logs - no surprise bills, no complex add-ons, no volume charges.
From install to complete dashboards in one minute - no manual configuration, no dashboard building, no query languages.
18 models per metric detect anomalies with 99% false positive reduction - surface unusual behavior across your entire infrastructure.
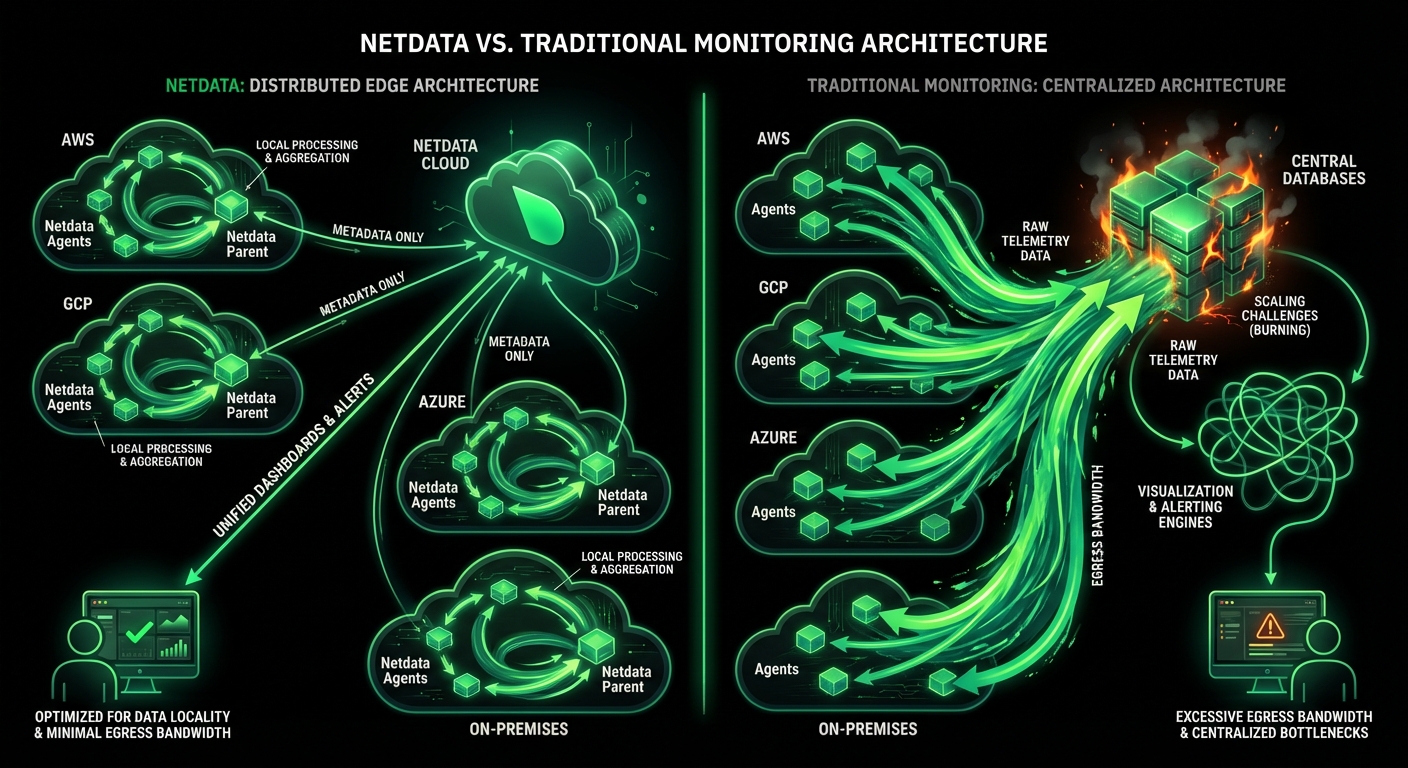
All observability data stays on your infrastructure - automatic GDPR/HIPAA/PCI compliance through edge-first architecture.
Proven at 100,000+ nodes with consistent performance - no UI lag, no bottlenecks, no architectural rewrites as you grow.
Trusted by DevOps teams worldwide
Platform Comparison
Site24x7 provides broad coverage with expensive add-ons. Netdata delivers deep infrastructure observability with predictable pricing.
Capability
Netdata
Site24x7
Data Granularity
Default collection frequency
✅ Per-Second
Catch transient issues others miss
⚠️ 5 Minutes
Misses 90% of incidents
Visualization Latency
Event to dashboard
✅ 1 Second
Sub-2-second total latency
⚠️ Minutes
Delayed visibility during incidents
Pricing Model
Cost structure
✅ Per-Node Flat Rate
Predictable, transparent pricing
⚠️ Complex Modular
Basic/Advanced/Host + add-ons
Setup Time
Install to first dashboard
✅ 60 Seconds
Instant time-to-value
⚠️ Hours to Days
Manual configuration required
Dashboard Creation
Visualization approach
✅ Algorithmic
Auto-generated, zero maintenance
⚠️ Manual
Hours of configuration
Anomaly Detection
ML-based detection
✅ 18 Models Per Metric
99% anomaly false positive reduction
⚠️ Basic RPCA
Limited anomaly detection
Metrics Cost
Custom metrics pricing
✅ Unlimited Included
No penalties for monitoring
⚠️ Per-Monitor Licenses
Costs escalate with coverage
Log Management
Log storage and analysis
✅ Unlimited Included
Zero-pipeline architecture
⚠️ Expensive Add-On
Volume-based pricing
Data Sovereignty
Where data lives
✅ Edge Storage
Compliance by design
⚠️ SaaS Only
Data egress required
Scalability
Performance at scale
✅ Linear
Proven 100,000+ nodes
⚠️ Degrades
UI lag at 3,000+ monitors
Alert Intelligence
Alert management
✅ Component-Level
400+ pre-configured alerts
⚠️ Threshold-Based
Separate alert per resource
Deployment Options
Installation flexibility
✅ SaaS/On-Prem/Hybrid
Air-gapped support available
⚠️ SaaS Only
Limited on-premise poller
300× More Granular
See Real-Time Difference

90% Cost Reduction
Calculate Your Savings

Zero Dashboard Building
Try Instant Setup

99% Anomaly False Positive Reduction
Learn About ML Detection

Feature Comparison
Comprehensive infrastructure observability without the complexity
Feature
Netdata
Site24x7

OS Monitoring
CPU, memory, storage, networking
✅ Per-Second
3,000-20,000 metrics per node
⚠️ 5-Minute Default
Limited by monitor licenses
Process Monitoring
Per-process resource tracking
✅ Native apps.plugin
Zero instrumentation required
⚠️ APM Agent Required
Additional licensing costs
Container Monitoring
Docker, Kubernetes, LXC
✅ Native cgroups
Kernel-level integration
✅ Good
DaemonSets, Helm support
Kubernetes Monitoring
Cluster, pod, service visibility
✅ Advanced
Native integration, auto-discovery
✅ Good
Basic cluster monitoring
Cloud Monitoring
AWS, Azure, GCP
✅ Hybrid Support
Agent + cloud API integration
⚠️ VMs Only
No Azure PaaS support
Database Monitoring
MySQL, PostgreSQL, MongoDB, etc.
✅ 20+ Databases
Auto-discovery, per-second metrics
✅ 15+ Databases
Requires advanced monitors
Network Monitoring
SNMP, interfaces, connections
✅ Per-Second SNMP
Unlimited traps, auto-discovery
⚠️ 5-Minute SNMP
500 trap/day limit
Log Management
Collection, search, analysis
✅ Zero-Pipeline
Direct journald access, unlimited
⚠️ Expensive
Volume-based pricing, 90-day max
Custom Metrics
StatsD, Prometheus, OpenTelemetry
✅ Unlimited
No additional costs
⚠️ Per-Monitor
Requires monitor licenses
Synthetic Checks
HTTP, API, DNS monitoring
⚠️ Basic
Limited synthetic capabilities
✅ Advanced
130 global locations
eBPF Monitoring
Kernel-level instrumentation
✅ Native ebpf.plugin
System calls, file I/O, network
❌ Not Available
No kernel-level visibility
Hardware Monitoring
GPUs, sensors, IPMI
✅ Comprehensive
NVIDIA/AMD GPUs, IPMI, sensors
⚠️ Limited
Basic hardware support
Site24x7's 5-minute polling averages out critical spikes. Netdata's per-second monitoring reveals transient issues the moment they occur.
300× more granular than Site24x7

Learn About Real-Time Monitoring
Use Case Comparison
Where each solution excels
Use Case
Netdata
Site24x7

Infrastructure Monitoring
Servers, VMs, containers
✅ Ideal
Per-second, comprehensive coverage
✅ Good
5-minute default, broad support
Live Troubleshooting
SSH replacement, real-time debugging
✅ Ideal
Console-quality precision with history
⚠️ Limited
Delayed visibility, no live state
Capacity Planning
Resource forecasting, trends
✅ Advanced
AI-powered forecasting, years of data
✅ Good
Basic forecasting, 90-day retention
Hybrid Cloud Monitoring
On-premises + cloud unified
✅ Ideal
True hybrid, consistent visibility
⚠️ Limited
VMs only, no PaaS support
Kubernetes Monitoring
Cluster, pod, container visibility
✅ Advanced
Native integration, auto-discovery
✅ Good
DaemonSets, basic monitoring
Cost Optimization
Reducing monitoring spend
✅ Ideal
90% cost reduction typical
⚠️ Expensive
Complex pricing, high costs
Compliance Monitoring
GDPR, HIPAA, PCI DSS
✅ Ideal
Edge storage, compliance by design
⚠️ Challenging
SaaS-only, data egress required
Website Uptime Monitoring
Global synthetic checks
⚠️ Basic
Limited synthetic capabilities
✅ Advanced
130 global locations
Real User Monitoring
Frontend performance, session replay
❌ Not Available
Infrastructure focus
✅ Available
Expensive for high traffic
Application Performance
Code-level visibility
✅ Good
Process + eBPF, traces Q2 2026
✅ Good
APM agents, threshold-based
Log Management
Collection, search, retention
✅ Ideal
Zero-pipeline, unlimited, included
⚠️ Expensive
Volume-based, 90-day max retention
Air-Gapped Environments
No internet connectivity
✅ Supported
Standalone agents, on-prem Cloud
❌ Not Supported
SaaS-only architecture

June 23, 2026
Discover the 5 best SolarWinds alternatives for 2026, built for the cloud-native, dynamic infrastructure legacy tools can't handle. Read the guide now!

June 23, 2026
Facing SolarWinds price increases in 2026? Learn what changed, the real impact, and a practical way to evaluate your options. Read the full guide now!

February 27, 2026
Connect AI coding agents like Claude Code, Codex, and Cursor to your entire infrastructure through one endpoint with Netdata Cloud MCP. Try it today!