The only agent that thinks for itself

Autonomous Monitoring with self-learning AI built-in, operating independently across your entire stack.

Unlimited Metrics & Logs
Machine learning & MCP
5% CPU, 150MB RAM
3GB disk, >1 year retention
800+ integrations, zero config
Dashboards, alerts out of the box
> Discover Netdata Agents
Centralized metrics streaming and storage

Aggregate metrics from multiple agents into centralized Parent nodes for unified monitoring across your infrastructure.

Stream from unlimited agents
Long-term data retention
High availability clustering
Data replication & backup
Scalable architecture
Enterprise-grade security
> Learn about Parents
Fully managed cloud platform

Access your monitoring data from anywhere with our SaaS platform. No infrastructure to manage, automatic updates, and global availability.

Zero infrastructure management
99.9% uptime SLA
Global data centers
Automatic updates & patches
Enterprise SSO & RBAC
SOC2 & ISO certified
> Explore Netdata Cloud
Deploy Netdata Cloud in your infrastructure

Run the full Netdata Cloud platform on-premises for complete data sovereignty and compliance with your security policies.

Complete data sovereignty
Air-gapped deployment
Custom compliance controls
Private network integration
Dedicated support team
Kubernetes & Docker support
> Learn about Cloud On-Premises
Powerful, intuitive monitoring interface

Modern, responsive UI built for real-time troubleshooting with customizable dashboards and advanced visualization capabilities.

Real-time chart updates
Customizable dashboards
Dark & light themes
Advanced filtering & search
Responsive on all devices
Collaboration features
> Explore Netdata UI
Monitor on the go

Native iOS and Android apps bring full monitoring capabilities to your mobile device with real-time alerts and notifications.

iOS & Android apps
Push notifications
Touch-optimized interface
Offline data access
Biometric authentication
Widget support
> Download apps

Best energy efficiency

True real-time per-second

100% automated zero config

Centralized observability

Multi-year retention

High availability built-in

Zero maintenance

Always up-to-date

Enterprise security

Complete data control

Air-gap ready

Compliance certified

Millisecond responsiveness

Infinite zoom & pan

Works on any device

Native performance

Instant alerts

Monitor anywhere

80% Faster Incident Resolution
AI-powered troubleshooting from detection, to root cause and blast radius identification, to reporting.
True Real-Time and Simple, even at Scale
Linearly and infinitely scalable full-stack observability, that can be deployed even mid-crisis.
90% Cost Reduction, Full Fidelity
Instead of centralizing the data, Netdata distributes the code, eliminating pipelines and complexity.
Control Without Surrender
SOC 2 Type 2 certified with every metric kept on your infrastructure.
Integrations

800+ collectors and notification channels, auto-discovered and ready out of the box.

800+ data collectors
Auto-discovery & zero config
Cloud, infra, app protocols
Notifications out of the box
> Explore integrations
Real Results
46% Cost Reduction

Reduced monitoring costs by 46% while cutting staff overhead by 67%.

— Leonardo Antunez, Codyas

Zero Pipeline

No data shipping. No central storage costs. Query at the edge.

From Our Users
"Out-of-the-Box"

So many out-of-the-box features! I mostly don't have to develop anything.

— Simon Beginn, LANCOM Systems

No Query Language

Point-and-click troubleshooting. No PromQL, no LogQL, no learning curve.

Enterprise Ready
67% Less Staff, 46% Cost Cut

Enterprise efficiency without enterprise complexity—real ROI from day one.

— Leonardo Antunez, Codyas

SOC 2 Type 2 Certified

Zero data egress. Only metadata reaches the cloud. Your metrics stay on your infrastructure.

Full Coverage
800+ Collectors

Auto-discovered and configured. No manual setup required.

Any Notification Channel

Slack, PagerDuty, Teams, email, webhooks—all built-in.

Built for the People Who Get Paged
Because 3am alerts deserve instant answers, not hour-long hunts.
Every Industry Has Rules. We Master Them.
See how healthcare, finance, and government teams cut monitoring costs 90% while staying audit-ready.
Monitor Any Technology. Configure Nothing.
Install the agent. It already knows your stack.
From Our Users
"A Rare Unicorn"

Netdata gives more than you invest in it. A rare unicorn that obeys the Pareto rule.

— Eduard Porquet Mateu, TMB Barcelona

99% Downtime Reduction

Reduced website downtime by 99% and cloud bill by 30% using Netdata alerts.

— Falkland Islands Government

Real Savings
30% Cloud Cost Reduction

Optimized resource allocation based on Netdata alerts cut cloud spending by 30%.

— Falkland Islands Government

46% Cost Cut

Reduced monitoring staff by 67% while cutting operational costs by 46%.

— Codyas

Real Coverage
"Plugin for Everything"

Netdata has agent capacity or a plugin for everything, including Windows and Kubernetes.

— Eduard Porquet Mateu, TMB Barcelona

"Out-of-the-Box"

So many out-of-the-box features! I mostly don't have to develop anything.

— Simon Beginn, LANCOM Systems

Real Speed
Troubleshooting in 30 Seconds

From 2-3 minutes to 30 seconds—instant visibility into any node issue.

— Matthew Artist, Nodecraft

20% Downtime Reduction

20% less downtime and 40% budget optimization from out-of-the-box monitoring.

— Simon Beginn, LANCOM Systems

Pay per Node. Unlimited Everything Else.

One price per node. Unlimited metrics, logs, users, and retention. No per-GB surprises.

Free tier—forever
No metric limits or caps
Retention you control
Cancel anytime
> See pricing plans
What's Your Monitoring Really Costing You?

Most teams overpay by 40-60%. Let's find out why.

Expose hidden metric charges
Calculate tool consolidation
Customers report 30-67% savings
Results in under 60 seconds
> See what you're really paying
Your Infrastructure Is Unique. Let's Talk.

Because monitoring 10 nodes is different from monitoring 10,000.

On-prem & air-gapped deployment
Volume pricing & agreements
Architecture review for your scale
Compliance & security support
> Start a conversation
Monitoring That Sells Itself

Deploy in minutes. Impress clients in hours. Earn recurring revenue for years.

30-second live demos close deals
Zero config = zero support burden
Competitive margins & deal protection
Response in 48 hours
> Apply to partner
Per-Second Metrics at Homelab Prices

Same engine, same dashboards, same ML. Just priced for tinkerers.

Community: Free forever · 5 nodes · non-commercial
Homelab: $90/yr · unlimited nodes · fair usage
> Start monitoring your lab—free
$1,000 Per Referral. Unlimited Referrals.

Your colleagues get 10% off. You get 10% commission. Everyone wins.

10% of subscriptions, up to $1,000 each
Track earnings inside Netdata Cloud
PayPal/Venmo payouts in 3-4 weeks
No caps, no complexity
> Get your referral link
Cost Proof
40% Budget Optimization

"Netdata's significant positive impact" — LANCOM Systems

Calculate Your Savings

Compare vs Datadog, Grafana, Dynatrace

Savings Proof
46% Cost Reduction

"Cut costs by 46%, staff by 67%" — Codyas

30% Cloud Bill Savings

"Reduced cloud bill by 30%" — Falkland Islands Gov

Enterprise Proof
"Better Than Combined Alternatives"

"Better observability with Netdata than combining other tools." — TMB Barcelona

Real Engineers, <24h Response

DPA, SLAs, on-prem, volume pricing

Why Partners Win
Demo Live Infrastructure

One command, 30 seconds, real data—no sandbox needed

Zero Tickets, High Margins

Auto-config + per-node pricing = predictable profit

Homelab Ready
"Absolutely Incredible"

"We tested every monitoring system under the sun." — Benjamin Gabler, CEO Rocket.Net

76k+ GitHub Stars

3rd most starred monitoring project

Worth Recommending
Product That Delivers

Customers report 40-67% cost cuts, 99% downtime reduction

Zero Risk to Your Rep

Free tier lets them try before they buy

Never Fight Fires Alone

Docs, community, and expert help—pick your path to resolution.

Learn.netdata.cloud docs
Discord, Forums, GitHub
Premium support available
> Get answers now
60 Seconds to First Dashboard

One command to install. Zero config. 850+ integrations documented.

Linux, Windows, K8s, Docker
Auto-discovers your stack
> Read our documentation
See Netdata in Action

Watch real-time monitoring in action—demos, tutorials, and engineering deep dives.

Product demos and walkthroughs
Real infrastructure, not staged
> Start with the 3-minute tour
Level Up Your Monitoring
Real problems. Real solutions. 112+ guides from basic monitoring to AI observability.
76,000+ Engineers Strong
615+ contributors. 1.5M daily downloads. One mission: simplify observability.
Per-Second. 90% Cheaper. Data Stays Home.
Side-by-side comparisons: costs, real-time granularity, and data sovereignty for every major tool.

See why teams switch from Datadog, Prometheus, Grafana, and more.

> Browse all comparisons
Edge-Native Observability, Born Open Source
Per-second visibility, ML on every metric, and data that never leaves your infrastructure.
Founded in 2016
615+ contributors worldwide
Remote-first, engineering-driven
Open source first
> Read our story
Promises We Publish—and Prove
12 principles backed by open code, independent validation, and measurable outcomes.
Open source, peer-reviewed
Zero config, instant value
Data sovereignty by design
Aligned pricing, no surprises
> See all 12 principles
Edge-Native, AI-Ready, 100% Open
76k+ stars. Full ML, AI, and automation—GPLv3+, not premium add-ons.
76,000+ GitHub stars
GPLv3+ licensed forever
ML on every metric, included
Zero vendor lock-in
> Explore our open source
Build Real-Time Observability for the World
Remote-first team shipping per-second monitoring with ML on every metric.
Remote-first, fully distributed
Open source (76k+ stars)
Challenging technical problems
Your code on millions of systems
> See open roles
Talk to a Netdata Human in <24 Hours
Sales, partnerships, press, or professional services—real engineers, fast answers.
Discuss your observability needs
Pricing and volume discounts
Partnership opportunities
Media and press inquiries
> Book a conversation
Your Data. Your Rules.
On-prem data, cloud control plane, transparent terms.
Trust & Scale
76,000+ GitHub Stars

One of the most popular open-source monitoring projects

SOC 2 Type 2 Certified

Enterprise-grade security and compliance

Data Sovereignty

Your metrics stay on your infrastructure

Validated
University of Amsterdam

"Most energy-efficient monitoring solution" — ICSOC 2023, peer-reviewed

ADASTEC (Autonomous Driving)

"Doesn't miss alerts—mission-critical trust for safety software"

Community Stats
615+ Contributors

Global community improving monitoring for everyone

1.5M+ Downloads/Day

Trusted by teams worldwide

GPLv3+ Licensed

Free forever, fully open source agent

Why Join?
Remote-First

Work from anywhere, async-friendly culture

Impact at Scale

Your work helps millions of systems

Compliance
SOC 2 Type 2

Audited security controls

GDPR Ready

Data stays on your infrastructure

Netdata vs Virtana

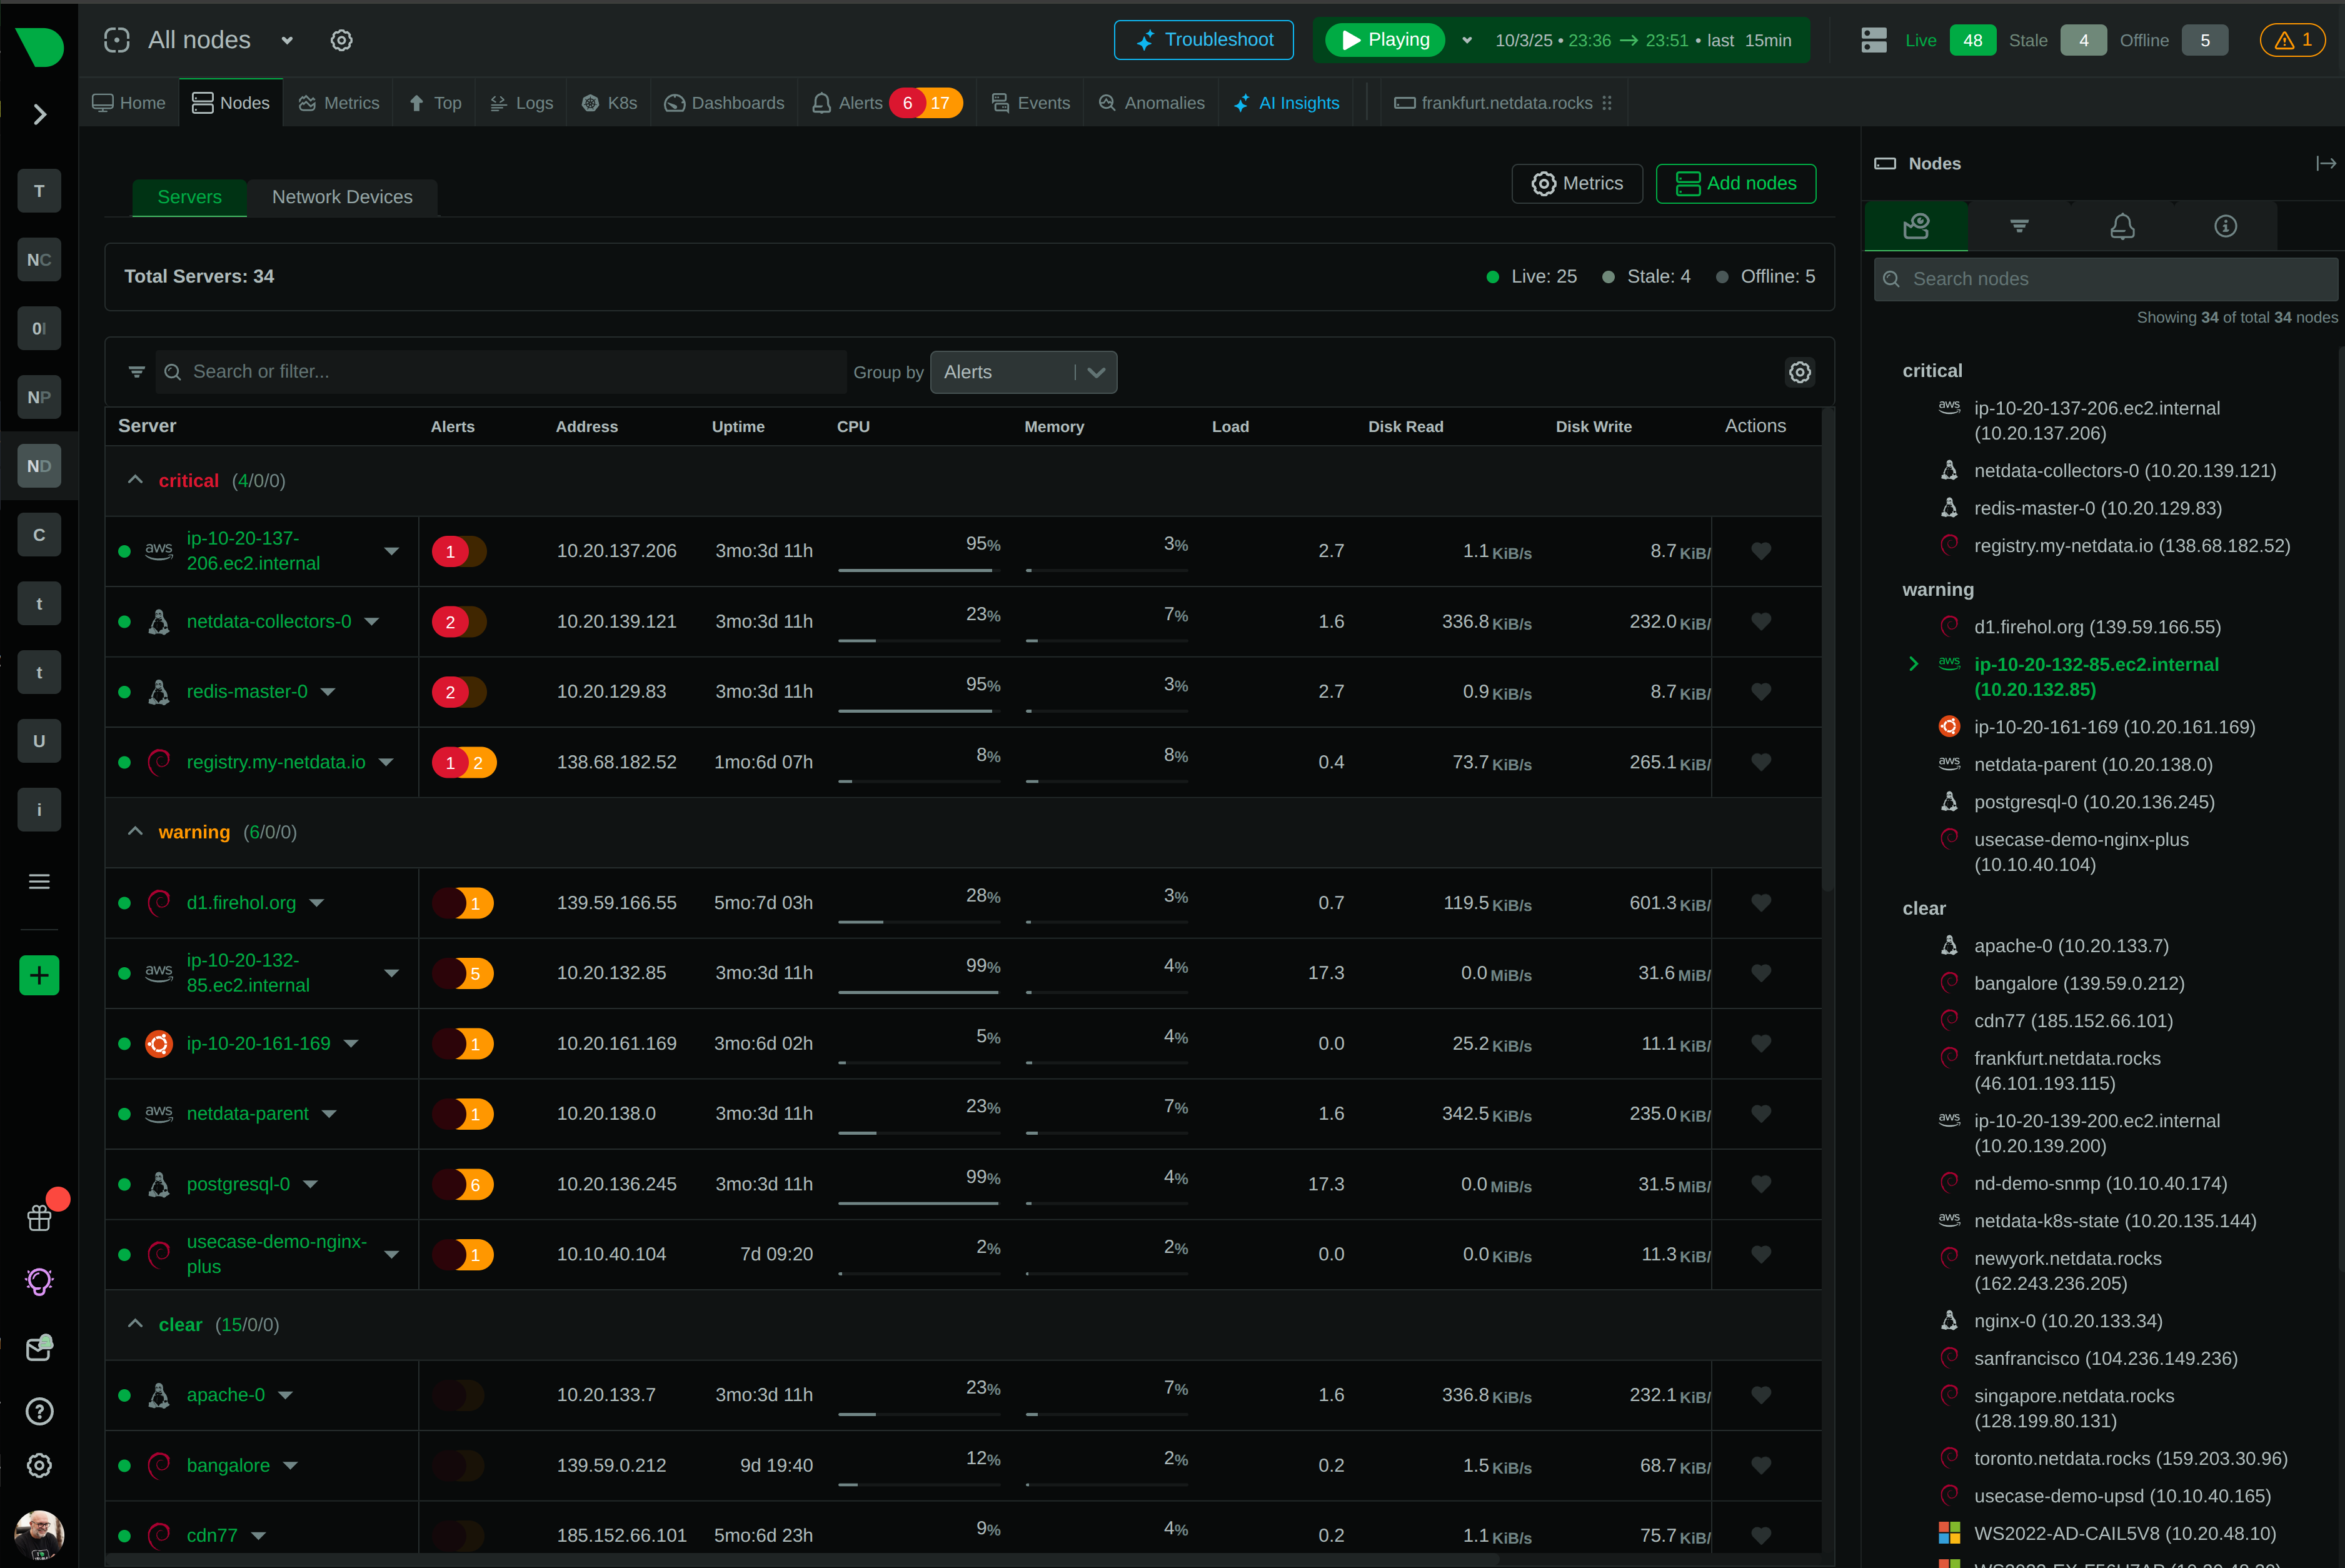
Instant Clarity When Every Second Counts

While strategic planning tools show you what happened minutes ago, your production incidents unfold in seconds. Netdata delivers the per-second visibility engineering teams need to catch problems before they cascade - transforming how you troubleshoot, respond, and maintain uptime in fast-moving environments.

Background Hero

Why Engineering Teams Choose Netdata

Built for speed, designed for clarity

60× Faster Data Collection

Per-second metrics capture transient issues that minute-level monitoring completely misses, preventing cascade failures before they impact users

Zero Configuration Required

From installation to first insights in 60 seconds - no query languages, no dashboard building, no weeks of training investment

ML on Every Metric

18 unsupervised models per metric detect anomalies at the edge with 10^-36 theoretical false positive rate through consensus-based detection

90% Cost Reduction

Transparent per-node pricing with unlimited metrics and users - no surprise bills, no volume-based charges

Complete Infrastructure Coverage

800+ auto-discovered integrations for systems, containers, applications, databases, cloud, and hardware - no blind spots

Anomaly Advisor Intelligence

Surfaces root cause in top 30-50 metrics automatically, cutting MTTR by 80% through intelligent correlation

Trusted by DevOps teams worldwide

Platform Comparison

Netdata vs Virtana: Different Tools for Different Teams

Netdata and Virtana serve complementary roles in modern IT organizations. While Virtana provides strategic planning and cost optimization for IT executives, Netdata delivers real-time operational monitoring for engineering teams. Many organizations use both - different teams, different use cases, both valuable.

Capability

Netdata

Virtana

Data Granularity

✅ Per-Second
Real-time operational monitoring

⚠️ 10-60 Seconds
Strategic planning intervals

Visualization Latency

✅ Sub-2 Seconds
Event to insight instantly

⚠️ Minutes
Batch processing delays

Setup Complexity

✅ Zero Configuration
Instant deployment, auto-discovery

⚠️ Complex Setup
Requires professional services

Learning Curve

✅ Instant Productivity
No query languages required

⚠️ Steep Learning
Extensive training needed

Pricing Model

✅ Transparent
Predictable per-node pricing

⚠️ Quote-Based
Custom pricing, no transparency

ML Anomaly Detection

✅ Edge-Based
18 models per metric locally

✅ Centralized
Cloud-based ML analytics

Target User

✅ Engineers & SREs
Operational troubleshooting focus

✅ IT Executives
Strategic planning focus

Primary Use Case

✅ Real-Time Operations
Incident response, troubleshooting

✅ Strategic Planning
Cost optimization, capacity

Data Sovereignty

✅ Edge-First
Data stays on-premises

⚠️ Centralized
SaaS platform required

Open Source

✅ GPL v3+
76,300+ GitHub stars

❌ Proprietary
Closed source platform

Cloud Cost Management

❌ Not Available
Focus on infrastructure metrics

✅ Advanced
CloudWisdom FinOps platform

SAN Fabric Monitoring

❌ Not Supported
No Fibre Channel support

✅ Native Support
Brocade, Cisco MDS integration

Transform How Your Team Operates

Catch Problems Before They Cascade

Per-second granularity reveals transient issues lasting 3-5 seconds that minute-level monitoring completely misses. See CPU spikes, memory bursts, and network congestion as they happen - not after they’ve triggered cascade failures affecting your users.

60× More Detail

Explore Real-Time Monitoring

Catch Problems Before They Cascade

Eliminate Training Overhead Completely

While other platforms require weeks of training and query language expertise, Netdata works instantly. Auto-discovered services, algorithmic dashboards, and point-and-click analysis mean new team members become productive in minutes - not months.

Zero Learning Curve

See Zero-Config in Action

Eliminate Training Overhead Completely

Surface Root Cause Automatically

Anomaly Advisor analyzes thousands of metrics in real-time, surfacing the top 30-50 most relevant to your incident. Combined with AI troubleshooting, you get from alert to resolution 80% faster - without jumping between tools or writing complex queries.

80% Faster MTTR

Discover Anomaly Advisor

Surface Root Cause Automatically

Scale Without Complexity or Cost Explosions

Edge-based architecture means adding nodes doesn’t create central bottlenecks or exponential costs. Each agent processes its own data with ML running locally - proven to 100,000+ nodes with predictable per-node pricing and no volume surprises.

90% Cost Reduction

Understand Our Architecture

Scale Without Complexity or Cost Explosions

Feature Comparison

Monitoring Capabilities Side by Side

Both platforms provide comprehensive monitoring, but with different focuses. Netdata excels at real-time operational monitoring for engineering teams, while Virtana specializes in strategic planning and cost optimization for IT executives.

Feature

Netdata

Virtana

Operating System Monitoring

✅ Advanced
Linux, Windows, FreeBSD, macOS native

✅ Good
Linux, Windows, Solaris support

Container & Kubernetes

✅ Native Integration
Per-second cgroups, k8s-state

✅ Good Support
Container observability module

Process Monitoring

✅ Real-Time
top/htop replacement with history

⚠️ Basic
Process-level metrics available

Network Connections

✅ Live Tracking
netstat/ss with anomaly detection

✅ Flow Analysis
NetFlow, sFlow support

Database Monitoring

✅ 50+ Databases
MySQL, PostgreSQL, MongoDB, etc

✅ Good Coverage
Major databases supported

Cloud Platform Integration

✅ AWS, Azure, GCP
Native cloud metrics collection

✅ Multi-Cloud
AWS, Azure, GCP support

Logs Management

✅ Zero Pipeline
Direct systemd-journal access

⚠️ Limited
Log analysis capabilities basic

Custom Application Metrics

✅ Multiple Protocols
StatsD, OpenMetrics, OTEL

✅ OTEL Support
OpenTelemetry framework

Synthetic Checks

✅ Built-In
HTTP, TCP, DNS monitoring

⚠️ Limited
Basic endpoint checks

Hardware Sensors

✅ Comprehensive
GPUs, IPMI, S.M.A.R.T., power

✅ Good
Hardware monitoring available

Storage Array Monitoring

⚠️ Via Exporters
Requires third-party integration

✅ Native Support
Dell EMC, NetApp, Pure, HPE

SAN Fabric Visibility

❌ Not Supported
No Fibre Channel monitoring

✅ Advanced
Brocade, Cisco MDS native

Explore All Integrations

Netdata's Operational Advantages

See Problems as They Happen

Per-second metrics with sub-2-second latency capture transient issues that minute-level monitoring completely misses. When a CPU spike lasts 3 seconds or a memory burst triggers for 5 seconds, you see it - not a smoothed average that hides the problem.

60× more granular than minute-level monitoring

Learn About Real-Time Monitoring
Real-Time Dashboard

Use Case Comparison

When to Use Each Platform

Netdata and Virtana excel at different use cases. Understanding these differences helps you choose the right tool - or recognize when both platforms provide complementary value within your organization.

Use Case

Netdata

Virtana

Real-Time Troubleshooting

✅ Ideal
Per-second visibility, instant RCA

⚠️ Limited
Minute-level strategic focus

Incident Response

✅ Optimized
80% MTTR reduction proven

⚠️ Basic
Not primary use case

Cloud Cost Optimization

❌ Not Supported
Focus on infrastructure metrics

✅ Core Strength
CloudWisdom FinOps platform

Capacity Planning

✅ AI-Powered
Automated insights and forecasts

✅ Advanced
Predictive analytics engine

Workload Migration Planning

❌ Not Available
Not applicable to use case

✅ Specialized
Workload Placement module

Container Observability

✅ Native Support
Per-second cgroups metrics

✅ Good Support
Container module available

Kubernetes Monitoring

✅ Comprehensive
Native k8s-state collector

✅ Good
Kubernetes observability

Application Performance

✅ Good
Process-level, no traces yet

⚠️ Limited
Basic APM capabilities

Storage Infrastructure

⚠️ Via Exporters
Requires third-party tools

✅ Native Support
Deep storage array monitoring

SAN Fabric Management

❌ Not Supported
No Fibre Channel support

✅ Advanced
Native FC/FCoE monitoring

Live System Debugging

✅ Console Replacement
top, netstat, ss with history

⚠️ Limited
Not primary focus

Component-Level Alerts

✅ 400+ Pre-Configured
Intelligent alert configuration

✅ Event Intelligence
AIOps correlation engine

Frequently Asked Questions