Gain Complete Visibility Without Configuration Burden
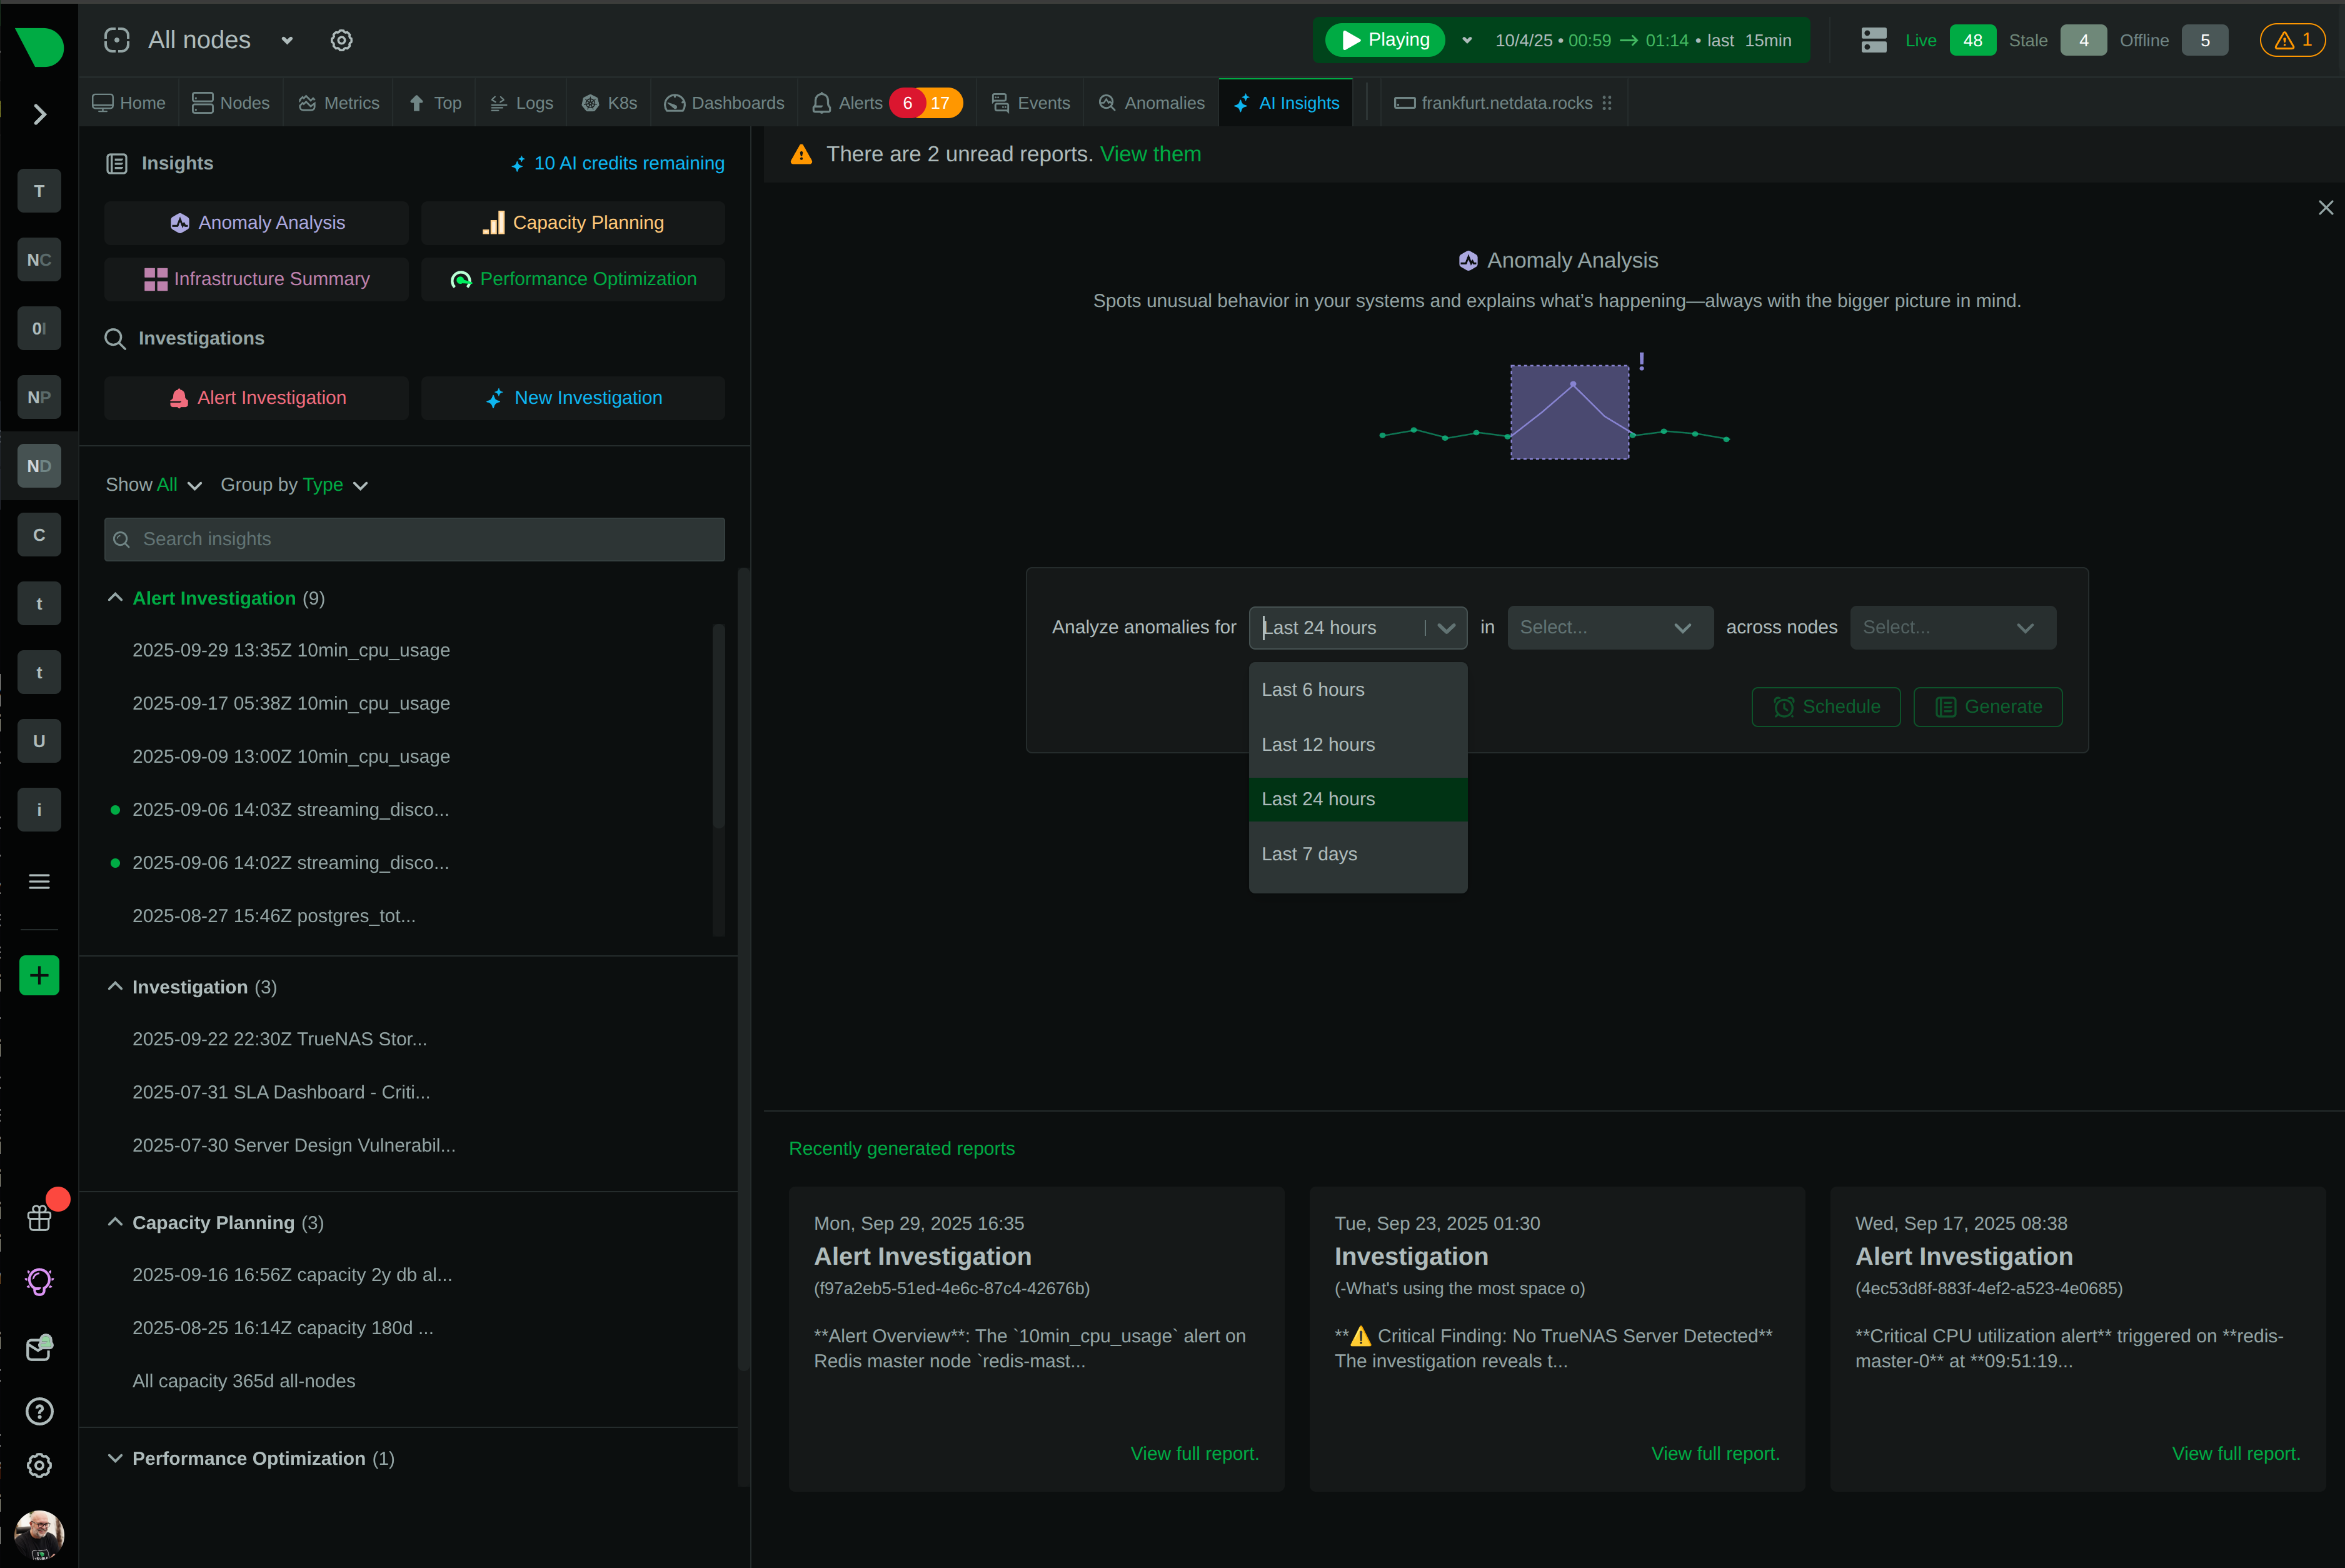
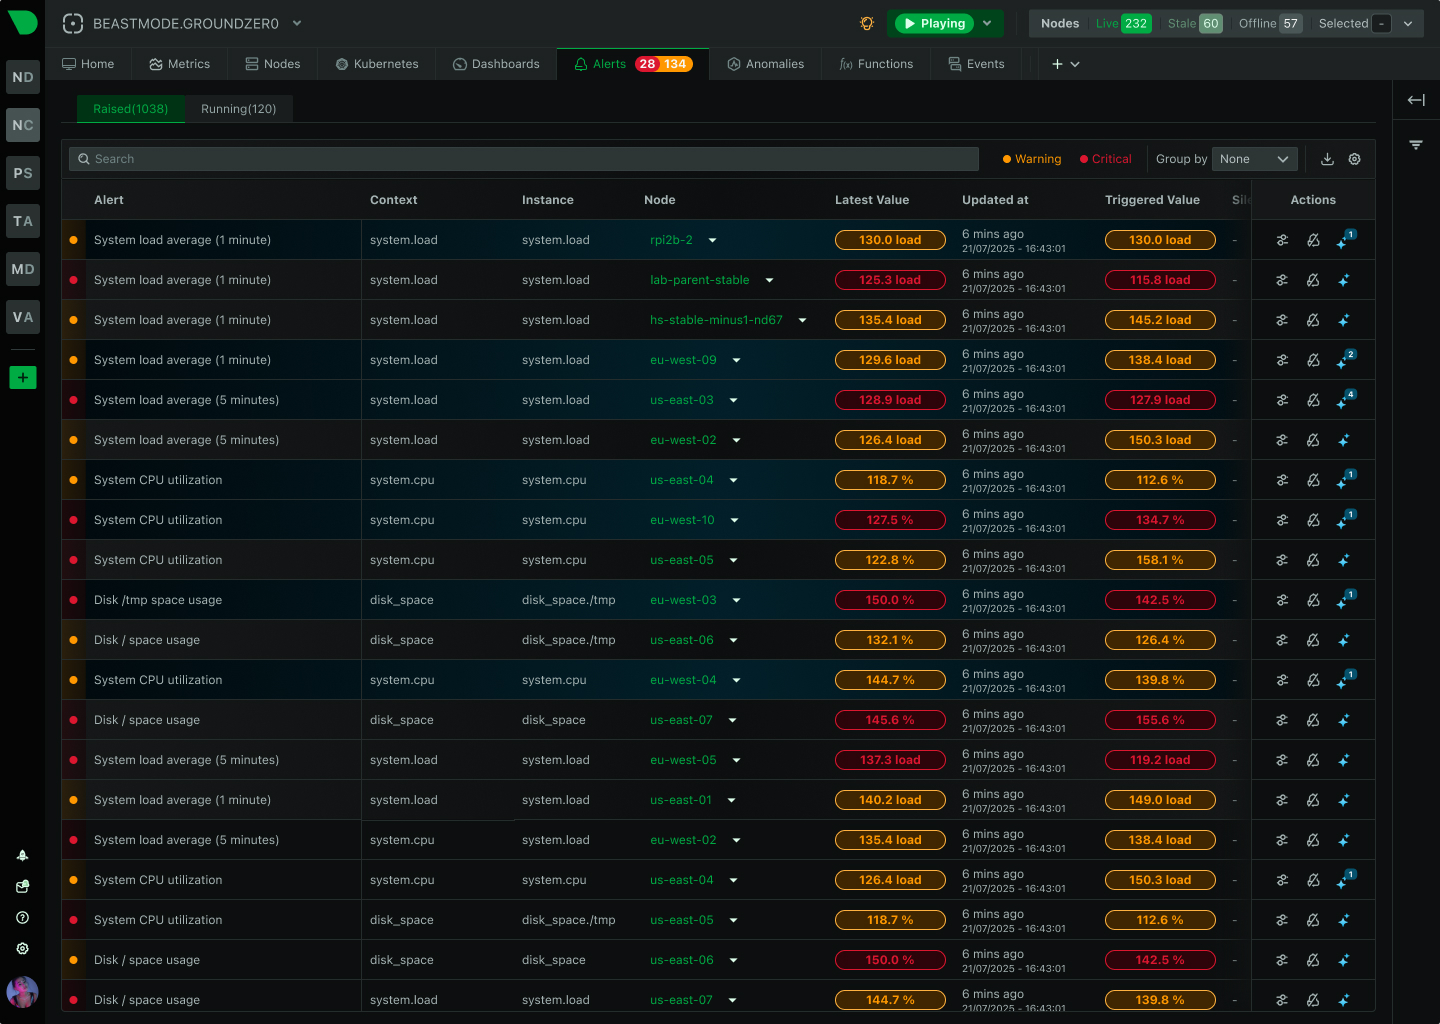
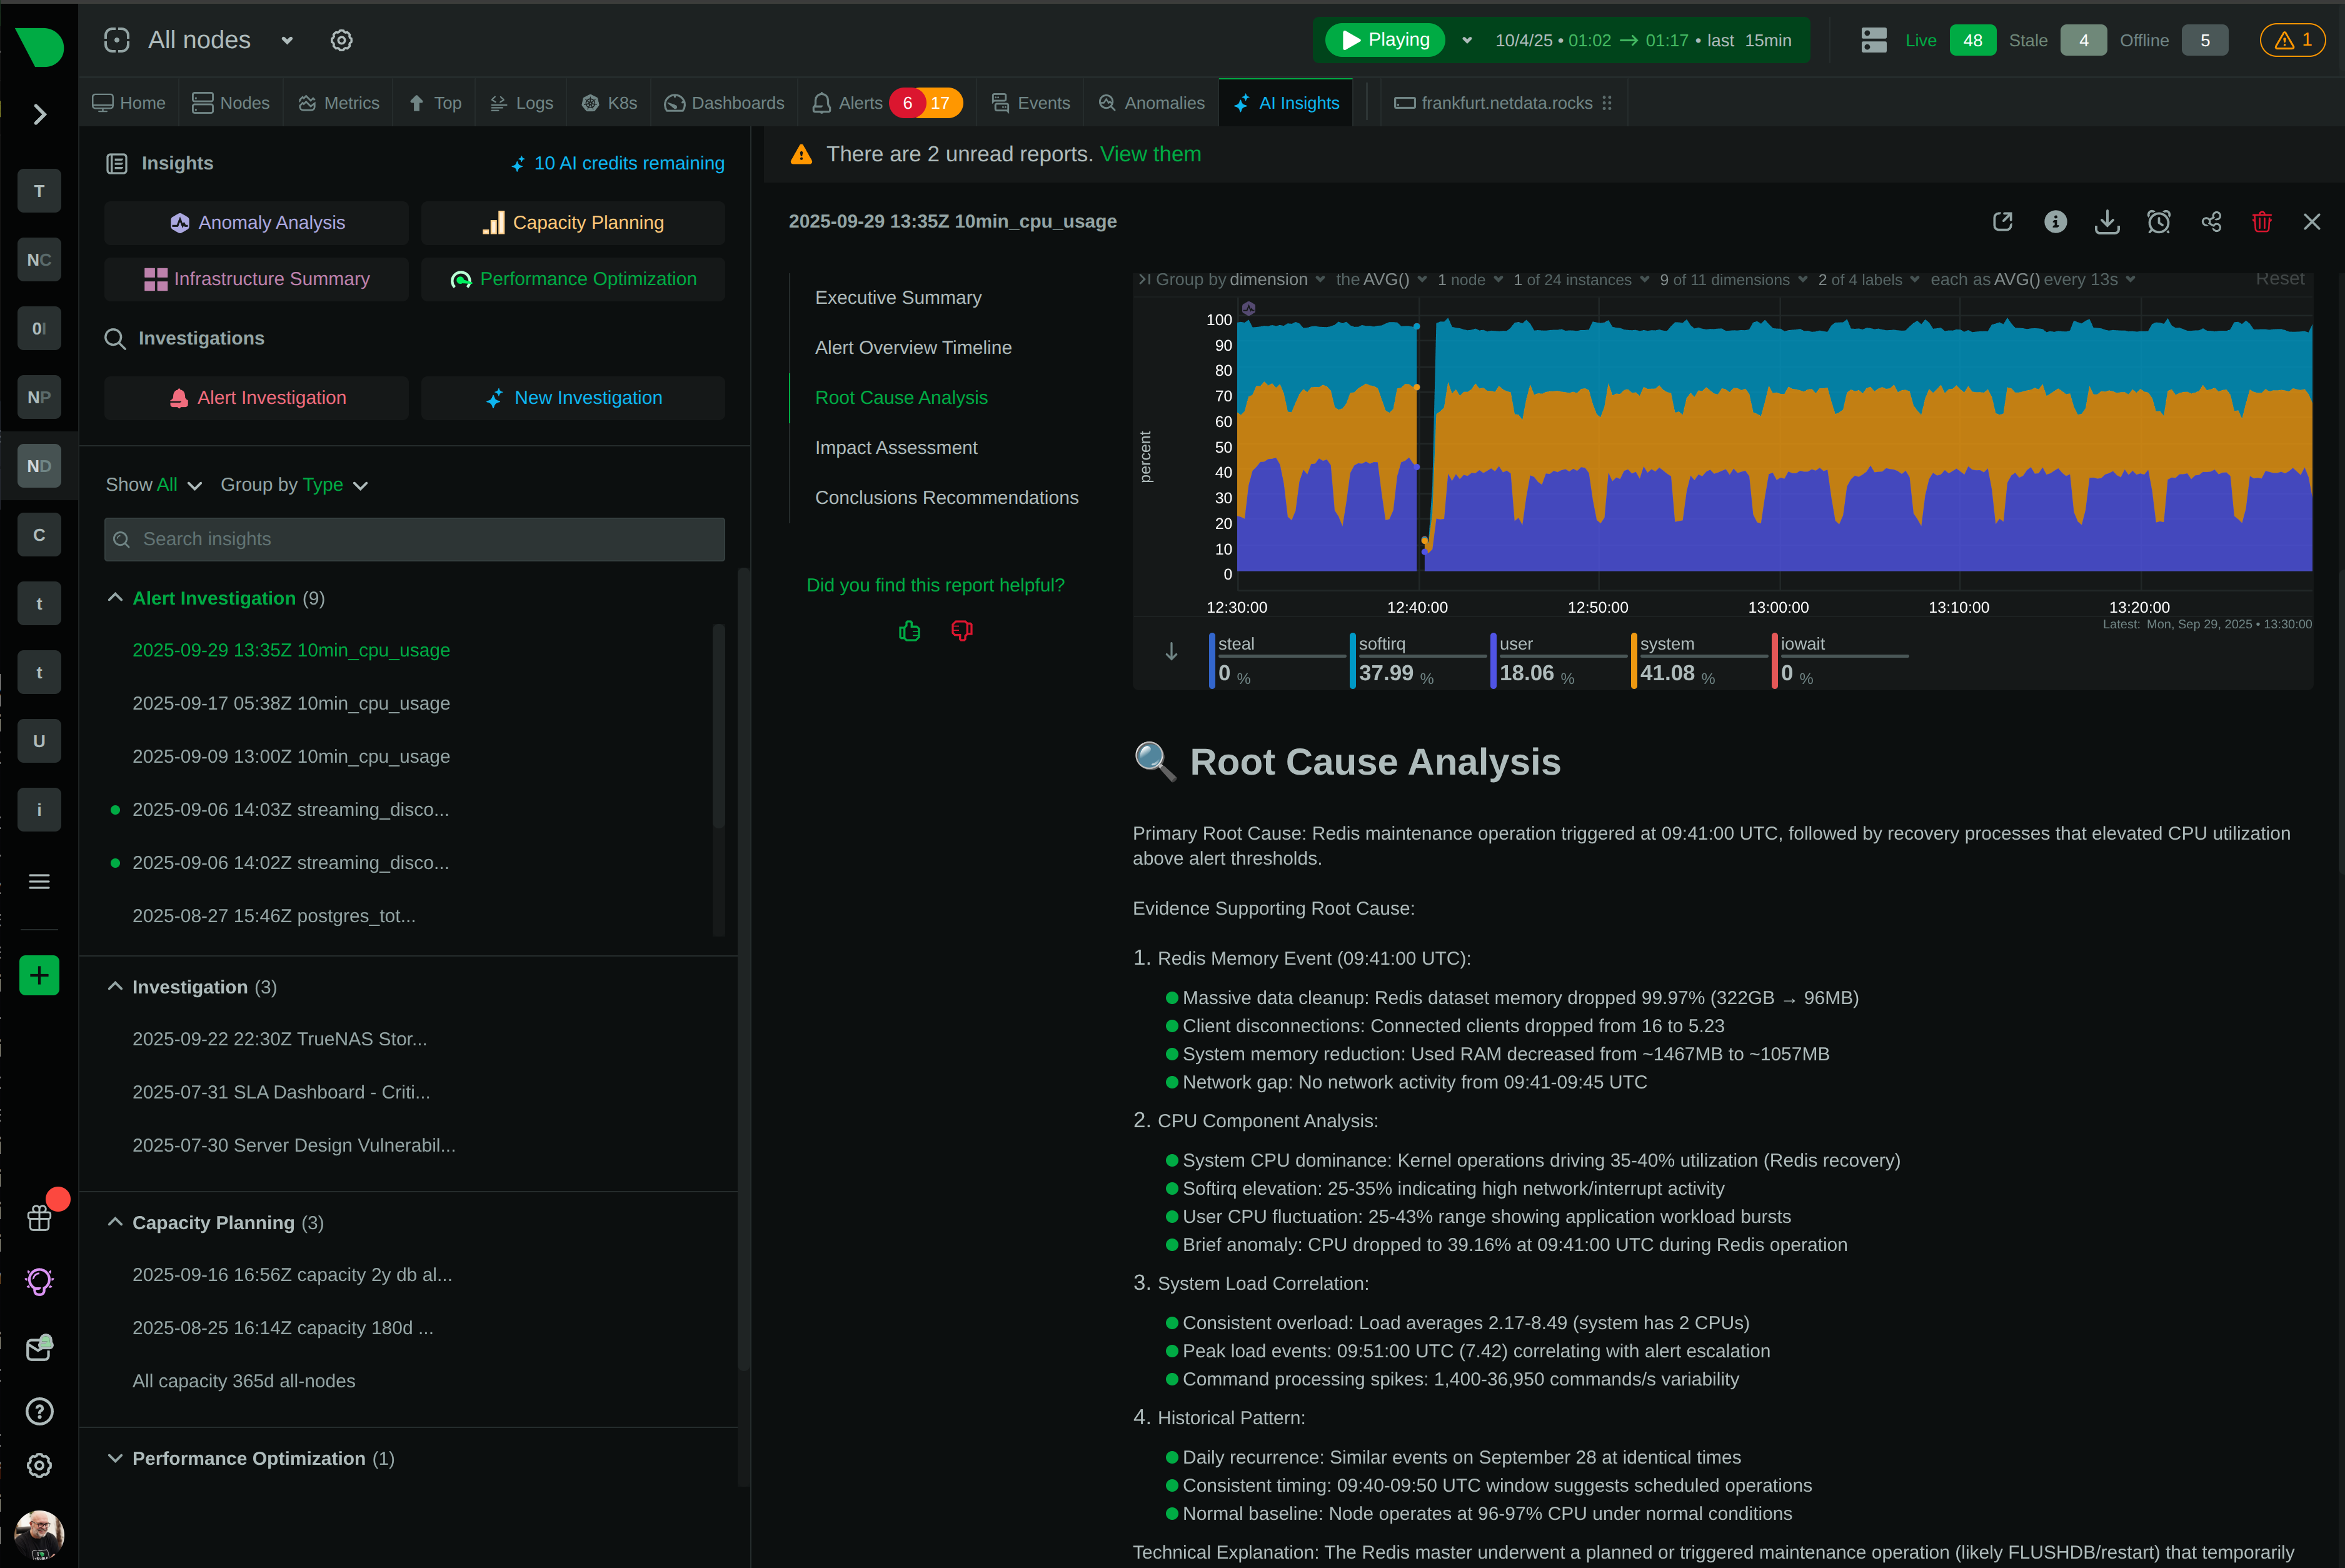
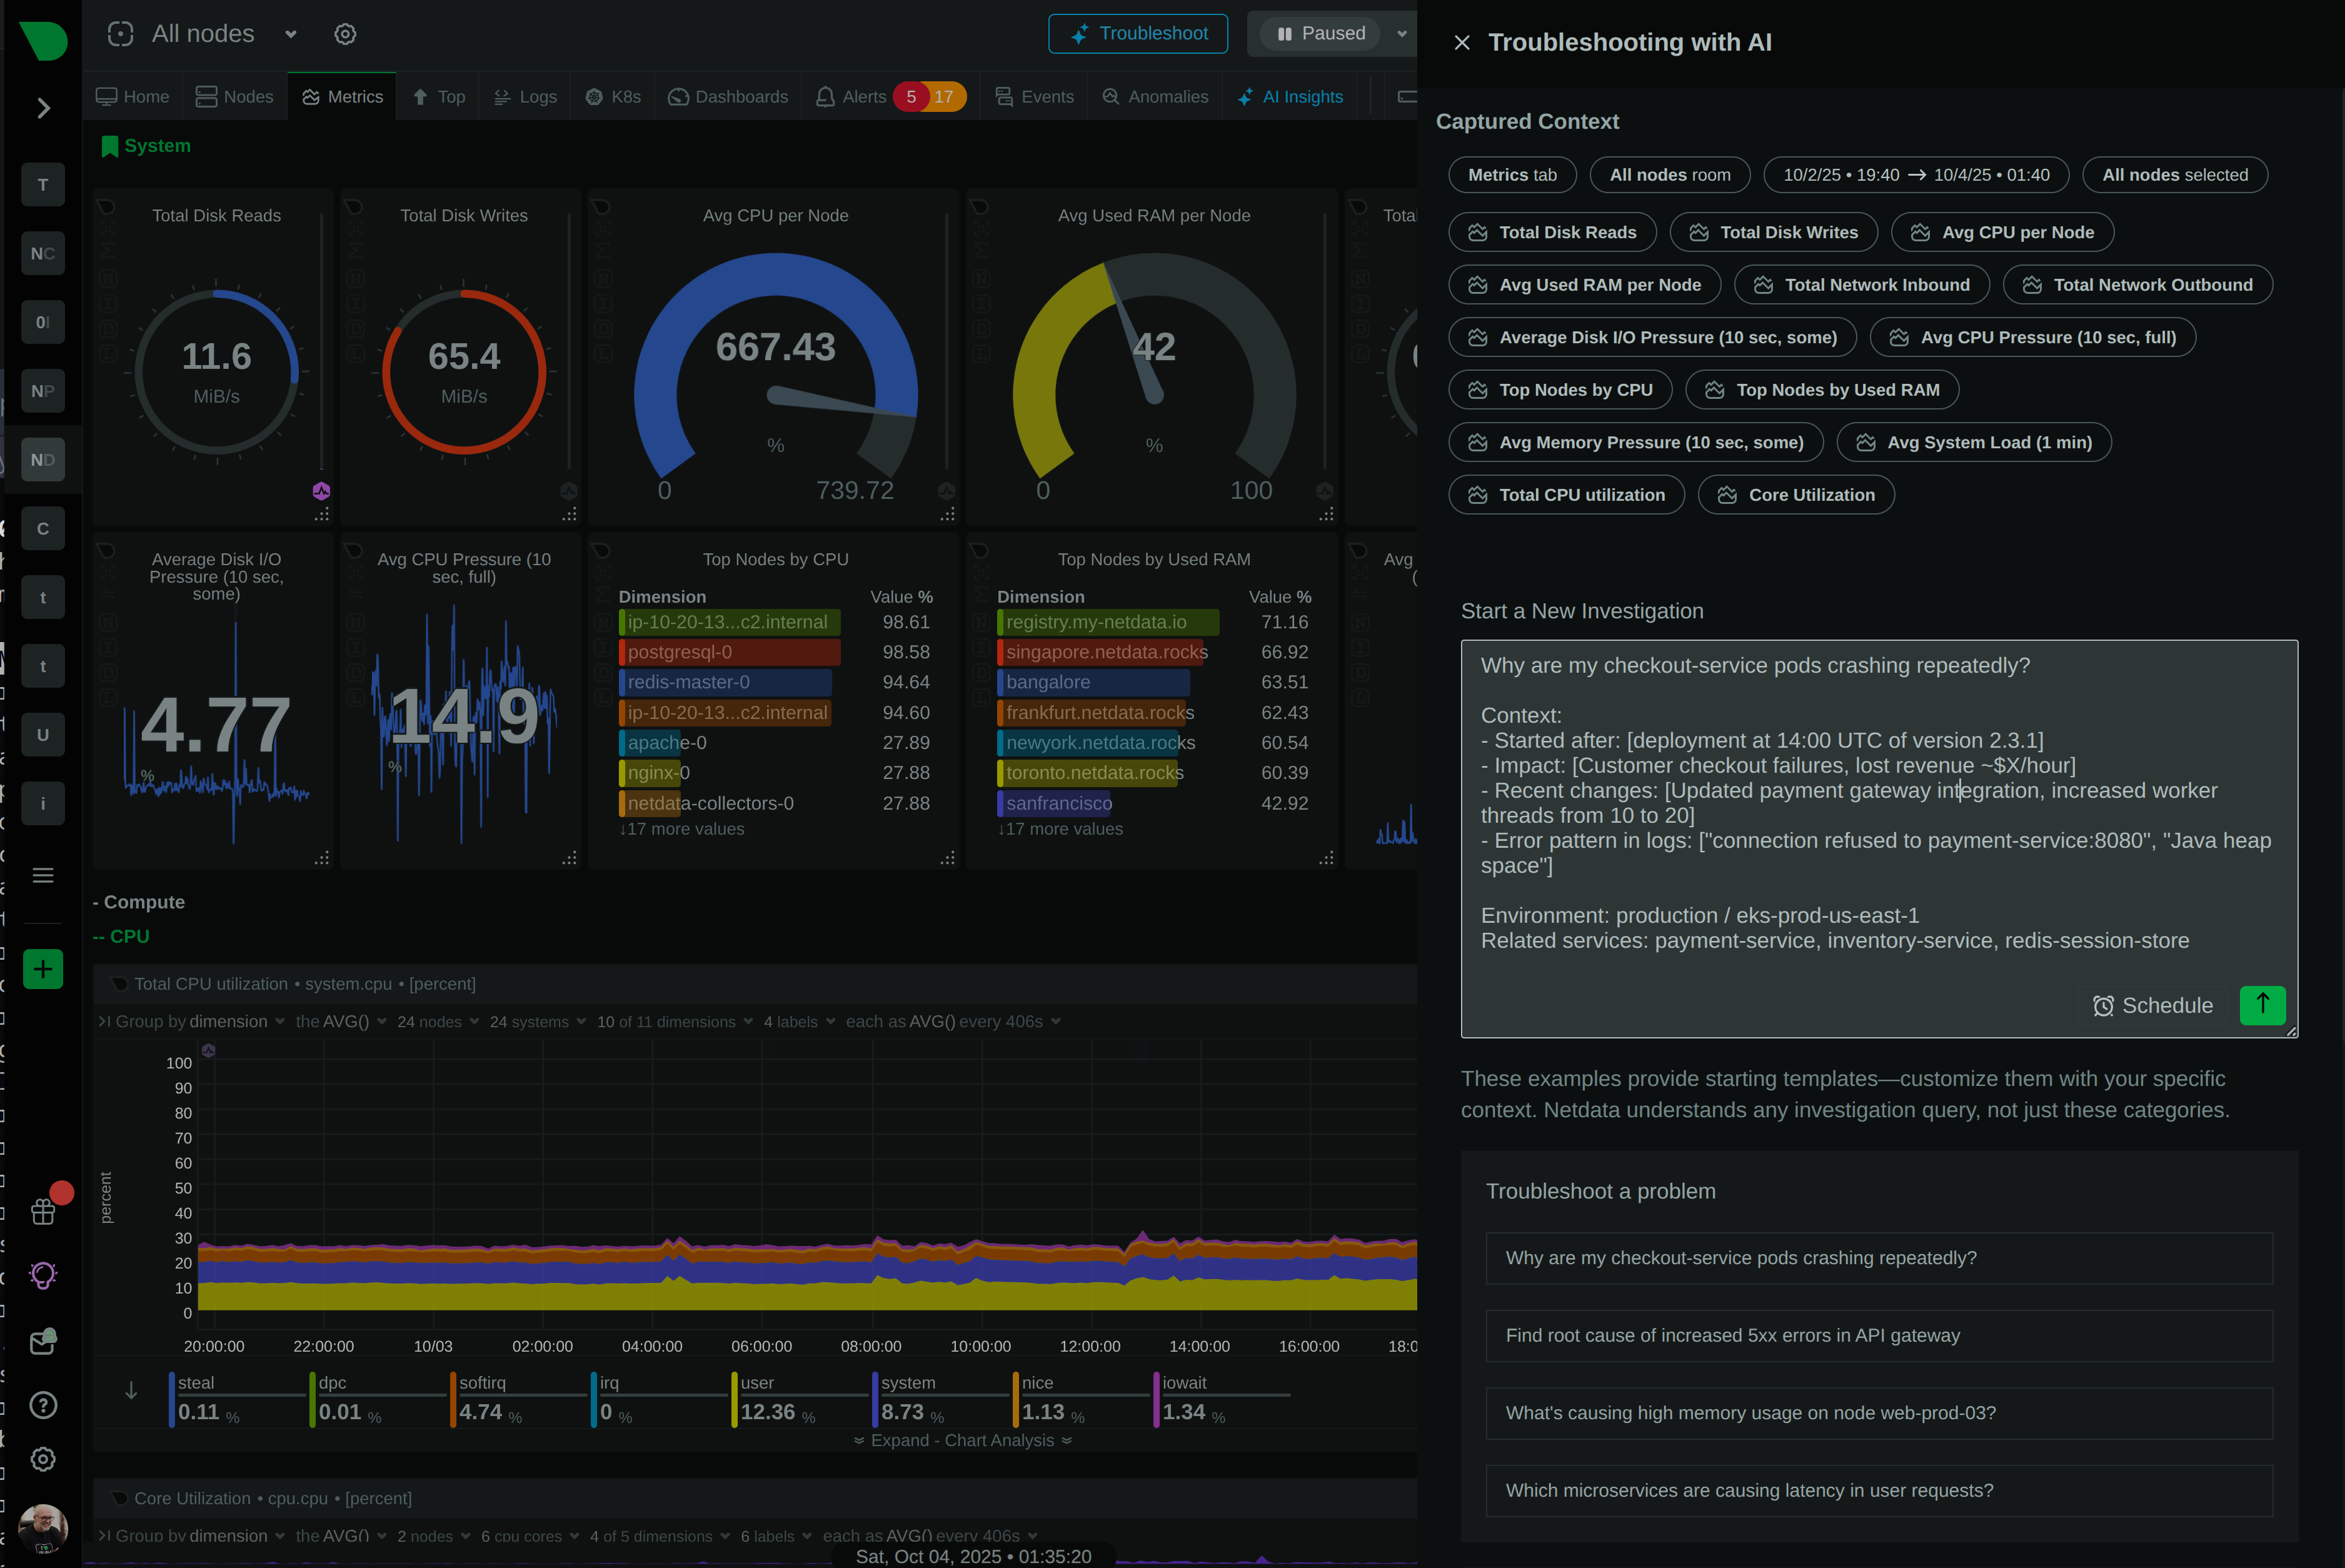
800+ integrations auto-discovered across systems, containers, applications, and cloud platforms. Per-second granularity captures 3,000-20,000 metrics per node with 100% sample completeness - no blind spots from sampling. Algorithmic dashboards adapt automatically to infrastructure changes. Live system state includes processes, network connections, and systemd units - all with history and ML context.
10-60× more granular than standard monitoring
Discover Real-Time Monitoring

