The only agent that thinks for itself

Autonomous Monitoring with self-learning AI built-in, operating independently across your entire stack.

Unlimited Metrics & Logs
Machine learning & MCP
5% CPU, 150MB RAM
3GB disk, >1 year retention
800+ integrations, zero config
Dashboards, alerts out of the box
> Discover Netdata Agents
Centralized metrics streaming and storage

Aggregate metrics from multiple agents into centralized Parent nodes for unified monitoring across your infrastructure.

Stream from unlimited agents
Long-term data retention
High availability clustering
Data replication & backup
Scalable architecture
Enterprise-grade security
> Learn about Parents
Fully managed cloud platform

Access your monitoring data from anywhere with our SaaS platform. No infrastructure to manage, automatic updates, and global availability.

Zero infrastructure management
99.9% uptime SLA
Global data centers
Automatic updates & patches
Enterprise SSO & RBAC
SOC2 & ISO certified
> Explore Netdata Cloud
Deploy Netdata Cloud in your infrastructure

Run the full Netdata Cloud platform on-premises for complete data sovereignty and compliance with your security policies.

Complete data sovereignty
Air-gapped deployment
Custom compliance controls
Private network integration
Dedicated support team
Kubernetes & Docker support
> Learn about Cloud On-Premises
Powerful, intuitive monitoring interface

Modern, responsive UI built for real-time troubleshooting with customizable dashboards and advanced visualization capabilities.

Real-time chart updates
Customizable dashboards
Dark & light themes
Advanced filtering & search
Responsive on all devices
Collaboration features
> Explore Netdata UI
Monitor on the go

Native iOS and Android apps bring full monitoring capabilities to your mobile device with real-time alerts and notifications.

iOS & Android apps
Push notifications
Touch-optimized interface
Offline data access
Biometric authentication
Widget support
> Download apps

Best energy efficiency

True real-time per-second

100% automated zero config

Centralized observability

Multi-year retention

High availability built-in

Zero maintenance

Always up-to-date

Enterprise security

Complete data control

Air-gap ready

Compliance certified

Millisecond responsiveness

Infinite zoom & pan

Works on any device

Native performance

Instant alerts

Monitor anywhere

80% Faster Incident Resolution
AI-powered troubleshooting from detection, to root cause and blast radius identification, to reporting.
True Real-Time and Simple, even at Scale
Linearly and infinitely scalable full-stack observability, that can be deployed even mid-crisis.
90% Cost Reduction, Full Fidelity
Instead of centralizing the data, Netdata distributes the code, eliminating pipelines and complexity.
Control Without Surrender
SOC 2 Type 2 certified with every metric kept on your infrastructure.
Integrations

800+ collectors and notification channels, auto-discovered and ready out of the box.

800+ data collectors
Auto-discovery & zero config
Cloud, infra, app protocols
Notifications out of the box
> Explore integrations
Real Results
46% Cost Reduction

Reduced monitoring costs by 46% while cutting staff overhead by 67%.

— Leonardo Antunez, Codyas

Zero Pipeline

No data shipping. No central storage costs. Query at the edge.

From Our Users
"Out-of-the-Box"

So many out-of-the-box features! I mostly don't have to develop anything.

— Simon Beginn, LANCOM Systems

No Query Language

Point-and-click troubleshooting. No PromQL, no LogQL, no learning curve.

Enterprise Ready
67% Less Staff, 46% Cost Cut

Enterprise efficiency without enterprise complexity—real ROI from day one.

— Leonardo Antunez, Codyas

SOC 2 Type 2 Certified

Zero data egress. Only metadata reaches the cloud. Your metrics stay on your infrastructure.

Full Coverage
800+ Collectors

Auto-discovered and configured. No manual setup required.

Any Notification Channel

Slack, PagerDuty, Teams, email, webhooks—all built-in.

From Our Users
"A Rare Unicorn"

Netdata gives more than you invest in it. A rare unicorn that obeys the Pareto rule.

— Eduard Porquet Mateu, TMB Barcelona

99% Downtime Reduction

Reduced website downtime by 99% and cloud bill by 30% using Netdata alerts.

— Falkland Islands Government

Real Savings
30% Cloud Cost Reduction

Optimized resource allocation based on Netdata alerts cut cloud spending by 30%.

— Falkland Islands Government

46% Cost Cut

Reduced monitoring staff by 67% while cutting operational costs by 46%.

— Codyas

Real Coverage
"Plugin for Everything"

Netdata has agent capacity or a plugin for everything, including Windows and Kubernetes.

— Eduard Porquet Mateu, TMB Barcelona

"Out-of-the-Box"

So many out-of-the-box features! I mostly don't have to develop anything.

— Simon Beginn, LANCOM Systems

Real Speed
Troubleshooting in 30 Seconds

From 2-3 minutes to 30 seconds—instant visibility into any node issue.

— Matthew Artist, Nodecraft

20% Downtime Reduction

20% less downtime and 40% budget optimization from out-of-the-box monitoring.

— Simon Beginn, LANCOM Systems

Pay per Node. Unlimited Everything Else.

One price per node. Unlimited metrics, logs, users, and retention. No per-GB surprises.

Free tier—forever
No metric limits or caps
Retention you control
Cancel anytime
> See pricing plans
What's Your Monitoring Really Costing You?

Most teams overpay by 40-60%. Let's find out why.

Expose hidden metric charges
Calculate tool consolidation
Customers report 30-67% savings
Results in under 60 seconds
> See what you're really paying
Your Infrastructure Is Unique. Let's Talk.

Because monitoring 10 nodes is different from monitoring 10,000.

On-prem & air-gapped deployment
Volume pricing & agreements
Architecture review for your scale
Compliance & security support
> Start a conversation
Monitoring That Sells Itself

Deploy in minutes. Impress clients in hours. Earn recurring revenue for years.

30-second live demos close deals
Zero config = zero support burden
Competitive margins & deal protection
Response in 48 hours
> Apply to partner
Per-Second Metrics at Homelab Prices

Same engine, same dashboards, same ML. Just priced for tinkerers.

Community: Free forever · 5 nodes · non-commercial
Homelab: $90/yr · unlimited nodes · fair usage
> Start monitoring your lab—free
$1,000 Per Referral. Unlimited Referrals.

Your colleagues get 10% off. You get 10% commission. Everyone wins.

10% of subscriptions, up to $1,000 each
Track earnings inside Netdata Cloud
PayPal/Venmo payouts in 3-4 weeks
No caps, no complexity
> Get your referral link
Cost Proof
40% Budget Optimization

"Netdata's significant positive impact" — LANCOM Systems

Calculate Your Savings

Compare vs Datadog, Grafana, Dynatrace

Savings Proof
46% Cost Reduction

"Cut costs by 46%, staff by 67%" — Codyas

30% Cloud Bill Savings

"Reduced cloud bill by 30%" — Falkland Islands Gov

Enterprise Proof
"Better Than Combined Alternatives"

"Better observability with Netdata than combining other tools." — TMB Barcelona

Real Engineers, <24h Response

DPA, SLAs, on-prem, volume pricing

Why Partners Win
Demo Live Infrastructure

One command, 30 seconds, real data—no sandbox needed

Zero Tickets, High Margins

Auto-config + per-node pricing = predictable profit

Homelab Ready
"Absolutely Incredible"

"We tested every monitoring system under the sun." — Benjamin Gabler, CEO Rocket.Net

76k+ GitHub Stars

3rd most starred monitoring project

Worth Recommending
Product That Delivers

Customers report 40-67% cost cuts, 99% downtime reduction

Zero Risk to Your Rep

Free tier lets them try before they buy

Never Fight Fires Alone

Docs, community, and expert help—pick your path to resolution.

Learn.netdata.cloud docs
Discord, Forums, GitHub
Premium support available
> Get answers now
60 Seconds to First Dashboard

One command to install. Zero config. 850+ integrations documented.

Linux, Windows, K8s, Docker
Auto-discovers your stack
> Start monitoring now
See Netdata in Action

Watch real-time monitoring in action—demos, tutorials, and engineering deep dives.

Product demos and walkthroughs
Real infrastructure, not staged
> Start with the 3-minute tour
Level Up Your Monitoring
Real problems. Real solutions. 112+ guides from basic monitoring to AI observability.
76,000+ Engineers Strong
615+ contributors. 1.5M daily downloads. One mission: simplify observability.
Per-Second. 90% Cheaper. Data Stays Home.
Side-by-side comparisons: costs, real-time granularity, and data sovereignty for every major tool.

See why teams switch from Datadog, Prometheus, Grafana, and more.

> Browse all comparisons
Edge-Native Observability, Born Open Source
Per-second visibility, ML on every metric, and data that never leaves your infrastructure.
Founded in 2016
615+ contributors worldwide
Remote-first, engineering-driven
Open source first
> Read our story
Promises We Publish—and Prove
12 principles backed by open code, independent validation, and measurable outcomes.
Open source, peer-reviewed
Zero config, instant value
Data sovereignty by design
Aligned pricing, no surprises
> See all 12 principles
Edge-Native, AI-Ready, 100% Open
76k+ stars. Full ML, AI, and automation—GPLv3+, not premium add-ons.
76,000+ GitHub stars
GPLv3+ licensed forever
ML on every metric, included
Zero vendor lock-in
> Explore our open source
Build Real-Time Observability for the World
Remote-first team shipping per-second monitoring with ML on every metric.
Remote-first, fully distributed
Open source (76k+ stars)
Challenging technical problems
Your code on millions of systems
> See open roles
Talk to a Netdata Human in <24 Hours
Sales, partnerships, press, or professional services—real engineers, fast answers.
Discuss your observability needs
Pricing and volume discounts
Partnership opportunities
Media and press inquiries
> Book a conversation
Your Data. Your Rules.
On-prem data, cloud control plane, transparent terms.
Trust & Scale
76,000+ GitHub Stars

One of the most popular open-source monitoring projects

SOC 2 Type 2 Certified

Enterprise-grade security and compliance

Data Sovereignty

Your metrics stay on your infrastructure

Validated
University of Amsterdam

"Most energy-efficient monitoring solution" — ICSOC 2023, peer-reviewed

ADASTEC (Autonomous Driving)

"Doesn't miss alerts—mission-critical trust for safety software"

Community Stats
615+ Contributors

Global community improving monitoring for everyone

1.5M+ Downloads/Day

Trusted by teams worldwide

GPLv3+ Licensed

Free forever, fully open source agent

Why Join?
Remote-First

Work from anywhere, async-friendly culture

Impact at Scale

Your work helps millions of systems

Compliance
SOC 2 Type 2

Audited security controls

GDPR Ready

Data stays on your infrastructure

Anomaly Advisor

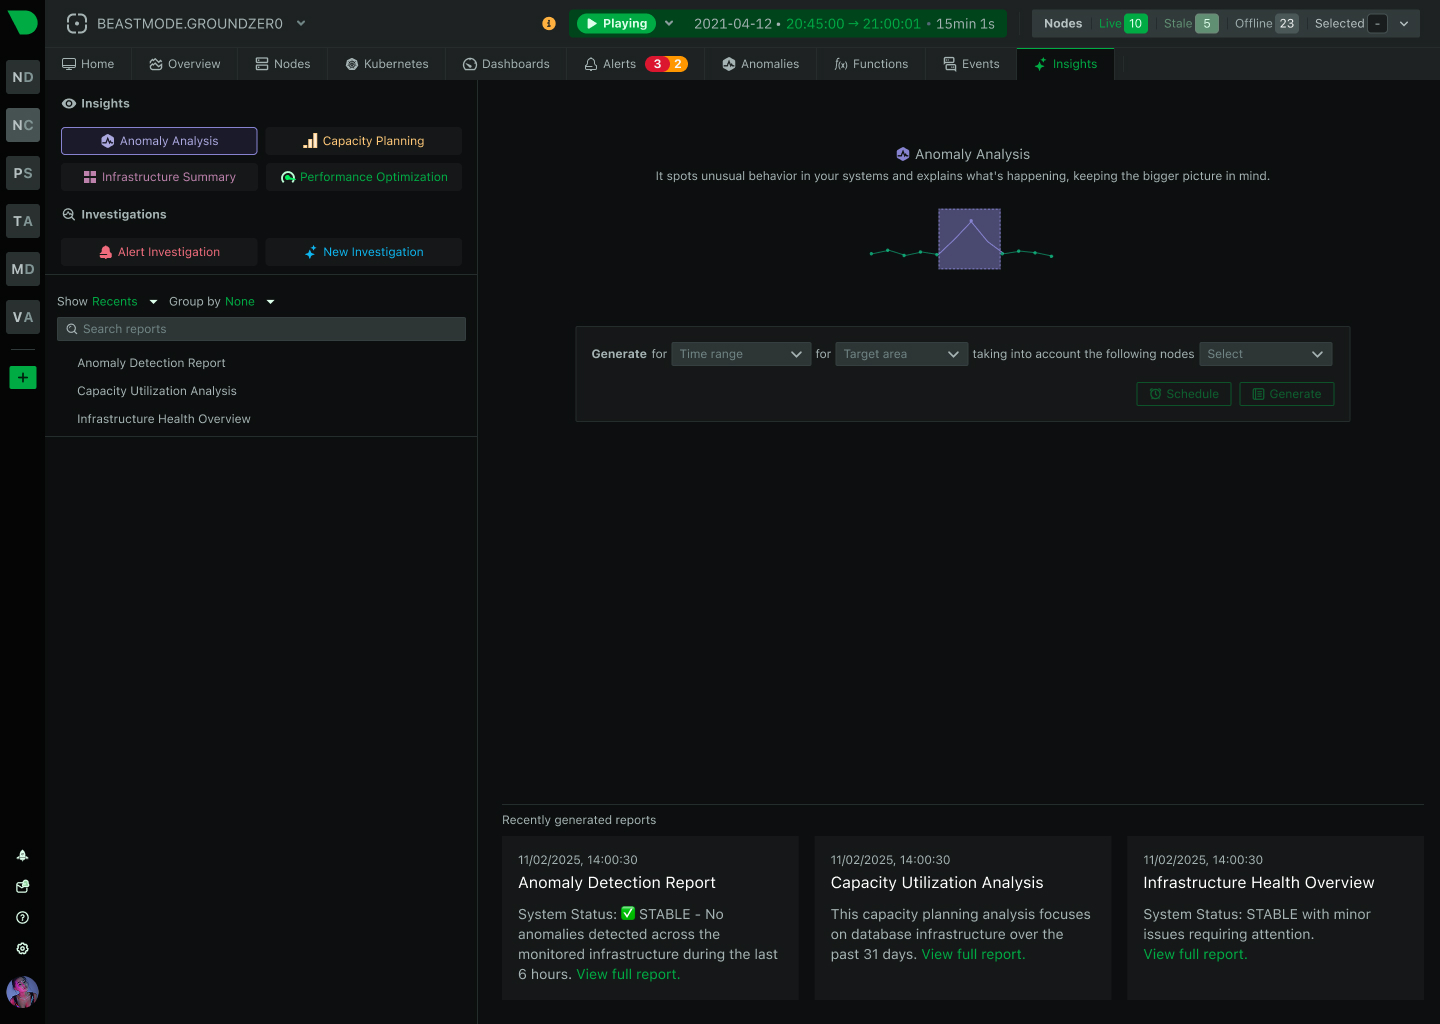
Surface Root Causes in Seconds, Not Hours

Edge-native machine learning with 18-model consensus delivers 99% false positive reduction in anomaly detection and sub-2-second correlation analysis across thousands of metrics - transforming hours of manual investigation into instant insights without configuration or specialist expertise.

Background Hero

Intelligence That Transforms Troubleshooting

Six breakthrough capabilities that redefine infrastructure analysis

18-Model Consensus

Unanimous agreement across 18 independent ML models achieves 99% false positive reduction in anomaly detection - delivering accurate signals while filtering noise.

Sub-2-Second Analysis

Edge-native processing evaluates thousands of metrics simultaneously and returns ranked results in seconds - maintaining consistent performance from 1 to 100,000+ nodes.

Automated Correlation

Discover hidden relationships across all metrics automatically - revealing cascading failures and blast radius without manual rules or configuration.

Root Cause Ranking

Scoring engine surfaces root causes in top 30-50 results from thousands of metrics - transforming hours of investigation into minutes of discovery.

Per-Second Precision

60× more training samples than minute-level monitoring enables detection of transient anomalies invisible to traditional tools - capturing exact incident timelines.

Zero Configuration

Works identically across heterogeneous infrastructure without threshold tuning or algorithm selection - first ML detection within 15 minutes, full confidence within 48 hours.

Trusted by operations teams managing critical infrastructure worldwide

Accelerate Resolution Through Intelligent Analysis

Accurate Anomaly Detection Through Consensus Intelligence

Traditional anomaly detection produces overwhelming noise with high false positive rates, forcing teams to ignore or disable alerting. Netdata’s 18-model consensus architecture flags anomalies only when all models unanimously agree - achieving 99% false positive reduction in anomaly detection. This provides engineers with an additional high-confidence signal to complement traditional threshold-based alerts, helping identify unusual patterns that warrant investigation.

99% false positive reduction

Learn About ML Architecture

Accurate Anomaly Detection Through Consensus Intelligence

Discover Root Causes in Minutes Instead of Hours

Engineers manually investigating across fragmented tools waste hours correlating data during incidents. Anomaly Advisor’s scoring engine evaluates thousands of metrics simultaneously during highlighted incident timeframes, comparing anomaly rates to baseline and returning ranked results by correlation strength. Root causes typically surface in top 30-50 results - validated by Nodecraft achieving 30-second detection versus 2-3 minutes previously, representing 6× faster resolution.

80% MTTR reduction

See Troubleshooting in Action

Discover Root Causes in Minutes Instead of Hours

Catch Transient Issues Before They Cascade

Most operational anomalies last 2-10 seconds - CPU microbursts, network saturation events, memory allocation spikes - yet traditional 30-second monitoring misses 90% of these incidents. Netdata’s per-second data collection provides 60× more ML training samples per 6-hour window compared to minute-level monitoring, enabling detection of transient anomalies invisible to competitors. Exact incident timelines with per-second precision reveal cascading failure sequences, allowing teams to prevent escalation.

60× more training samples

Explore Real-Time Monitoring

Catch Transient Issues Before They Cascade

Empower Every Engineer With Expert-Level Analysis

Complex monitoring tools requiring specialized expertise create bottlenecks when only senior engineers can troubleshoot effectively. Anomaly Advisor eliminates expertise barriers through zero-configuration operation - no query languages, no manual correlation rules, no threshold tuning required. Junior engineers achieve senior-level troubleshooting effectiveness immediately, accelerating new hire productivity from weeks to hours while providing automated intelligence accessible to engineers at any experience level.

Zero learning curve

See Zero-Configuration Benefits

Empower Every Engineer With Expert-Level Analysis

Scale Analysis Without Performance Degradation

Centralized monitoring systems create bottlenecks as infrastructure grows, with query performance degrading exponentially under load. Netdata’s distributed edge-native architecture processes anomaly detection locally on each monitored node, maintaining sub-2-second latency whether analyzing 1 node or 100,000+ nodes. Adding infrastructure adds observability capacity without affecting existing performance - validated by Netdata benchmark processing 4.6 million metrics per second using only 9.4 CPU cores and 47GB RAM.

Linear scalability

Understand Distributed Architecture

Scale Analysis Without Performance Degradation

Maintain Complete Data Sovereignty

Compliance-sensitive organizations face barriers when observability tools require streaming sensitive data to external clouds for ML processing. Netdata’s edge-native architecture performs all ML computation locally on monitored nodes - observability data never leaves your infrastructure, only metadata streams to Netdata Cloud for unified dashboards. This design satisfies GDPR, HIPAA, PCI DSS, and regional data residency requirements automatically while eliminating data egress costs.

Zero data egress

Learn About Data Sovereignty

Maintain Complete Data Sovereignty

How Anomaly Advisor Compares

Intelligent Analysis Without Complexity

Traditional anomaly detection requires extensive configuration, produces overwhelming noise, and misses transient issues with minute-level sampling. Netdata’s edge-native approach delivers superior accuracy and speed without expertise barriers.

Capability

Netdata Anomaly Advisor

Traditional Monitoring

False Positive Rate

✅ Ideal
18-model consensus achieves 99% reduction

⚠️ Limited
Single-model or threshold-based detection

Time to Root Cause

✅ Seconds
Automated correlation across thousands of metrics

❌ Hours
Manual investigation across fragmented tools

Configuration Required

✅ Zero
Works identically across all infrastructure

⚠️ Extensive
Algorithm selection, threshold tuning, baseline training

Data Granularity

✅ Per-Second
60× more training samples than per-minute

⚠️ Per-Minute
Misses transient issues through averaging

Detection Latency

✅ Sub-2-Seconds
Edge-native processing eliminates delays

⚠️ 20-90 Seconds
Cloud-based processing adds latency

Time to First Detection

✅ 15 Minutes
Full confidence within 48 hours

⚠️ Multi-Week
Extended baseline training period

Scalability

✅ Linear
Consistent performance 1-100K+ nodes

⚠️ Challenging
Centralized bottlenecks degrade performance

Expertise Required

✅ None
Junior engineers effective immediately

⚠️ Specialized Skills
Query languages, ML tuning, correlation rules

Data Sovereignty

✅ Complete
All ML computation local to your infrastructure

❌ Cloud-Dependent
Data streams externally for processing

See Full Feature Comparison

How Anomaly Advisor Works

Unanimous Agreement Filters Noise

Each metric monitored by 18 independent k-means models trained on 6-hour windows at 3-hour intervals. Anomaly flagged only when all models unanimously agree - achieving theoretical 10^-36 false positive rate per metric.

99% false positive reduction in anomaly detection

Learn ML Architecture
18-Model Consensus Dashboard

Key Capabilities That Transform Operations

Six breakthrough features that accelerate troubleshooting through intelligent analysis

Frequently Asked Questions