The only agent that thinks for itself

Autonomous Monitoring with self-learning AI built-in, operating independently across your entire stack.

Unlimited Metrics & Logs
Machine learning & MCP
5% CPU, 150MB RAM
3GB disk, >1 year retention
800+ integrations, zero config
Dashboards, alerts out of the box
> Discover Netdata Agents
Centralized metrics streaming and storage

Aggregate metrics from multiple agents into centralized Parent nodes for unified monitoring across your infrastructure.

Stream from unlimited agents
Long-term data retention
High availability clustering
Data replication & backup
Scalable architecture
Enterprise-grade security
> Learn about Parents
Fully managed cloud platform

Access your monitoring data from anywhere with our SaaS platform. No infrastructure to manage, automatic updates, and global availability.

Zero infrastructure management
99.9% uptime SLA
Global data centers
Automatic updates & patches
Enterprise SSO & RBAC
SOC2 & ISO certified
> Explore Netdata Cloud
Deploy Netdata Cloud in your infrastructure

Run the full Netdata Cloud platform on-premises for complete data sovereignty and compliance with your security policies.

Complete data sovereignty
Air-gapped deployment
Custom compliance controls
Private network integration
Dedicated support team
Kubernetes & Docker support
> Learn about Cloud On-Premises
Powerful, intuitive monitoring interface

Modern, responsive UI built for real-time troubleshooting with customizable dashboards and advanced visualization capabilities.

Real-time chart updates
Customizable dashboards
Dark & light themes
Advanced filtering & search
Responsive on all devices
Collaboration features
> Explore Netdata UI
Monitor on the go

Native iOS and Android apps bring full monitoring capabilities to your mobile device with real-time alerts and notifications.

iOS & Android apps
Push notifications
Touch-optimized interface
Offline data access
Biometric authentication
Widget support
> Download apps

Best energy efficiency

True real-time per-second

100% automated zero config

Centralized observability

Multi-year retention

High availability built-in

Zero maintenance

Always up-to-date

Enterprise security

Complete data control

Air-gap ready

Compliance certified

Millisecond responsiveness

Infinite zoom & pan

Works on any device

Native performance

Instant alerts

Monitor anywhere

80% Faster Incident Resolution
AI-powered troubleshooting from detection, to root cause and blast radius identification, to reporting.
True Real-Time and Simple, even at Scale
Linearly and infinitely scalable full-stack observability, that can be deployed even mid-crisis.
90% Cost Reduction, Full Fidelity
Instead of centralizing the data, Netdata distributes the code, eliminating pipelines and complexity.
Control Without Surrender
SOC 2 Type 2 certified with every metric kept on your infrastructure.
Integrations

800+ collectors and notification channels, auto-discovered and ready out of the box.

800+ data collectors
Auto-discovery & zero config
Cloud, infra, app protocols
Notifications out of the box
> Explore integrations
Real Results
46% Cost Reduction

Reduced monitoring costs by 46% while cutting staff overhead by 67%.

— Leonardo Antunez, Codyas

Zero Pipeline

No data shipping. No central storage costs. Query at the edge.

From Our Users
"Out-of-the-Box"

So many out-of-the-box features! I mostly don't have to develop anything.

— Simon Beginn, LANCOM Systems

No Query Language

Point-and-click troubleshooting. No PromQL, no LogQL, no learning curve.

Enterprise Ready
67% Less Staff, 46% Cost Cut

Enterprise efficiency without enterprise complexity—real ROI from day one.

— Leonardo Antunez, Codyas

SOC 2 Type 2 Certified

Zero data egress. Only metadata reaches the cloud. Your metrics stay on your infrastructure.

Full Coverage
800+ Collectors

Auto-discovered and configured. No manual setup required.

Any Notification Channel

Slack, PagerDuty, Teams, email, webhooks—all built-in.

From Our Users
"A Rare Unicorn"

Netdata gives more than you invest in it. A rare unicorn that obeys the Pareto rule.

— Eduard Porquet Mateu, TMB Barcelona

99% Downtime Reduction

Reduced website downtime by 99% and cloud bill by 30% using Netdata alerts.

— Falkland Islands Government

Real Savings
30% Cloud Cost Reduction

Optimized resource allocation based on Netdata alerts cut cloud spending by 30%.

— Falkland Islands Government

46% Cost Cut

Reduced monitoring staff by 67% while cutting operational costs by 46%.

— Codyas

Real Coverage
"Plugin for Everything"

Netdata has agent capacity or a plugin for everything, including Windows and Kubernetes.

— Eduard Porquet Mateu, TMB Barcelona

"Out-of-the-Box"

So many out-of-the-box features! I mostly don't have to develop anything.

— Simon Beginn, LANCOM Systems

Real Speed
Troubleshooting in 30 Seconds

From 2-3 minutes to 30 seconds—instant visibility into any node issue.

— Matthew Artist, Nodecraft

20% Downtime Reduction

20% less downtime and 40% budget optimization from out-of-the-box monitoring.

— Simon Beginn, LANCOM Systems

Pay per Node. Unlimited Everything Else.

One price per node. Unlimited metrics, logs, users, and retention. No per-GB surprises.

Free tier—forever
No metric limits or caps
Retention you control
Cancel anytime
> See pricing plans
What's Your Monitoring Really Costing You?

Most teams overpay by 40-60%. Let's find out why.

Expose hidden metric charges
Calculate tool consolidation
Customers report 30-67% savings
Results in under 60 seconds
> See what you're really paying
Your Infrastructure Is Unique. Let's Talk.

Because monitoring 10 nodes is different from monitoring 10,000.

On-prem & air-gapped deployment
Volume pricing & agreements
Architecture review for your scale
Compliance & security support
> Start a conversation
Monitoring That Sells Itself

Deploy in minutes. Impress clients in hours. Earn recurring revenue for years.

30-second live demos close deals
Zero config = zero support burden
Competitive margins & deal protection
Response in 48 hours
> Apply to partner
Per-Second Metrics at Homelab Prices

Same engine, same dashboards, same ML. Just priced for tinkerers.

Community: Free forever · 5 nodes · non-commercial
Homelab: $90/yr · unlimited nodes · fair usage
> Start monitoring your lab—free
$1,000 Per Referral. Unlimited Referrals.

Your colleagues get 10% off. You get 10% commission. Everyone wins.

10% of subscriptions, up to $1,000 each
Track earnings inside Netdata Cloud
PayPal/Venmo payouts in 3-4 weeks
No caps, no complexity
> Get your referral link
Cost Proof
40% Budget Optimization

"Netdata's significant positive impact" — LANCOM Systems

Calculate Your Savings

Compare vs Datadog, Grafana, Dynatrace

Savings Proof
46% Cost Reduction

"Cut costs by 46%, staff by 67%" — Codyas

30% Cloud Bill Savings

"Reduced cloud bill by 30%" — Falkland Islands Gov

Enterprise Proof
"Better Than Combined Alternatives"

"Better observability with Netdata than combining other tools." — TMB Barcelona

Real Engineers, <24h Response

DPA, SLAs, on-prem, volume pricing

Why Partners Win
Demo Live Infrastructure

One command, 30 seconds, real data—no sandbox needed

Zero Tickets, High Margins

Auto-config + per-node pricing = predictable profit

Homelab Ready
"Absolutely Incredible"

"We tested every monitoring system under the sun." — Benjamin Gabler, CEO Rocket.Net

76k+ GitHub Stars

3rd most starred monitoring project

Worth Recommending
Product That Delivers

Customers report 40-67% cost cuts, 99% downtime reduction

Zero Risk to Your Rep

Free tier lets them try before they buy

Never Fight Fires Alone

Docs, community, and expert help—pick your path to resolution.

Learn.netdata.cloud docs
Discord, Forums, GitHub
Premium support available
> Get answers now
60 Seconds to First Dashboard

One command to install. Zero config. 850+ integrations documented.

Linux, Windows, K8s, Docker
Auto-discovers your stack
> Start monitoring now
See Netdata in Action

Watch real-time monitoring in action—demos, tutorials, and engineering deep dives.

Product demos and walkthroughs
Real infrastructure, not staged
> Start with the 3-minute tour
Level Up Your Monitoring
Real problems. Real solutions. 112+ guides from basic monitoring to AI observability.
76,000+ Engineers Strong
615+ contributors. 1.5M daily downloads. One mission: simplify observability.
Per-Second. 90% Cheaper. Data Stays Home.
Side-by-side comparisons: costs, real-time granularity, and data sovereignty for every major tool.

See why teams switch from Datadog, Prometheus, Grafana, and more.

> Browse all comparisons
Edge-Native Observability, Born Open Source
Per-second visibility, ML on every metric, and data that never leaves your infrastructure.
Founded in 2016
615+ contributors worldwide
Remote-first, engineering-driven
Open source first
> Read our story
Promises We Publish—and Prove
12 principles backed by open code, independent validation, and measurable outcomes.
Open source, peer-reviewed
Zero config, instant value
Data sovereignty by design
Aligned pricing, no surprises
> See all 12 principles
Edge-Native, AI-Ready, 100% Open
76k+ stars. Full ML, AI, and automation—GPLv3+, not premium add-ons.
76,000+ GitHub stars
GPLv3+ licensed forever
ML on every metric, included
Zero vendor lock-in
> Explore our open source
Build Real-Time Observability for the World
Remote-first team shipping per-second monitoring with ML on every metric.
Remote-first, fully distributed
Open source (76k+ stars)
Challenging technical problems
Your code on millions of systems
> See open roles
Talk to a Netdata Human in <24 Hours
Sales, partnerships, press, or professional services—real engineers, fast answers.
Discuss your observability needs
Pricing and volume discounts
Partnership opportunities
Media and press inquiries
> Book a conversation
Your Data. Your Rules.
On-prem data, cloud control plane, transparent terms.
Trust & Scale
76,000+ GitHub Stars

One of the most popular open-source monitoring projects

SOC 2 Type 2 Certified

Enterprise-grade security and compliance

Data Sovereignty

Your metrics stay on your infrastructure

Validated
University of Amsterdam

"Most energy-efficient monitoring solution" — ICSOC 2023, peer-reviewed

ADASTEC (Autonomous Driving)

"Doesn't miss alerts—mission-critical trust for safety software"

Community Stats
615+ Contributors

Global community improving monitoring for everyone

1.5M+ Downloads/Day

Trusted by teams worldwide

GPLv3+ Licensed

Free forever, fully open source agent

Why Join?
Remote-First

Work from anywhere, async-friendly culture

Impact at Scale

Your work helps millions of systems

Compliance
SOC 2 Type 2

Audited security controls

GDPR Ready

Data stays on your infrastructure

AI Reporting

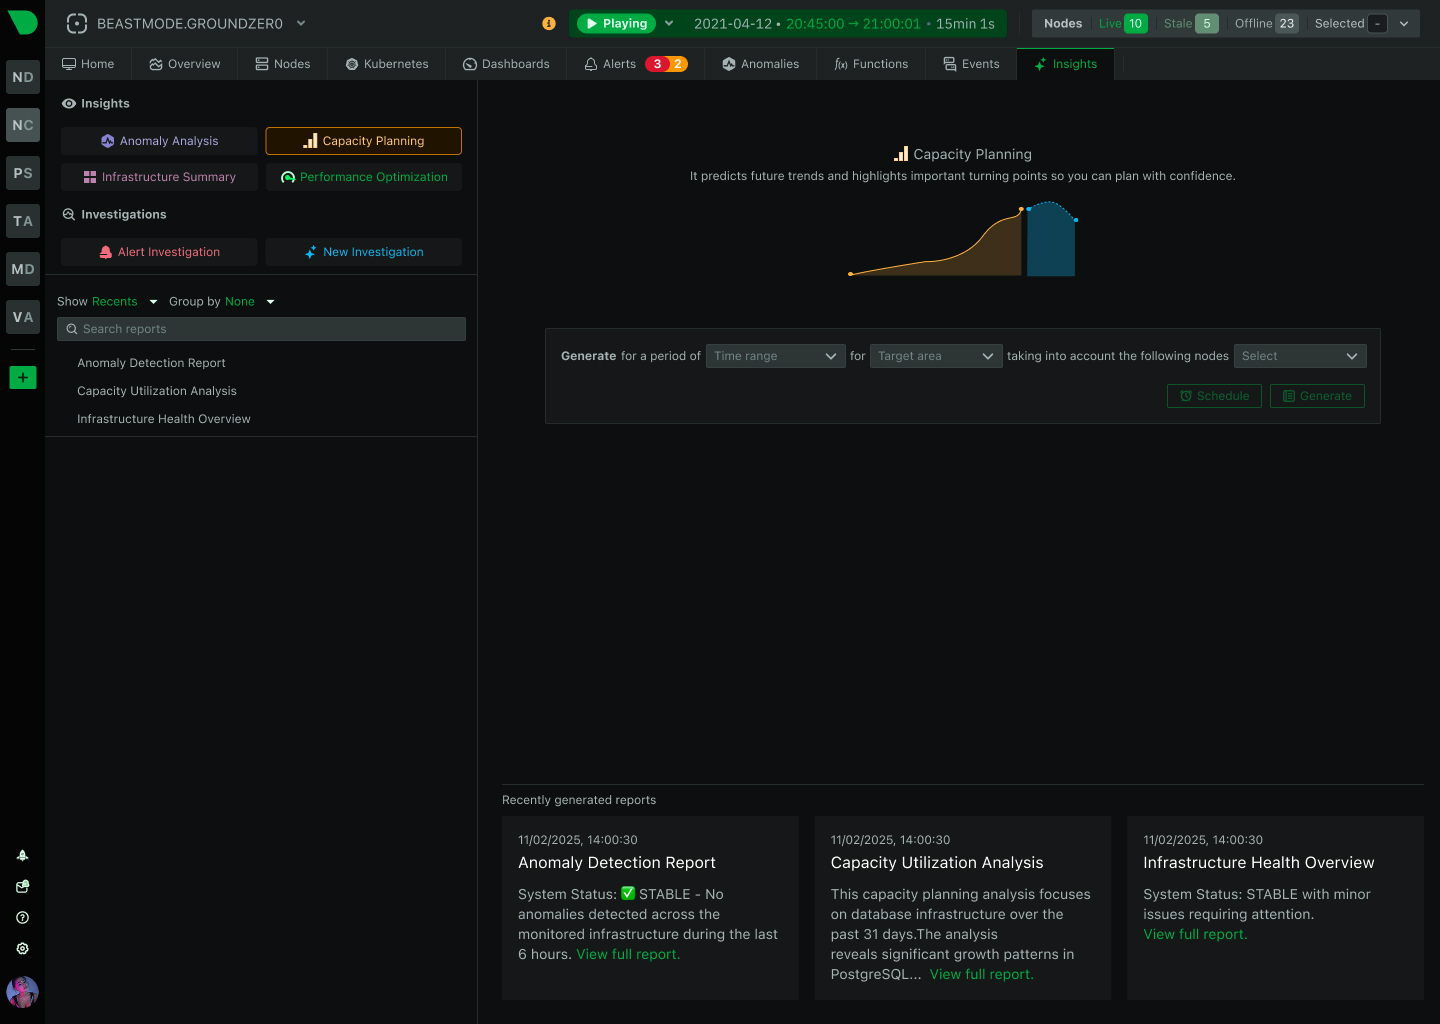
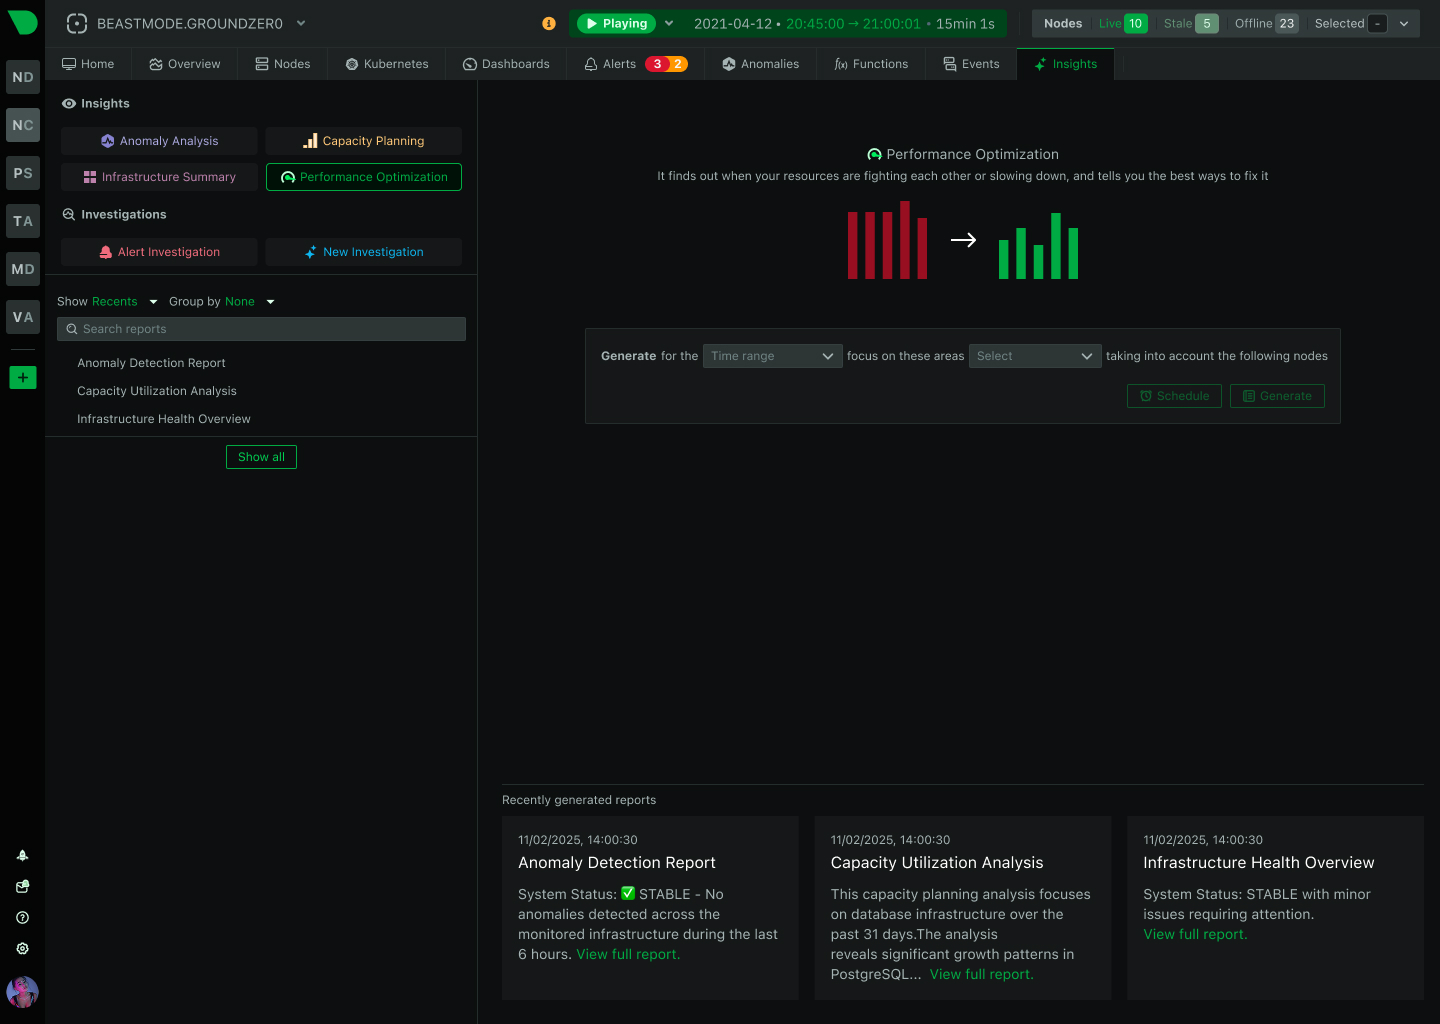
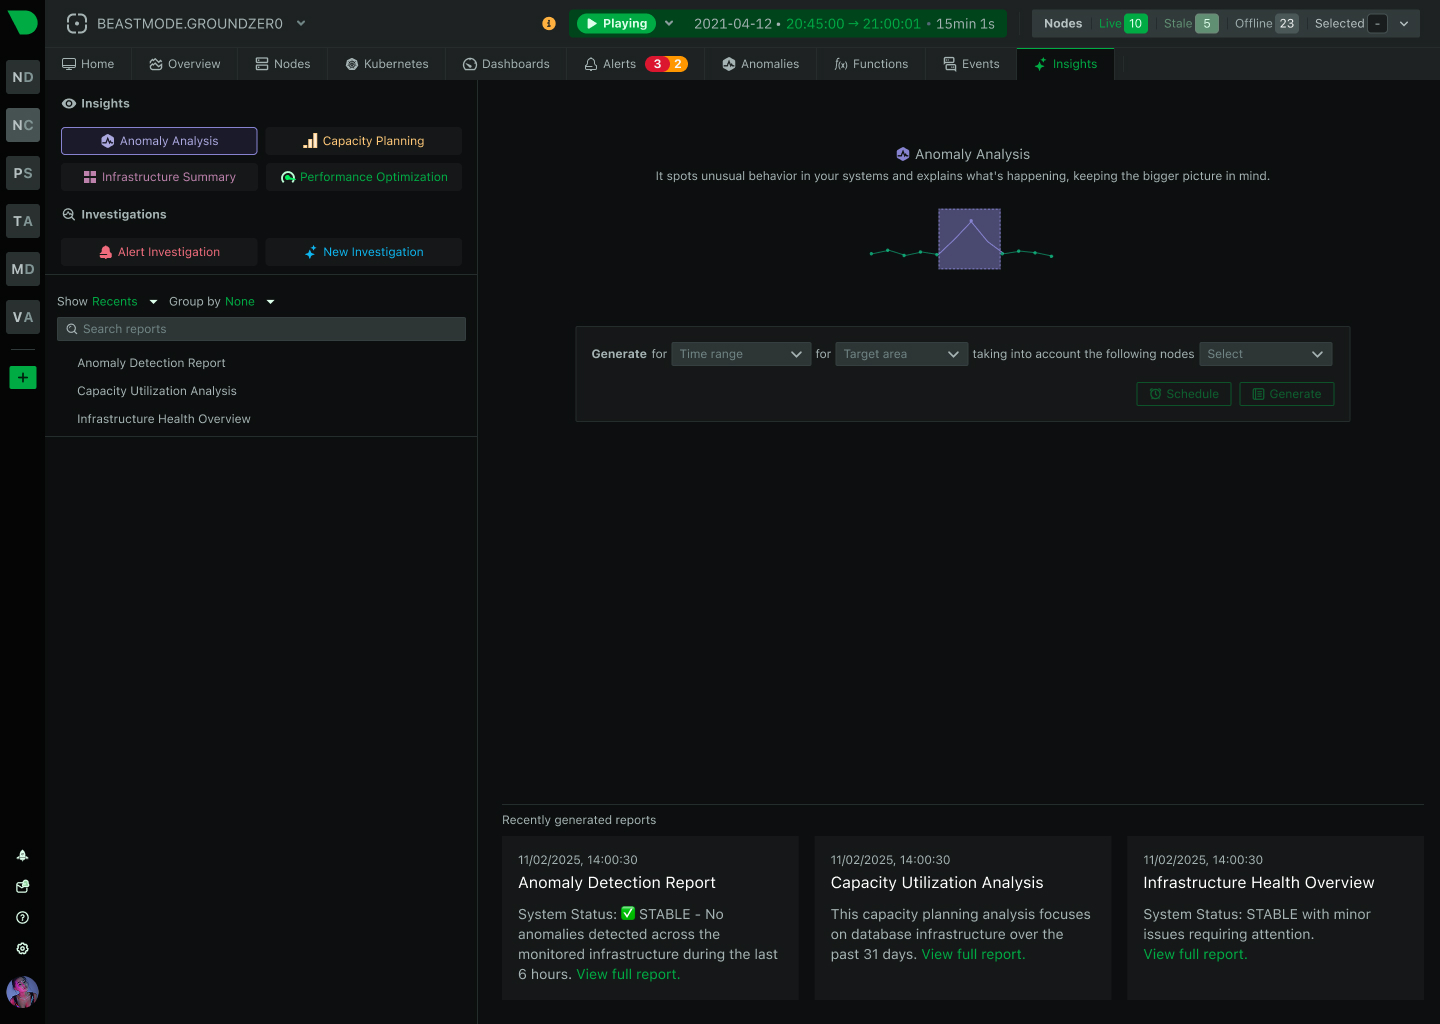
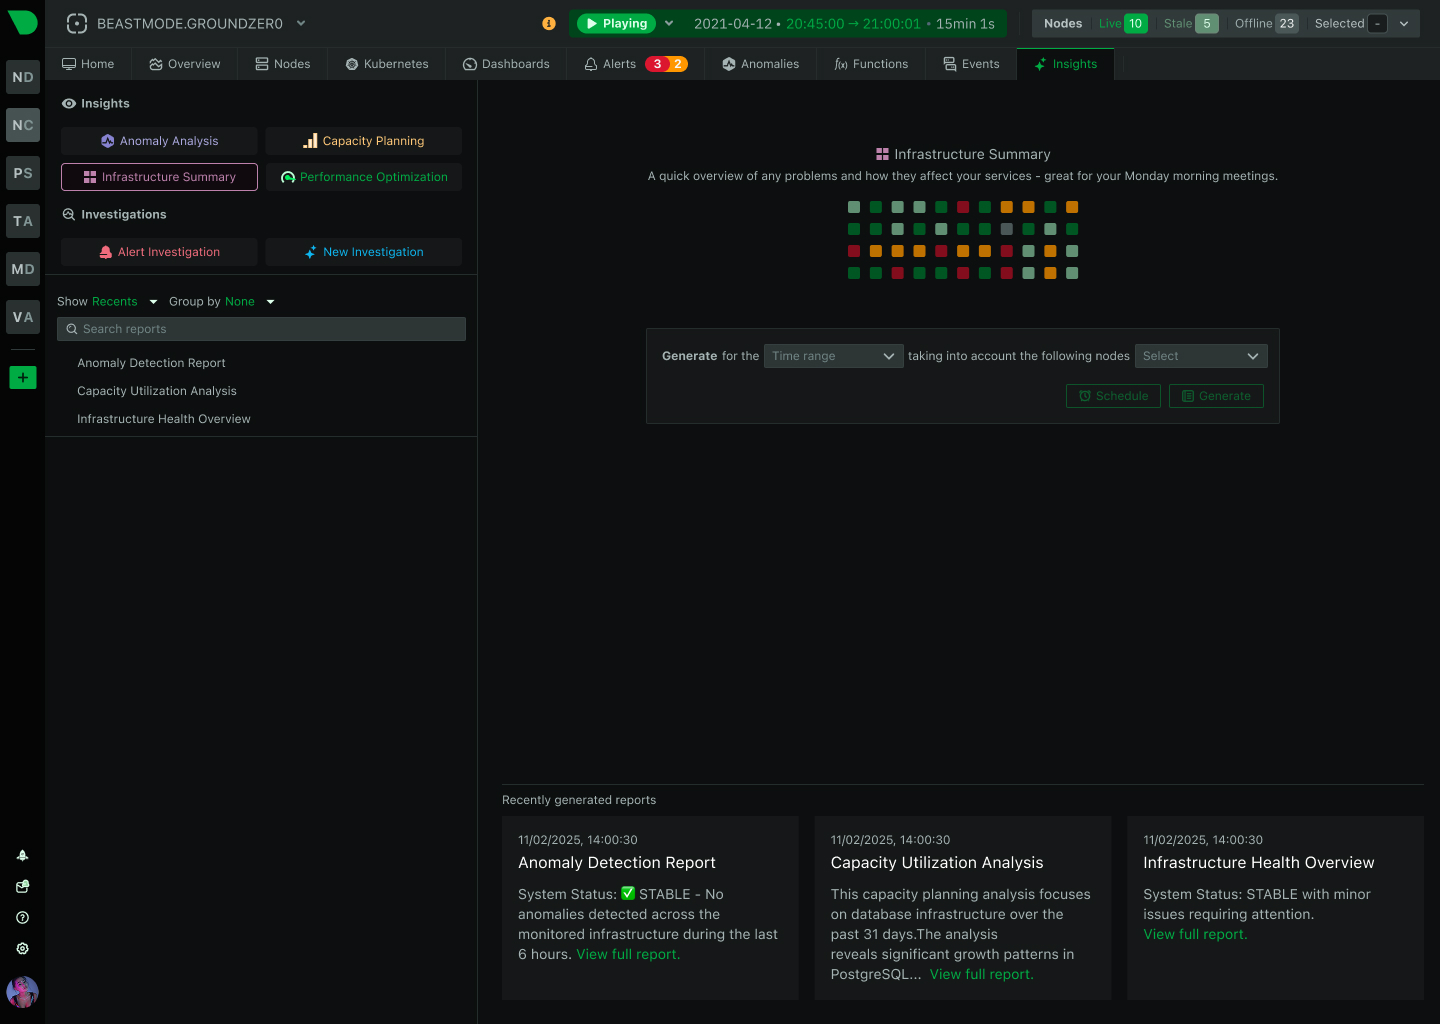
Professional Infrastructure Reports in Minutes, Not Hours

Transform overwhelming observability data into actionable intelligence. Netdata’s AI reporting delivers automated infrastructure summaries, capacity forecasts, performance optimization recommendations, and root cause analysis - all generated in 2-3 minutes with zero configuration.

Background Hero

Accelerate from Data to Decisions

Edge-native AI that transforms monitoring data into strategic intelligence

Generate Reports in Minutes

Professional infrastructure summaries, capacity forecasts, and optimization recommendations delivered in 2-3 minutes - not hours of manual analysis.

Uncover Hidden Patterns

AI analyzes thousands of metrics simultaneously to reveal interdependencies, bottlenecks, and optimization opportunities invisible to manual investigation.

Export Professional Documents

Stakeholder-ready PDF reports with visualizations, recommendations, and executive summaries - no manual compilation or formatting required.

Schedule Automated Analysis

Periodic infrastructure health checks, capacity reviews, and performance assessments delivered automatically - proactive intelligence without manual effort.

Gain Complete Context

AI receives anomaly-enriched metrics, alert transitions, logs, and topology automatically - comprehensive analysis without manual correlation.

Reduce Analysis Costs

Eliminate hours of senior engineer time spent on manual reporting - AI delivers expert-level analysis at a fraction of the cost.

Trusted by operations teams worldwide

Transform Observability Data into Strategic Intelligence

Accelerate Incident Resolution with Automated Root Cause Analysis

When alerts fire, Netdata’s AI immediately generates comprehensive incident reports - complete timeline of cascading failures, blast radius visualization, and specific remediation recommendations. What traditionally requires hours of senior engineer investigation now arrives in 2-3 minutes, enabling 80% MTTR reduction.

80% MTTR Reduction

Explore Root Cause Analysis

Accelerate Incident Resolution with Automated Root Cause Analysis

Forecast Capacity Needs Before Resources Run Out

Netdata’s AI analyzes historical growth patterns across CPU, memory, storage, and network to predict resource exhaustion with specific dates and recommendations. Automated capacity planning reports identify which systems need scaling, when intervention is required, and what actions to take - transforming reactive firefighting into proactive infrastructure management.

Proactive Planning

Learn About AI Insights

Forecast Capacity Needs Before Resources Run Out

Optimize Performance with Actionable Recommendations

AI identifies bottlenecks across your infrastructure and generates specific optimization commands - database index suggestions, cache configuration tuning, resource allocation adjustments. Each recommendation includes projected impact and implementation steps, enabling teams to improve performance systematically rather than through trial and error.

Specific Commands

See Performance Optimization

Optimize Performance with Actionable Recommendations

Detect Anomalies Across Thousands of Metrics Simultaneously

While traditional monitoring requires manual threshold configuration and constant tuning, Netdata’s AI automatically analyzes patterns across your entire infrastructure. Anomaly analysis reports reveal unusual behavior, correlate related issues, and explain significance - surfacing problems that would remain invisible to static thresholds or manual investigation.

Intelligent Detection

Discover Anomaly Detection

Detect Anomalies Across Thousands of Metrics Simultaneously

Understand Infrastructure Health at a Glance

Executive-level infrastructure summaries provide instant visibility into system health, active issues, and operational trends. AI synthesizes thousands of metrics into clear assessments that answer ‘how is everything running?’ - enabling leadership to understand infrastructure status without technical deep-dives.

Executive Clarity

View Infrastructure Insights

Understand Infrastructure Health at a Glance

Schedule Periodic Intelligence Without Manual Effort

Configure automated reports for weekly capacity reviews, monthly performance assessments, or daily health checks. Scheduled AI analysis delivers consistent infrastructure intelligence to stakeholders automatically - ensuring proactive monitoring without requiring dedicated analyst time.

Automated Delivery

Explore Scheduling Options

Schedule Periodic Intelligence Without Manual Effort

AI Reporting Capabilities

Netdata vs Traditional Monitoring Platforms

Compare automated intelligence delivery across observability platforms

Capability

Netdata

Traditional Platforms

Report Generation Speed

✅ 2-3 Minutes
Automated analysis across entire infrastructure

⚠️ Hours to Days
Manual investigation and compilation required

Configuration Required

✅ Zero Setup
AI works from installation automatically

⚠️ Extensive Tuning
Dashboard building and query configuration

Data Granularity

✅ Per-Second Resolution
Complete fidelity for accurate analysis

⚠️ Minute Averages
Sampling hides transient issues

Anomaly Detection

✅ 18 ML Models
Consensus-based anomaly detection

⚠️ Static Thresholds
Manual configuration and constant tuning

Root Cause Analysis

✅ Automated Timeline
Cascading effects and blast radius

⚠️ Manual Correlation
Engineers piece together from logs

Report Scheduling

✅ Fully Automated
Periodic delivery without manual effort

⚠️ Manual Process
Requires dedicated analyst time

Professional Export

✅ PDF Generation
Stakeholder-ready documents automatically

⚠️ Manual Compilation
Screenshots and manual formatting

Natural Language Interface

✅ AI Chat Included
Ask questions in plain English

⚠️ Query Languages
PromQL, SQL expertise required

Context Completeness

✅ Unified View
Metrics, logs, alerts, topology together

⚠️ Fragmented Data
Manual correlation across tools

Pricing Model

✅ Predictable Per-Node
AI included, 10 free sessions monthly

❌ Volume-Based Fees
Unpredictable costs, premium AI tiers

Compare Full Platform Capabilities

Comprehensive AI Reporting Capabilities

Instant Health Assessment

Executive-level overview synthesizing thousands of metrics into clear infrastructure health status, active issues, and operational trends - answering 'how is everything running?' without technical deep-dives.

Complete visibility in minutes

Explore Infrastructure Intelligence
Infrastructure Summary Dashboard

Why Teams Choose Netdata AI Reporting

Real benefits from automated infrastructure intelligence

Frequently Asked Questions