The only agent that thinks for itself

Autonomous Monitoring with self-learning AI built-in, operating independently across your entire stack.

Unlimited Metrics & Logs
Machine learning & MCP
5% CPU, 150MB RAM
3GB disk, >1 year retention
800+ integrations, zero config
Dashboards, alerts out of the box
> Discover Netdata Agents
Centralized metrics streaming and storage

Aggregate metrics from multiple agents into centralized Parent nodes for unified monitoring across your infrastructure.

Stream from unlimited agents
Long-term data retention
High availability clustering
Data replication & backup
Scalable architecture
Enterprise-grade security
> Learn about Parents
Fully managed cloud platform

Access your monitoring data from anywhere with our SaaS platform. No infrastructure to manage, automatic updates, and global availability.

Zero infrastructure management
99.9% uptime SLA
Global data centers
Automatic updates & patches
Enterprise SSO & RBAC
SOC2 & ISO certified
> Explore Netdata Cloud
Deploy Netdata Cloud in your infrastructure

Run the full Netdata Cloud platform on-premises for complete data sovereignty and compliance with your security policies.

Complete data sovereignty
Air-gapped deployment
Custom compliance controls
Private network integration
Dedicated support team
Kubernetes & Docker support
> Learn about Cloud On-Premises
Powerful, intuitive monitoring interface

Modern, responsive UI built for real-time troubleshooting with customizable dashboards and advanced visualization capabilities.

Real-time chart updates
Customizable dashboards
Dark & light themes
Advanced filtering & search
Responsive on all devices
Collaboration features
> Explore Netdata UI
Monitor on the go

Native iOS and Android apps bring full monitoring capabilities to your mobile device with real-time alerts and notifications.

iOS & Android apps
Push notifications
Touch-optimized interface
Offline data access
Biometric authentication
Widget support
> Download apps

Best energy efficiency

True real-time per-second

100% automated zero config

Centralized observability

Multi-year retention

High availability built-in

Zero maintenance

Always up-to-date

Enterprise security

Complete data control

Air-gap ready

Compliance certified

Millisecond responsiveness

Infinite zoom & pan

Works on any device

Native performance

Instant alerts

Monitor anywhere

80% Faster Incident Resolution
AI-powered troubleshooting from detection, to root cause and blast radius identification, to reporting.
True Real-Time and Simple, even at Scale
Linearly and infinitely scalable full-stack observability, that can be deployed even mid-crisis.
90% Cost Reduction, Full Fidelity
Instead of centralizing the data, Netdata distributes the code, eliminating pipelines and complexity.
Control Without Surrender
SOC 2 Type 2 certified with every metric kept on your infrastructure.
Integrations

800+ collectors and notification channels, auto-discovered and ready out of the box.

800+ data collectors
Auto-discovery & zero config
Cloud, infra, app protocols
Notifications out of the box
> Explore integrations
Real Results
46% Cost Reduction

Reduced monitoring costs by 46% while cutting staff overhead by 67%.

— Leonardo Antunez, Codyas

Zero Pipeline

No data shipping. No central storage costs. Query at the edge.

From Our Users
"Out-of-the-Box"

So many out-of-the-box features! I mostly don't have to develop anything.

— Simon Beginn, LANCOM Systems

No Query Language

Point-and-click troubleshooting. No PromQL, no LogQL, no learning curve.

Enterprise Ready
67% Less Staff, 46% Cost Cut

Enterprise efficiency without enterprise complexity—real ROI from day one.

— Leonardo Antunez, Codyas

SOC 2 Type 2 Certified

Zero data egress. Only metadata reaches the cloud. Your metrics stay on your infrastructure.

Full Coverage
800+ Collectors

Auto-discovered and configured. No manual setup required.

Any Notification Channel

Slack, PagerDuty, Teams, email, webhooks—all built-in.

From Our Users
"A Rare Unicorn"

Netdata gives more than you invest in it. A rare unicorn that obeys the Pareto rule.

— Eduard Porquet Mateu, TMB Barcelona

99% Downtime Reduction

Reduced website downtime by 99% and cloud bill by 30% using Netdata alerts.

— Falkland Islands Government

Real Savings
30% Cloud Cost Reduction

Optimized resource allocation based on Netdata alerts cut cloud spending by 30%.

— Falkland Islands Government

46% Cost Cut

Reduced monitoring staff by 67% while cutting operational costs by 46%.

— Codyas

Real Coverage
"Plugin for Everything"

Netdata has agent capacity or a plugin for everything, including Windows and Kubernetes.

— Eduard Porquet Mateu, TMB Barcelona

"Out-of-the-Box"

So many out-of-the-box features! I mostly don't have to develop anything.

— Simon Beginn, LANCOM Systems

Real Speed
Troubleshooting in 30 Seconds

From 2-3 minutes to 30 seconds—instant visibility into any node issue.

— Matthew Artist, Nodecraft

20% Downtime Reduction

20% less downtime and 40% budget optimization from out-of-the-box monitoring.

— Simon Beginn, LANCOM Systems

Pay per Node. Unlimited Everything Else.

One price per node. Unlimited metrics, logs, users, and retention. No per-GB surprises.

Free tier—forever
No metric limits or caps
Retention you control
Cancel anytime
> See pricing plans
What's Your Monitoring Really Costing You?

Most teams overpay by 40-60%. Let's find out why.

Expose hidden metric charges
Calculate tool consolidation
Customers report 30-67% savings
Results in under 60 seconds
> See what you're really paying
Your Infrastructure Is Unique. Let's Talk.

Because monitoring 10 nodes is different from monitoring 10,000.

On-prem & air-gapped deployment
Volume pricing & agreements
Architecture review for your scale
Compliance & security support
> Start a conversation
Monitoring That Sells Itself

Deploy in minutes. Impress clients in hours. Earn recurring revenue for years.

30-second live demos close deals
Zero config = zero support burden
Competitive margins & deal protection
Response in 48 hours
> Apply to partner
Per-Second Metrics at Homelab Prices

Same engine, same dashboards, same ML. Just priced for tinkerers.

Community: Free forever · 5 nodes · non-commercial
Homelab: $90/yr · unlimited nodes · fair usage
> Start monitoring your lab—free
$1,000 Per Referral. Unlimited Referrals.

Your colleagues get 10% off. You get 10% commission. Everyone wins.

10% of subscriptions, up to $1,000 each
Track earnings inside Netdata Cloud
PayPal/Venmo payouts in 3-4 weeks
No caps, no complexity
> Get your referral link
Cost Proof
40% Budget Optimization

"Netdata's significant positive impact" — LANCOM Systems

Calculate Your Savings

Compare vs Datadog, Grafana, Dynatrace

Savings Proof
46% Cost Reduction

"Cut costs by 46%, staff by 67%" — Codyas

30% Cloud Bill Savings

"Reduced cloud bill by 30%" — Falkland Islands Gov

Enterprise Proof
"Better Than Combined Alternatives"

"Better observability with Netdata than combining other tools." — TMB Barcelona

Real Engineers, <24h Response

DPA, SLAs, on-prem, volume pricing

Why Partners Win
Demo Live Infrastructure

One command, 30 seconds, real data—no sandbox needed

Zero Tickets, High Margins

Auto-config + per-node pricing = predictable profit

Homelab Ready
"Absolutely Incredible"

"We tested every monitoring system under the sun." — Benjamin Gabler, CEO Rocket.Net

76k+ GitHub Stars

3rd most starred monitoring project

Worth Recommending
Product That Delivers

Customers report 40-67% cost cuts, 99% downtime reduction

Zero Risk to Your Rep

Free tier lets them try before they buy

Never Fight Fires Alone

Docs, community, and expert help—pick your path to resolution.

Learn.netdata.cloud docs
Discord, Forums, GitHub
Premium support available
> Get answers now
60 Seconds to First Dashboard

One command to install. Zero config. 850+ integrations documented.

Linux, Windows, K8s, Docker
Auto-discovers your stack
> Start monitoring now
See Netdata in Action

Watch real-time monitoring in action—demos, tutorials, and engineering deep dives.

Product demos and walkthroughs
Real infrastructure, not staged
> Start with the 3-minute tour
Level Up Your Monitoring
Real problems. Real solutions. 112+ guides from basic monitoring to AI observability.
76,000+ Engineers Strong
615+ contributors. 1.5M daily downloads. One mission: simplify observability.
Per-Second. 90% Cheaper. Data Stays Home.
Side-by-side comparisons: costs, real-time granularity, and data sovereignty for every major tool.

See why teams switch from Datadog, Prometheus, Grafana, and more.

> Browse all comparisons
Edge-Native Observability, Born Open Source
Per-second visibility, ML on every metric, and data that never leaves your infrastructure.
Founded in 2016
615+ contributors worldwide
Remote-first, engineering-driven
Open source first
> Read our story
Promises We Publish—and Prove
12 principles backed by open code, independent validation, and measurable outcomes.
Open source, peer-reviewed
Zero config, instant value
Data sovereignty by design
Aligned pricing, no surprises
> See all 12 principles
Edge-Native, AI-Ready, 100% Open
76k+ stars. Full ML, AI, and automation—GPLv3+, not premium add-ons.
76,000+ GitHub stars
GPLv3+ licensed forever
ML on every metric, included
Zero vendor lock-in
> Explore our open source
Build Real-Time Observability for the World
Remote-first team shipping per-second monitoring with ML on every metric.
Remote-first, fully distributed
Open source (76k+ stars)
Challenging technical problems
Your code on millions of systems
> See open roles
Talk to a Netdata Human in <24 Hours
Sales, partnerships, press, or professional services—real engineers, fast answers.
Discuss your observability needs
Pricing and volume discounts
Partnership opportunities
Media and press inquiries
> Book a conversation
Your Data. Your Rules.
On-prem data, cloud control plane, transparent terms.
Trust & Scale
76,000+ GitHub Stars

One of the most popular open-source monitoring projects

SOC 2 Type 2 Certified

Enterprise-grade security and compliance

Data Sovereignty

Your metrics stay on your infrastructure

Validated
University of Amsterdam

"Most energy-efficient monitoring solution" — ICSOC 2023, peer-reviewed

ADASTEC (Autonomous Driving)

"Doesn't miss alerts—mission-critical trust for safety software"

Community Stats
615+ Contributors

Global community improving monitoring for everyone

1.5M+ Downloads/Day

Trusted by teams worldwide

GPLv3+ Licensed

Free forever, fully open source agent

Why Join?
Remote-First

Work from anywhere, async-friendly culture

Impact at Scale

Your work helps millions of systems

Compliance
SOC 2 Type 2

Audited security controls

GDPR Ready

Data stays on your infrastructure

Edge Computing Observability

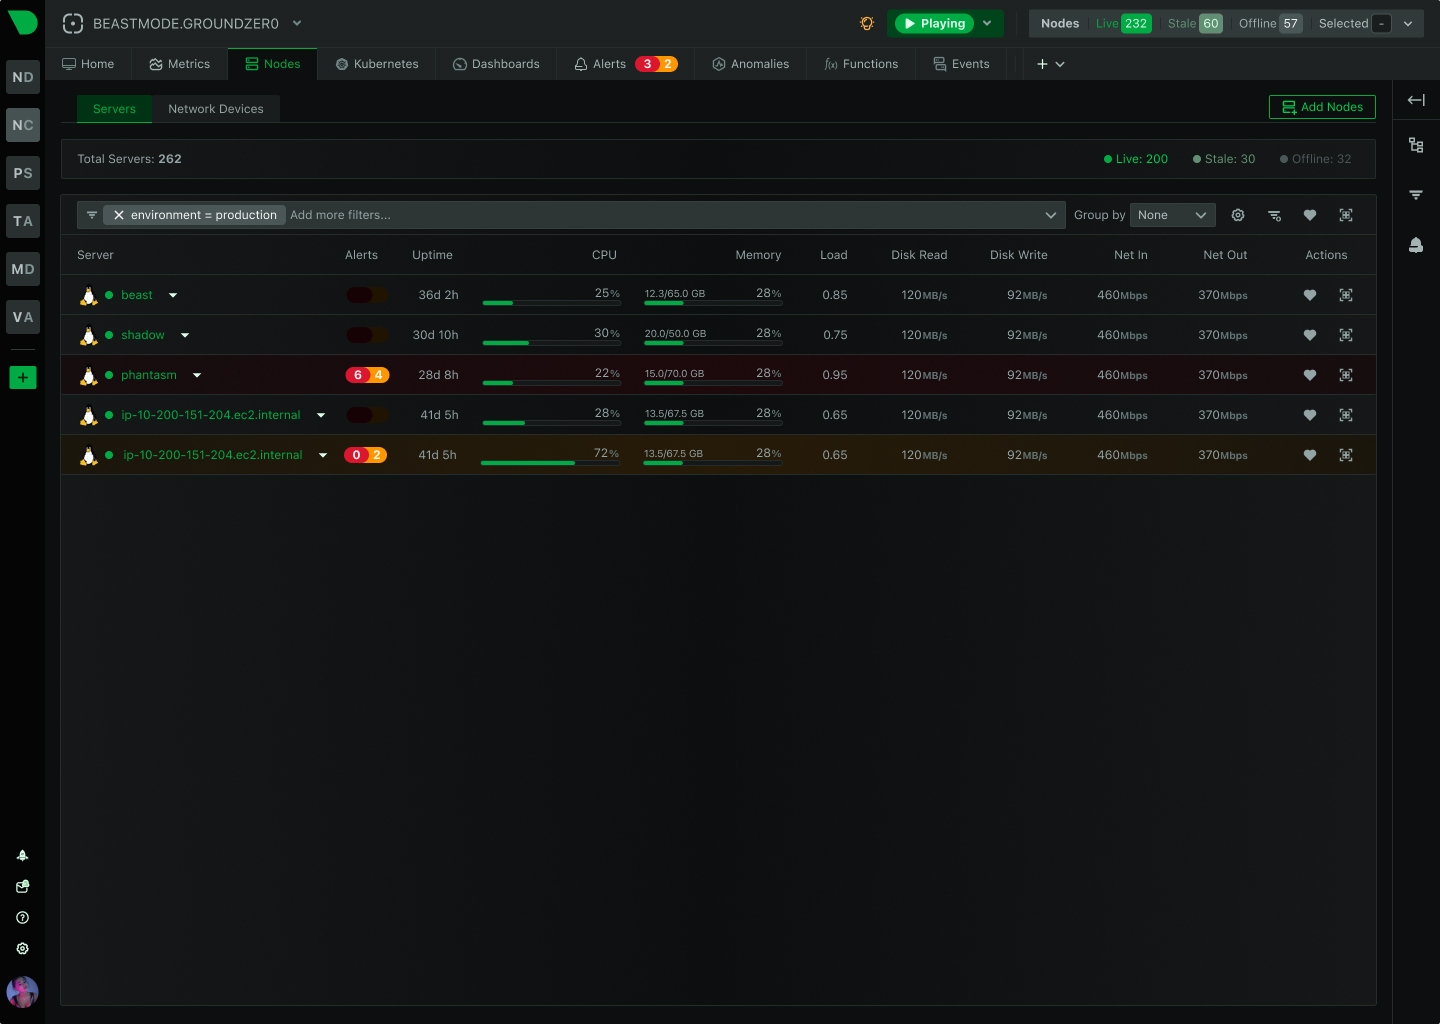
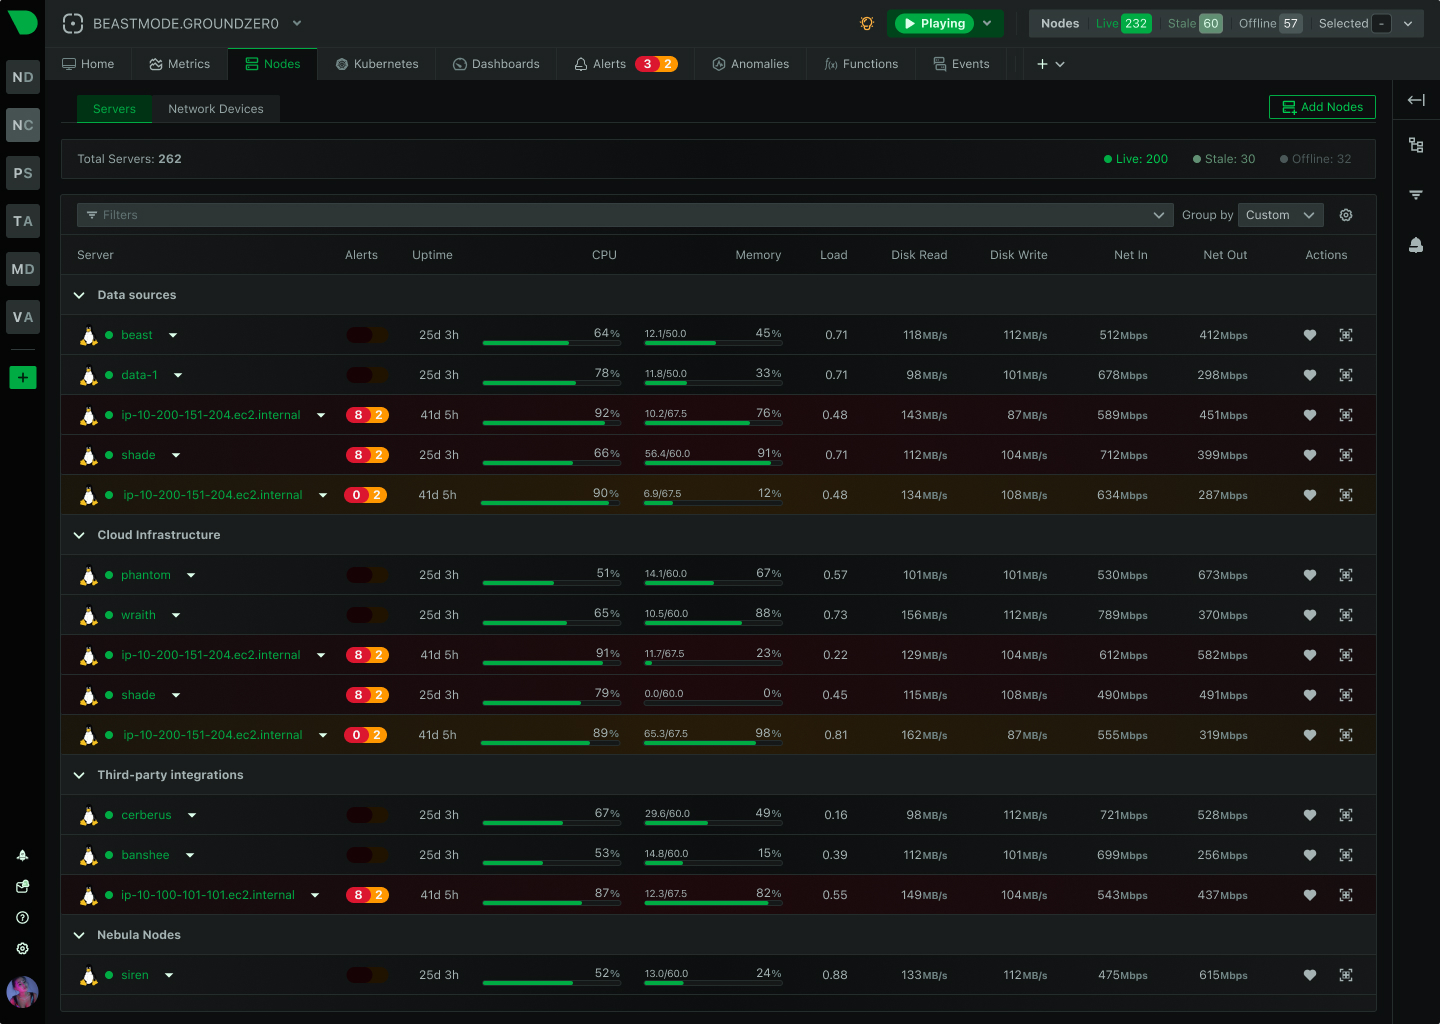
Monitor Every Edge Node Without Sacrificing Performance

Netdata delivers complete observability across distributed edge infrastructure with per-second precision, minimal resource consumption, and autonomous operation - even when connectivity fails. Built for edge-first architectures where intelligence lives at the source and visibility never depends on the cloud.

Background Hero

Edge-Native Observability That Actually Works at the Edge

Purpose-built for distributed, resource-constrained, intermittently-connected environments

Autonomous Operation

Every agent is a complete observability engine - collection, storage, ML, alerts, dashboards - operating independently without cloud dependency.

Minimal Resource Impact

Monitor with <5% CPU and 150MB RAM. University-validated as the most energy-efficient solution while collecting per-second data.

Predictable Edge Economics

Per-node pricing with volume discounts. Monitor unlimited metrics without data volume charges - 90% cost reduction vs traditional platforms.

Real-Time ML at the Edge

18 unsupervised models per metric train locally, achieving 99% false positive reduction through consensus - no cloud processing required.

Data Sovereignty by Design

All metrics and logs stay on-premises. ML trains locally. Only metadata travels to Cloud - perfect for regulated industries and air-gapped facilities.

Zero Configuration Deployment

Install in 60 seconds, gain complete visibility. Auto-discovers 800+ integrations, generates dashboards algorithmically, trains ML automatically.

Trusted by organizations managing distributed edge infrastructure worldwide

Transform Edge Observability From Burden to Advantage

Gain Complete Visibility Without Network Dependency

Traditional monitoring fails when connectivity drops. Netdata maintains full observability locally - collecting, analyzing, alerting, visualizing - whether online or offline. Resume streaming when connectivity returns without data loss.

100% visibility maintained during network partitions

Learn about autonomous operation

Gain Complete Visibility Without Network Dependency

Scale From Hundreds to Millions Without Architectural Changes

Adding edge nodes doesn’t degrade existing performance. Each agent operates independently while parent clusters aggregate multi-node views. Deploy more parents as you grow - linear scaling from 10 to 100,000 nodes.

4.5B+ metrics/second processed globally

Explore scalability architecture

Scale From Hundreds to Millions Without Architectural Changes

Detect Anomalies Before They Cascade Into Failures

Unsupervised ML trains 18 models per metric locally, detecting anomalies with 99% false positive reduction. Anomaly Advisor correlates issues across all metrics, surfacing root cause in top 30-50 results - critical for remote troubleshooting.

15 minutes to first ML detection, 2 days to full confidence

Discover ML capabilities

Detect Anomalies Before They Cascade Into Failures

Troubleshoot Remotely Without SSH Access

Built-in Netdata Functions replace console tools - processes, network connections, systemd services, logs - all accessible via web dashboard with history and ML context. Perfect for retail locations, manufacturing facilities, remote energy sites.

Replaces top, iostat, netstat, journalctl, and more

See Functions in action

Troubleshoot Remotely Without SSH Access

Monitor Edge AI Workloads With AI-Powered Observability

Per-second GPU metrics (utilization, memory, temperature, power, PCIe bandwidth) for NVIDIA/AMD. AI Co-Engineer provides natural language troubleshooting. ML detects inference anomalies automatically - all while maintaining lightweight footprint edge AI requires.

Monitor AI at the edge with AI at the edge

Explore AI features

Monitor Edge AI Workloads With AI-Powered Observability

Achieve 90% Cost Reduction With Transparent Pricing

Per-node pricing with volume discounts - no data volume charges, no per-metric fees, no user limits. Monitor unlimited metrics, logs, dimensions without watching the meter. The more edge nodes you monitor, the lower your per-node cost.

Predictable per node pricing, no data volume charges

View pricing details

Achieve 90% Cost Reduction With Transparent Pricing

Edge Computing Observability Comparison

How Netdata Transforms Edge Monitoring

Traditional monitoring solutions were built for data centers and retrofitted for edge. Netdata was designed edge-first from day one.

Capability

Netdata

Traditional Monitoring

Offline Operation

✅ Ideal
Full capability maintained during network failures

❌ Not Available
Requires constant cloud connectivity

Resource Footprint

✅ Ideal
<5% CPU, 150MB RAM validated

⚠️ Challenging
10-20% CPU typical, higher memory

Data Granularity

✅ Real-Time
Per-second collection, sub-2s latency

⚠️ Near Real-Time
10-60 second intervals typical

ML Anomaly Detection

✅ Included
18 models per metric, edge-trained

⚠️ Paid Add-On
Cloud-based, often extra cost

Configuration Required

✅ Automated
Auto-discovery, algorithmic dashboards

⚠️ Manual
Extensive setup, dashboard building

Data Sovereignty

✅ Ideal
All data stays on-premises

❌ Not Available
Data transmitted to cloud

Pricing Model

✅ Included
Predictable per node pricing

⚠️ Expensive
Data volume based, unpredictable

Scalability

✅ Ideal
Linear growth, no bottlenecks

⚠️ Complex
Central bottlenecks at scale

Sample Completeness

100%
No sampling or data loss

93-95%
Sampling common at scale

Time to First Dashboard

60 seconds
Instant auto-generated visibility

Hours to weeks
Manual configuration required

Start monitoring your edge infrastructure

Edge Observability Capabilities

Observability That Works When Networks Don't

Every Netdata agent is a complete observability engine - collection, storage, query, ML, alerts, dashboards - operating independently. When connectivity fails, monitoring continues. When connectivity returns, data replicates automatically without gaps.

100% visibility maintained during network partitions

Learn about distributed architecture
Autonomous Operation Dashboard

Key Takeaways for Edge Computing Observability

Why organizations choose Netdata for distributed edge infrastructure monitoring

Frequently Asked Questions