See What Matters, Ignore the Noise
Get 400+ intelligent alerts working in 60 seconds - with component-level precision that pinpoints exactly what failed and where, plus edge-native evaluation that works even during network partitions.


Get 400+ intelligent alerts working in 60 seconds - with component-level precision that pinpoints exactly what failed and where, plus edge-native evaluation that works even during network partitions.
From installation to insight in under a minute
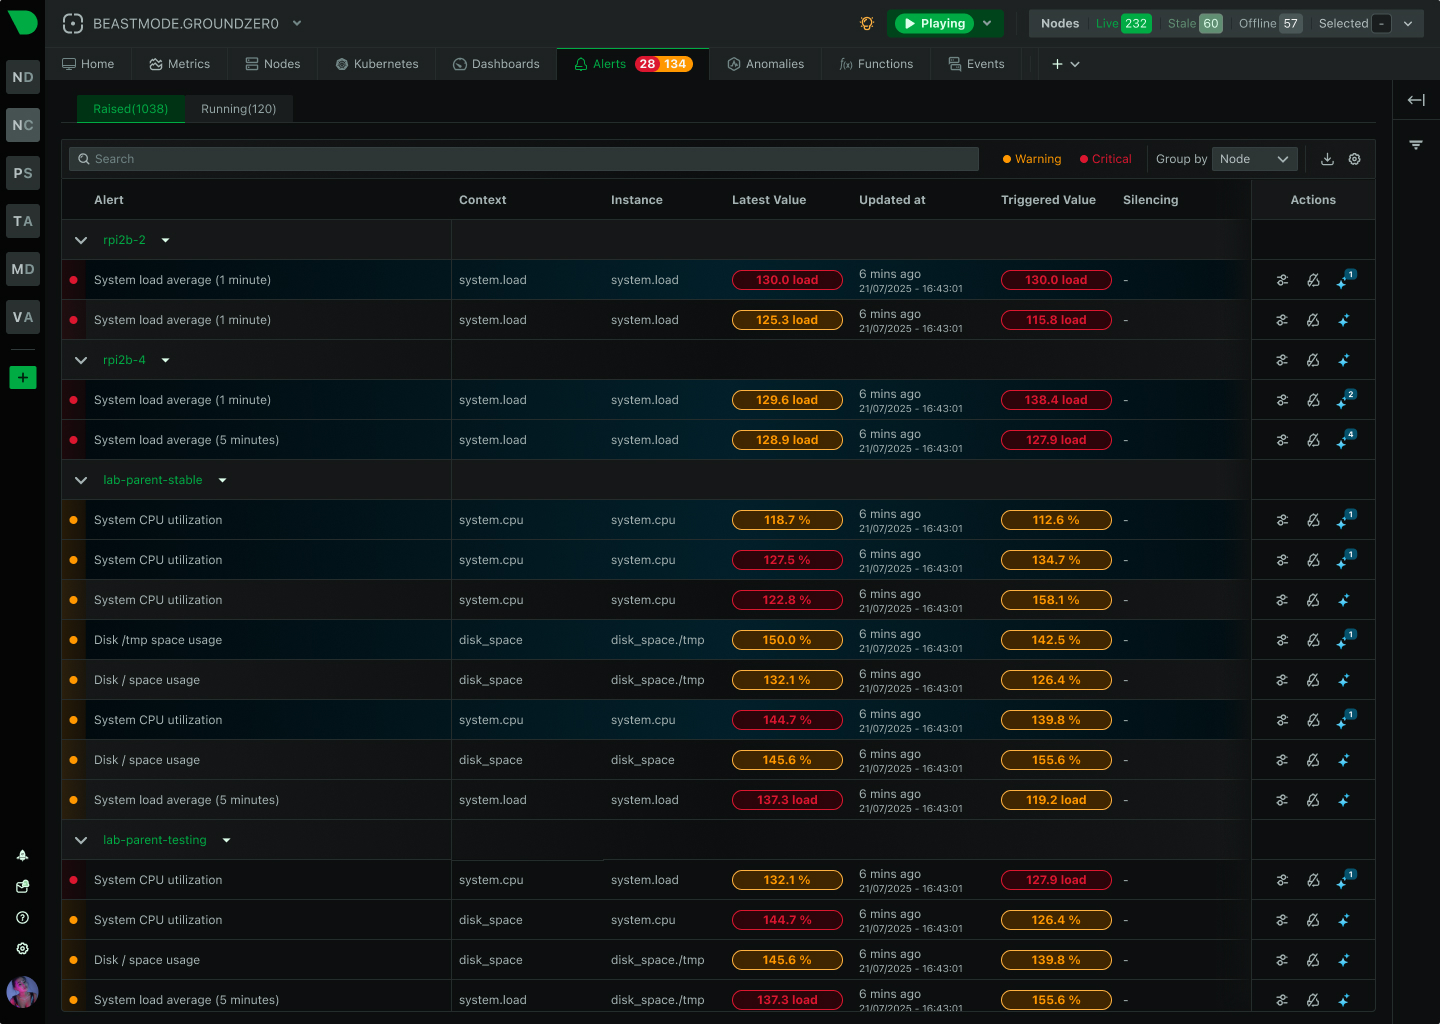
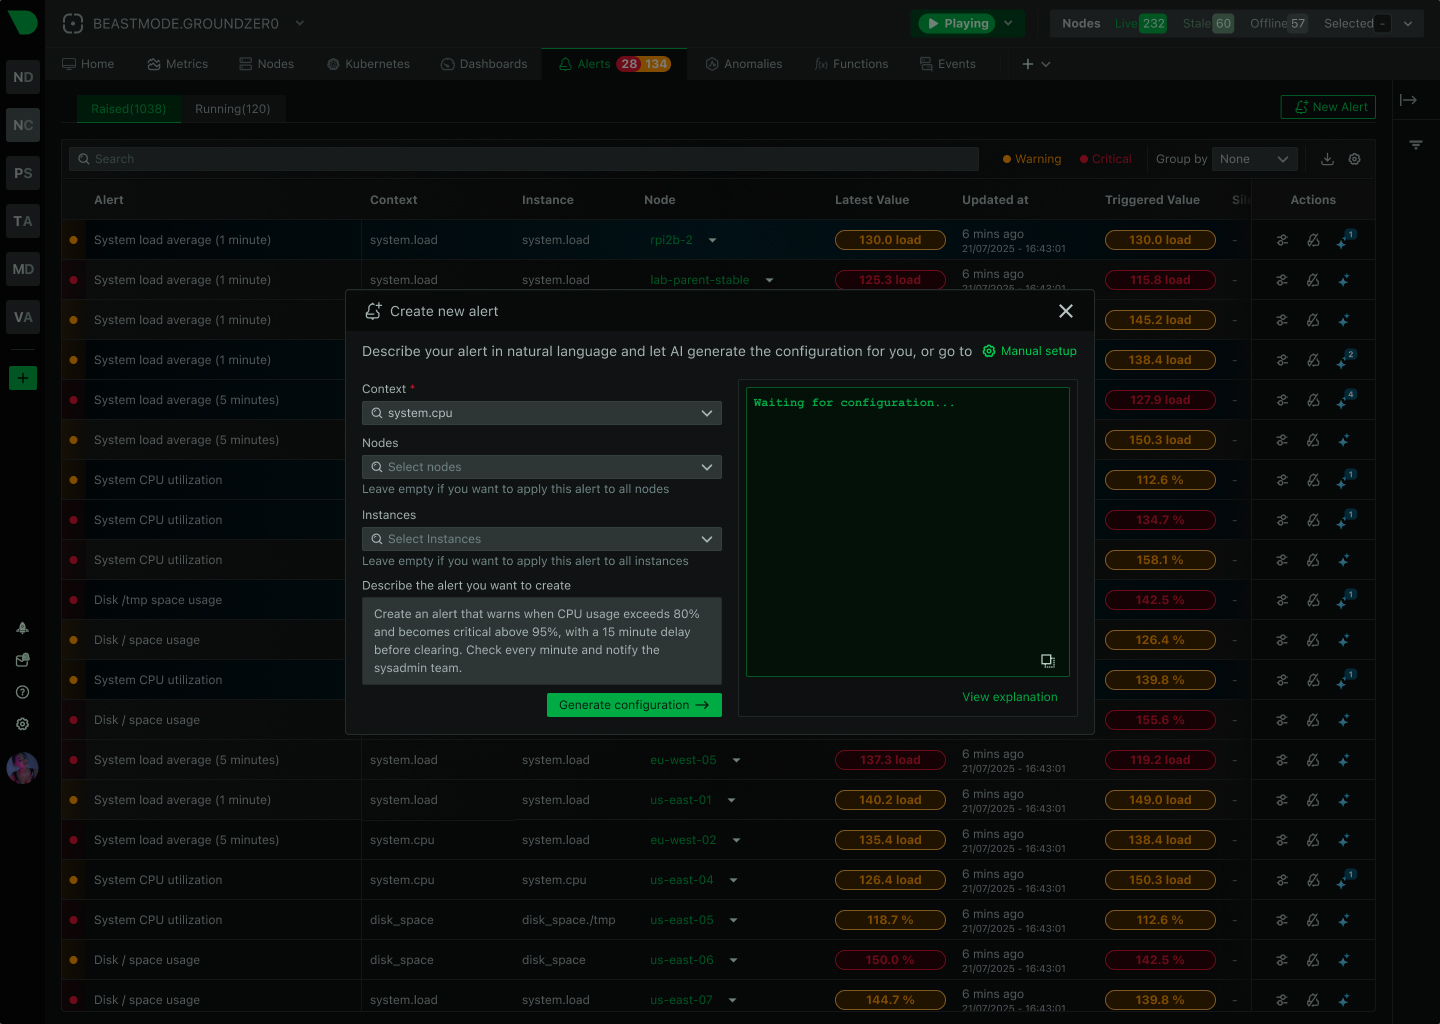
400+ pre-configured alerts auto-apply to discovered services - from CPU and memory to databases and containers - with zero manual configuration required.
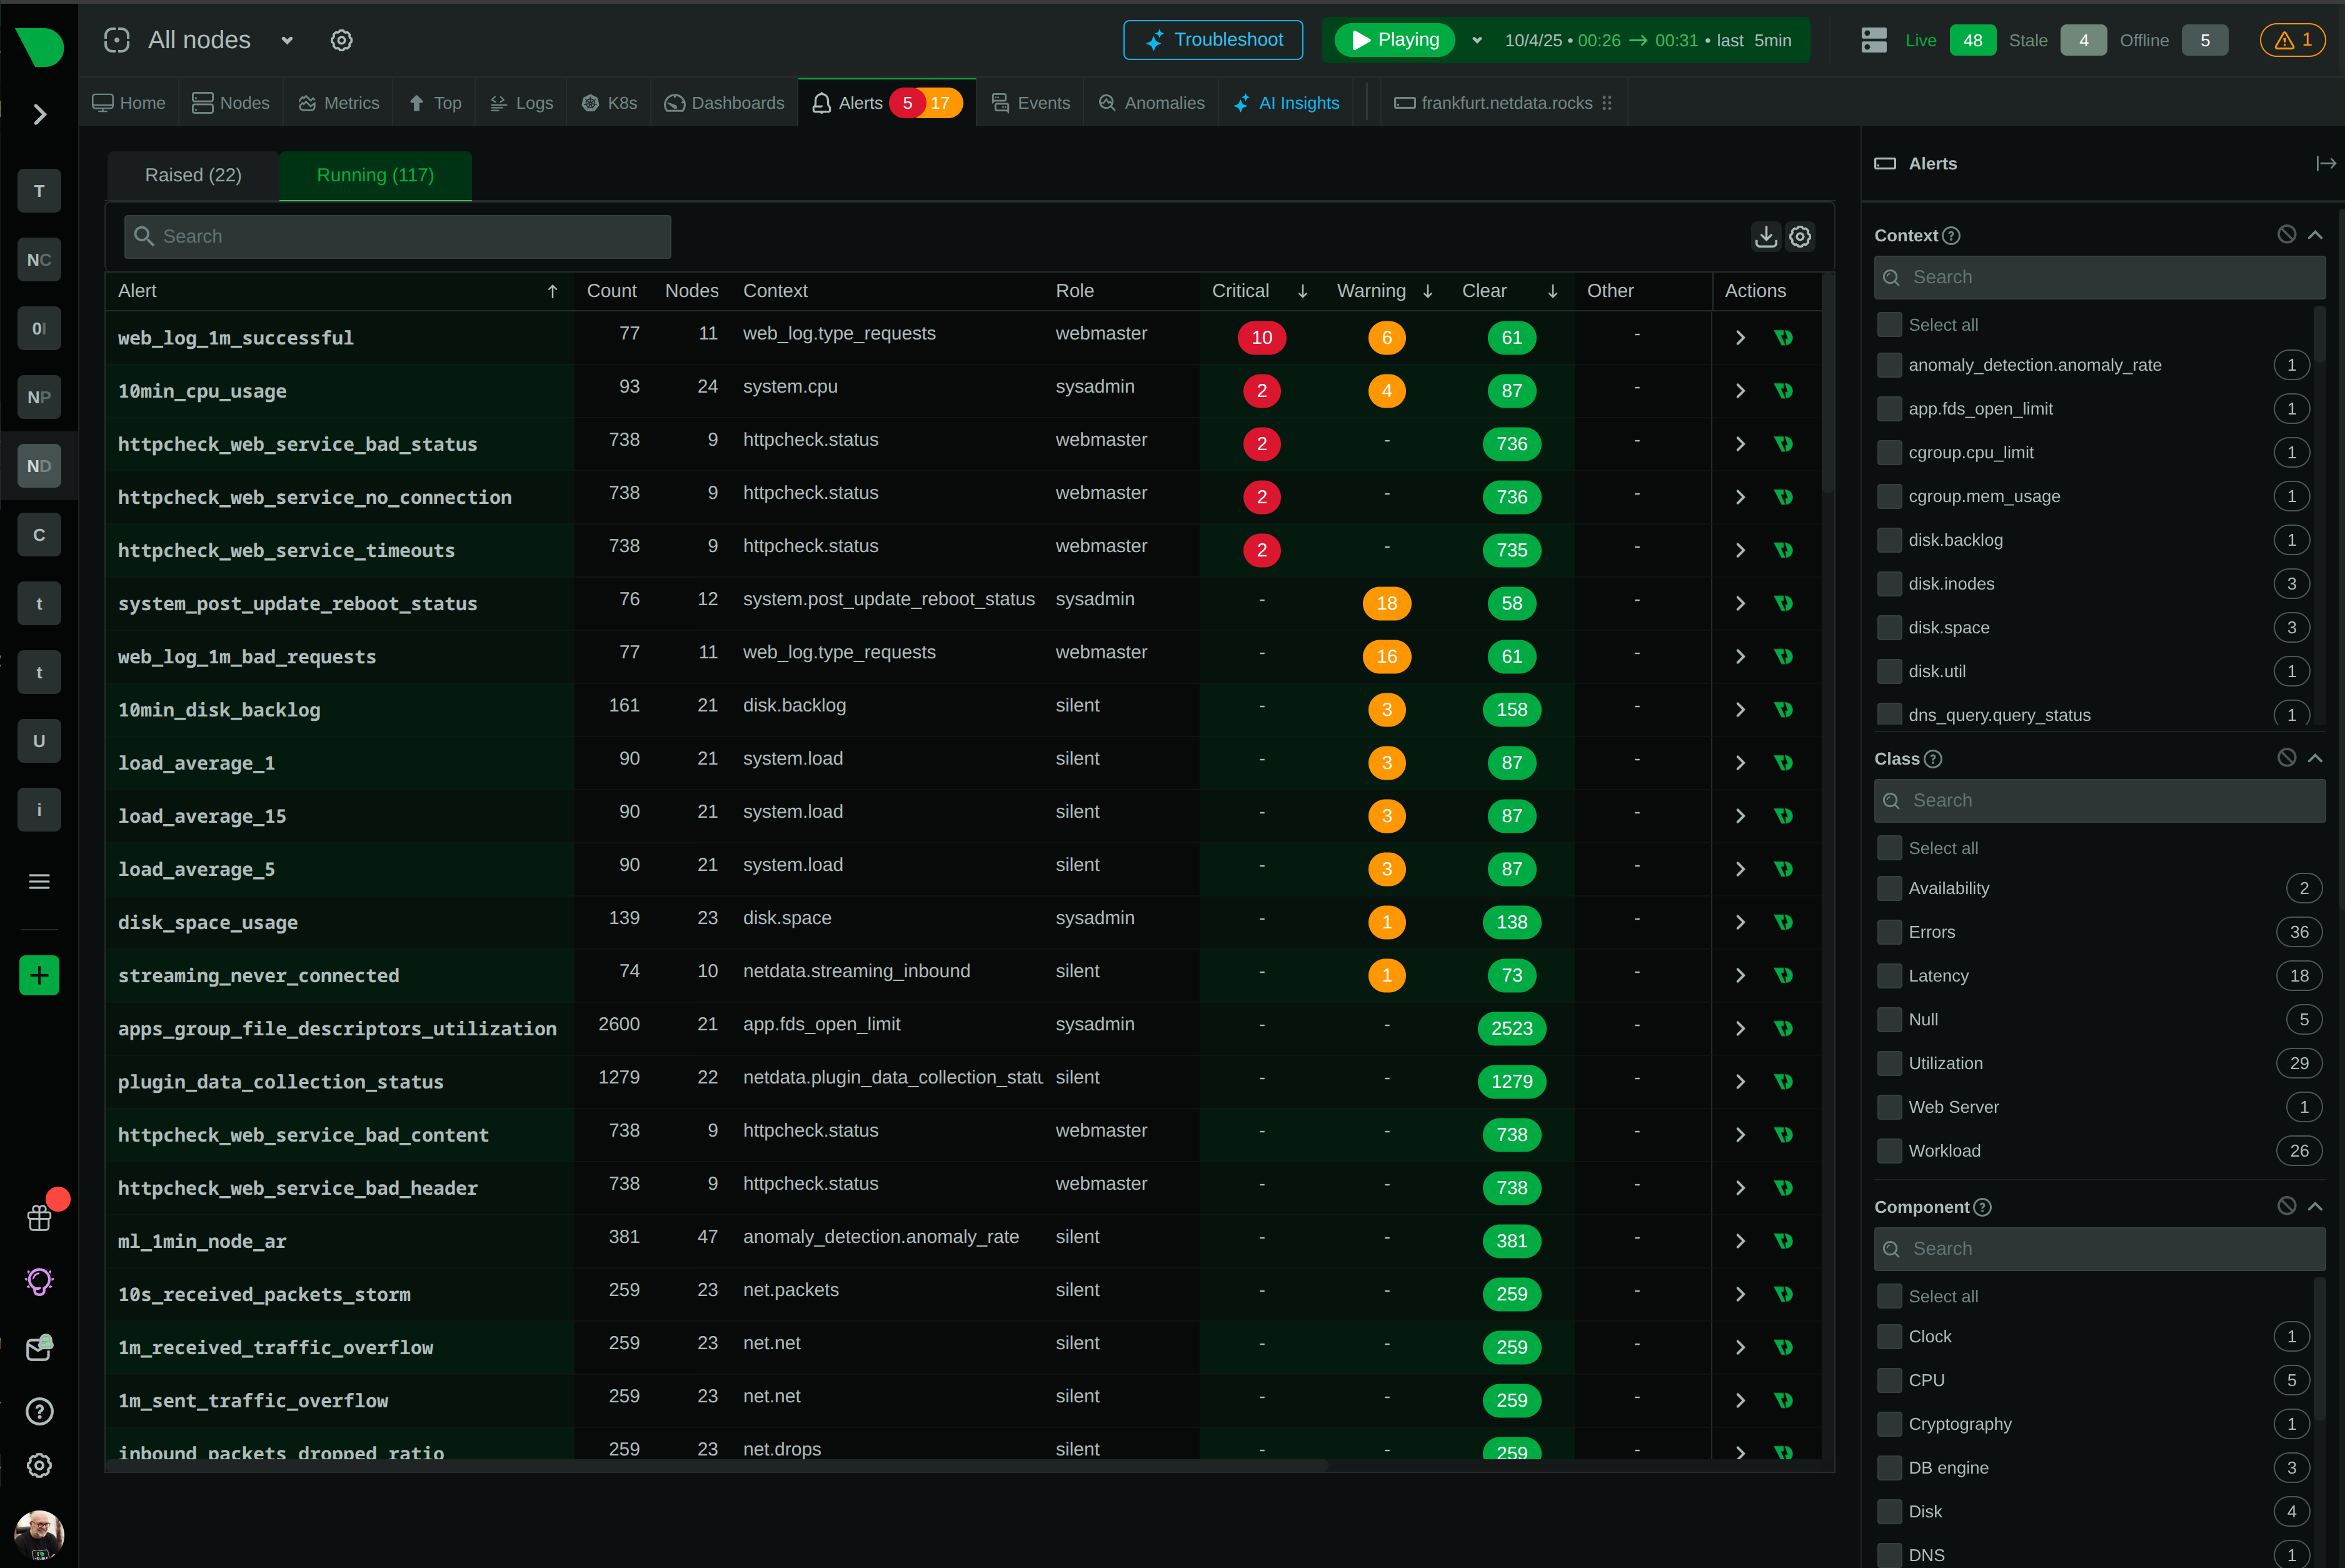
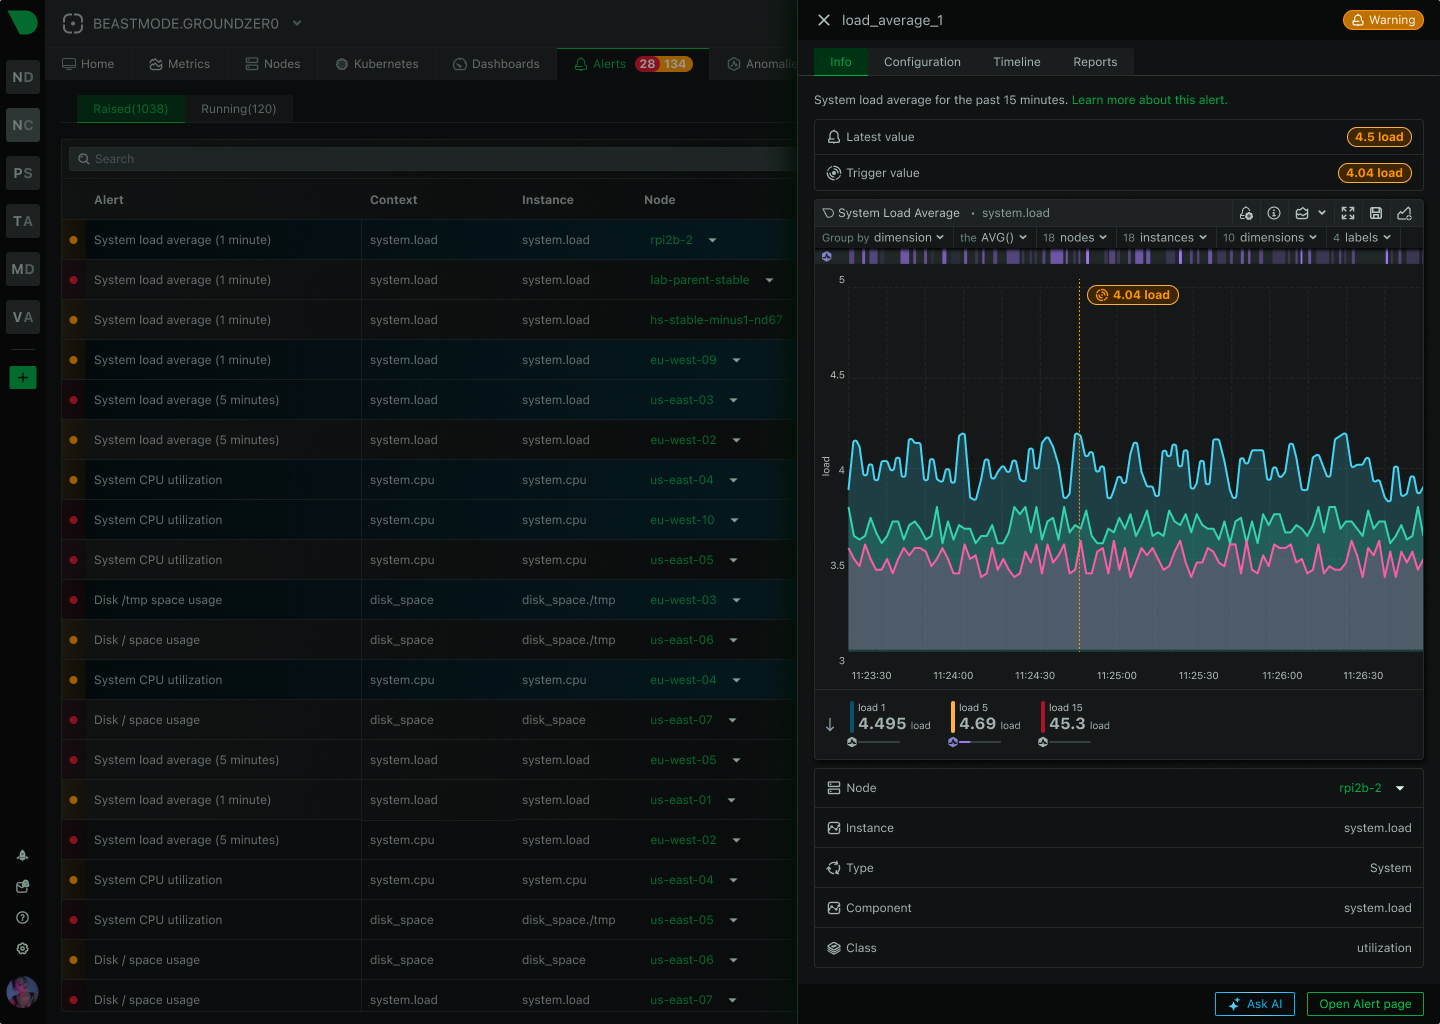
Know exactly what failed and where - per-disk alerts, per-interface monitoring, per-container tracking - eliminating investigation guesswork during incidents.
Alerts evaluate at the source with sub-2-second latency, working even during network partitions - no central bottleneck, no single point of failure.
Route alerts to the right team through their preferred channel - from SMS and Slack to PagerDuty and custom webhooks - with automatic deduplication.
18-model consensus anomaly detection provides an additional signal for investigation - separate from alerts but invaluable for spotting unusual behavior.
From alert to root cause in seconds - Anomaly Advisor correlates metrics across infrastructure, revealing cascading failures and blast radius automatically.
Trusted by DevOps teams worldwide
60 seconds to full protection
View Alert Templates
Component-level precision
See Alert Precision
29 native integrations
Configure Notifications
Zero central dependency
Explore Edge Architecture

18 models per metric
Learn About ML Architecture

80% MTTR reduction
See AI Investigation


How Netdata Compares
See how Netdata’s edge-native architecture delivers superior alerting compared to traditional centralized approaches.
Capability
Netdata
Traditional Monitoring
Time to First Alert
✅ 60 seconds
Zero-config, auto-discovery, instant coverage
⚠️ Days to weeks
Manual rule creation, threshold tuning required
Pre-Configured Alerts
✅ 400+ templates
Infrastructure, databases, services, containers
❌ Limited or none
Build most alerts from scratch
ML Anomaly Detection
✅ Included everywhere
18 models per metric, separate signal
❌ Not available
Or expensive enterprise add-on
Alert Evaluation
✅ Edge-native distributed
Sub-2-second latency, works offline
⚠️ Centralized server
Network dependency, single bottleneck
Component Precision
✅ Automatic per-component
Per-disk, per-interface, per-container
⚠️ Manual configuration
Infrastructure-level generic alerts
Query Language
✅ None required
Simple expressions, template system
⚠️ PromQL or custom DSL
Specialized skills mandatory
Notification Routing
✅ 29 integrations
Multi-channel, role-based, deduplication
⚠️ Limited channels
Basic email/webhook support
Scalability Model
✅ Linear edge-native
10 to 100,000 nodes, same performance
⚠️ Centralized bottleneck
Performance degrades with scale
Cost Structure
✅ Per-node pricing
No per-alert or per-metric charges
⚠️ Complex volume-based
Per-metric, per-monitor, unpredictable
Install Netdata and get comprehensive alert coverage immediately - infrastructure, databases, web services, containers, Kubernetes. Auto-discovery applies alerts to new instances automatically as infrastructure grows.
60 seconds to full coverage
View Alert TemplatesKey advantages that transform alert management
400+ pre-configured alerts work in 60 seconds - infrastructure, databases, services, containers - with zero manual configuration required for 95% of use cases.
Know exactly which disk, interface, or container failed - eliminating investigation guesswork and enabling parallel triage across teams during incidents.
Alerts evaluate at the source with sub-2-second latency, working even during network partitions - no central bottleneck, no single point of failure.
Route alerts to the right team through their preferred channel with automatic deduplication - from SMS and Slack to PagerDuty and custom webhooks.
From alert to root cause in seconds - Anomaly Advisor correlates metrics across infrastructure, revealing cascading failures and blast radius automatically.
Auto-discovery applies alerts to new instances automatically as infrastructure grows - no manual per-host configuration, no query language to learn.
Per-second data collection with sub-2-second alert evaluation - catch transient issues and microbursts that minute-based monitoring misses entirely.
Alerts, metrics, logs, and AI investigation in single platform - eliminate tool sprawl and context switching during incidents for faster resolution.
18-model anomaly detection provides additional investigation signal - spot unusual patterns that complement traditional alert thresholds.

February 27, 2026
Connect AI coding agents like Claude Code, Codex, and Cursor to your entire infrastructure with a single endpoint. The Netdata Cloud MCP Server brings infrastructure-wide observability to any MCP-compatible AI tool.

February 3, 2026
Join Netdata at the Howard Conference and Expo 'Game On' event, February 24-26, 2026 in Fairhope, Alabama. Learn how real-time, high-fidelity monitoring helps you stay ahead of infrastructure challenges.

February 3, 2026
Visit Netdata at Tech Show London, March 4-5 at ExCeL London. Stop by Booth F223 in the Cloud & AI Infrastructure zone to see how high-fidelity monitoring transforms your infrastructure operations.