The only agent that thinks for itself

Autonomous Monitoring with self-learning AI built-in, operating independently across your entire stack.

Unlimited Metrics & Logs
Machine learning & MCP
5% CPU, 150MB RAM
3GB disk, >1 year retention
800+ integrations, zero config
Dashboards, alerts out of the box
> Discover Netdata Agents
Centralized metrics streaming and storage

Aggregate metrics from multiple agents into centralized Parent nodes for unified monitoring across your infrastructure.

Stream from unlimited agents
Long-term data retention
High availability clustering
Data replication & backup
Scalable architecture
Enterprise-grade security
> Learn about Parents
Fully managed cloud platform

Access your monitoring data from anywhere with our SaaS platform. No infrastructure to manage, automatic updates, and global availability.

Zero infrastructure management
99.9% uptime SLA
Global data centers
Automatic updates & patches
Enterprise SSO & RBAC
SOC2 & ISO certified
> Explore Netdata Cloud
Deploy Netdata Cloud in your infrastructure

Run the full Netdata Cloud platform on-premises for complete data sovereignty and compliance with your security policies.

Complete data sovereignty
Air-gapped deployment
Custom compliance controls
Private network integration
Dedicated support team
Kubernetes & Docker support
> Learn about Cloud On-Premises
Powerful, intuitive monitoring interface

Modern, responsive UI built for real-time troubleshooting with customizable dashboards and advanced visualization capabilities.

Real-time chart updates
Customizable dashboards
Dark & light themes
Advanced filtering & search
Responsive on all devices
Collaboration features
> Explore Netdata UI
Monitor on the go

Native iOS and Android apps bring full monitoring capabilities to your mobile device with real-time alerts and notifications.

iOS & Android apps
Push notifications
Touch-optimized interface
Offline data access
Biometric authentication
Widget support
> Download apps

Best energy efficiency

True real-time per-second

100% automated zero config

Centralized observability

Multi-year retention

High availability built-in

Zero maintenance

Always up-to-date

Enterprise security

Complete data control

Air-gap ready

Compliance certified

Millisecond responsiveness

Infinite zoom & pan

Works on any device

Native performance

Instant alerts

Monitor anywhere

80% Faster Incident Resolution
AI-powered troubleshooting from detection, to root cause and blast radius identification, to reporting.
True Real-Time and Simple, even at Scale
Linearly and infinitely scalable full-stack observability, that can be deployed even mid-crisis.
90% Cost Reduction, Full Fidelity
Instead of centralizing the data, Netdata distributes the code, eliminating pipelines and complexity.
Control Without Surrender
SOC 2 Type 2 certified with every metric kept on your infrastructure.
Integrations

800+ collectors and notification channels, auto-discovered and ready out of the box.

800+ data collectors
Auto-discovery & zero config
Cloud, infra, app protocols
Notifications out of the box
> Explore integrations
Real Results
46% Cost Reduction

Reduced monitoring costs by 46% while cutting staff overhead by 67%.

— Leonardo Antunez, Codyas

Zero Pipeline

No data shipping. No central storage costs. Query at the edge.

From Our Users
"Out-of-the-Box"

So many out-of-the-box features! I mostly don't have to develop anything.

— Simon Beginn, LANCOM Systems

No Query Language

Point-and-click troubleshooting. No PromQL, no LogQL, no learning curve.

Enterprise Ready
67% Less Staff, 46% Cost Cut

Enterprise efficiency without enterprise complexity—real ROI from day one.

— Leonardo Antunez, Codyas

SOC 2 Type 2 Certified

Zero data egress. Only metadata reaches the cloud. Your metrics stay on your infrastructure.

Full Coverage
800+ Collectors

Auto-discovered and configured. No manual setup required.

Any Notification Channel

Slack, PagerDuty, Teams, email, webhooks—all built-in.

From Our Users
"A Rare Unicorn"

Netdata gives more than you invest in it. A rare unicorn that obeys the Pareto rule.

— Eduard Porquet Mateu, TMB Barcelona

99% Downtime Reduction

Reduced website downtime by 99% and cloud bill by 30% using Netdata alerts.

— Falkland Islands Government

Real Savings
30% Cloud Cost Reduction

Optimized resource allocation based on Netdata alerts cut cloud spending by 30%.

— Falkland Islands Government

46% Cost Cut

Reduced monitoring staff by 67% while cutting operational costs by 46%.

— Codyas

Real Coverage
"Plugin for Everything"

Netdata has agent capacity or a plugin for everything, including Windows and Kubernetes.

— Eduard Porquet Mateu, TMB Barcelona

"Out-of-the-Box"

So many out-of-the-box features! I mostly don't have to develop anything.

— Simon Beginn, LANCOM Systems

Real Speed
Troubleshooting in 30 Seconds

From 2-3 minutes to 30 seconds—instant visibility into any node issue.

— Matthew Artist, Nodecraft

20% Downtime Reduction

20% less downtime and 40% budget optimization from out-of-the-box monitoring.

— Simon Beginn, LANCOM Systems

Pay per Node. Unlimited Everything Else.

One price per node. Unlimited metrics, logs, users, and retention. No per-GB surprises.

Free tier—forever
No metric limits or caps
Retention you control
Cancel anytime
> See pricing plans
What's Your Monitoring Really Costing You?

Most teams overpay by 40-60%. Let's find out why.

Expose hidden metric charges
Calculate tool consolidation
Customers report 30-67% savings
Results in under 60 seconds
> See what you're really paying
Your Infrastructure Is Unique. Let's Talk.

Because monitoring 10 nodes is different from monitoring 10,000.

On-prem & air-gapped deployment
Volume pricing & agreements
Architecture review for your scale
Compliance & security support
> Start a conversation
Monitoring That Sells Itself

Deploy in minutes. Impress clients in hours. Earn recurring revenue for years.

30-second live demos close deals
Zero config = zero support burden
Competitive margins & deal protection
Response in 48 hours
> Apply to partner
Per-Second Metrics at Homelab Prices

Same engine, same dashboards, same ML. Just priced for tinkerers.

Community: Free forever · 5 nodes · non-commercial
Homelab: $90/yr · unlimited nodes · fair usage
> Start monitoring your lab—free
$1,000 Per Referral. Unlimited Referrals.

Your colleagues get 10% off. You get 10% commission. Everyone wins.

10% of subscriptions, up to $1,000 each
Track earnings inside Netdata Cloud
PayPal/Venmo payouts in 3-4 weeks
No caps, no complexity
> Get your referral link
Cost Proof
40% Budget Optimization

"Netdata's significant positive impact" — LANCOM Systems

Calculate Your Savings

Compare vs Datadog, Grafana, Dynatrace

Savings Proof
46% Cost Reduction

"Cut costs by 46%, staff by 67%" — Codyas

30% Cloud Bill Savings

"Reduced cloud bill by 30%" — Falkland Islands Gov

Enterprise Proof
"Better Than Combined Alternatives"

"Better observability with Netdata than combining other tools." — TMB Barcelona

Real Engineers, <24h Response

DPA, SLAs, on-prem, volume pricing

Why Partners Win
Demo Live Infrastructure

One command, 30 seconds, real data—no sandbox needed

Zero Tickets, High Margins

Auto-config + per-node pricing = predictable profit

Homelab Ready
"Absolutely Incredible"

"We tested every monitoring system under the sun." — Benjamin Gabler, CEO Rocket.Net

76k+ GitHub Stars

3rd most starred monitoring project

Worth Recommending
Product That Delivers

Customers report 40-67% cost cuts, 99% downtime reduction

Zero Risk to Your Rep

Free tier lets them try before they buy

Never Fight Fires Alone

Docs, community, and expert help—pick your path to resolution.

Learn.netdata.cloud docs
Discord, Forums, GitHub
Premium support available
> Get answers now
60 Seconds to First Dashboard

One command to install. Zero config. 850+ integrations documented.

Linux, Windows, K8s, Docker
Auto-discovers your stack
> Start monitoring now
See Netdata in Action

Watch real-time monitoring in action—demos, tutorials, and engineering deep dives.

Product demos and walkthroughs
Real infrastructure, not staged
> Start with the 3-minute tour
Level Up Your Monitoring
Real problems. Real solutions. 112+ guides from basic monitoring to AI observability.
76,000+ Engineers Strong
615+ contributors. 1.5M daily downloads. One mission: simplify observability.
Per-Second. 90% Cheaper. Data Stays Home.
Side-by-side comparisons: costs, real-time granularity, and data sovereignty for every major tool.

See why teams switch from Datadog, Prometheus, Grafana, and more.

> Browse all comparisons
Edge-Native Observability, Born Open Source
Per-second visibility, ML on every metric, and data that never leaves your infrastructure.
Founded in 2016
615+ contributors worldwide
Remote-first, engineering-driven
Open source first
> Read our story
Promises We Publish—and Prove
12 principles backed by open code, independent validation, and measurable outcomes.
Open source, peer-reviewed
Zero config, instant value
Data sovereignty by design
Aligned pricing, no surprises
> See all 12 principles
Edge-Native, AI-Ready, 100% Open
76k+ stars. Full ML, AI, and automation—GPLv3+, not premium add-ons.
76,000+ GitHub stars
GPLv3+ licensed forever
ML on every metric, included
Zero vendor lock-in
> Explore our open source
Build Real-Time Observability for the World
Remote-first team shipping per-second monitoring with ML on every metric.
Remote-first, fully distributed
Open source (76k+ stars)
Challenging technical problems
Your code on millions of systems
> See open roles
Talk to a Netdata Human in <24 Hours
Sales, partnerships, press, or professional services—real engineers, fast answers.
Discuss your observability needs
Pricing and volume discounts
Partnership opportunities
Media and press inquiries
> Book a conversation
Your Data. Your Rules.
On-prem data, cloud control plane, transparent terms.
Trust & Scale
76,000+ GitHub Stars

One of the most popular open-source monitoring projects

SOC 2 Type 2 Certified

Enterprise-grade security and compliance

Data Sovereignty

Your metrics stay on your infrastructure

Validated
University of Amsterdam

"Most energy-efficient monitoring solution" — ICSOC 2023, peer-reviewed

ADASTEC (Autonomous Driving)

"Doesn't miss alerts—mission-critical trust for safety software"

Community Stats
615+ Contributors

Global community improving monitoring for everyone

1.5M+ Downloads/Day

Trusted by teams worldwide

GPLv3+ Licensed

Free forever, fully open source agent

Why Join?
Remote-First

Work from anywhere, async-friendly culture

Impact at Scale

Your work helps millions of systems

Compliance
SOC 2 Type 2

Audited security controls

GDPR Ready

Data stays on your infrastructure

eBPF Network Monitoring

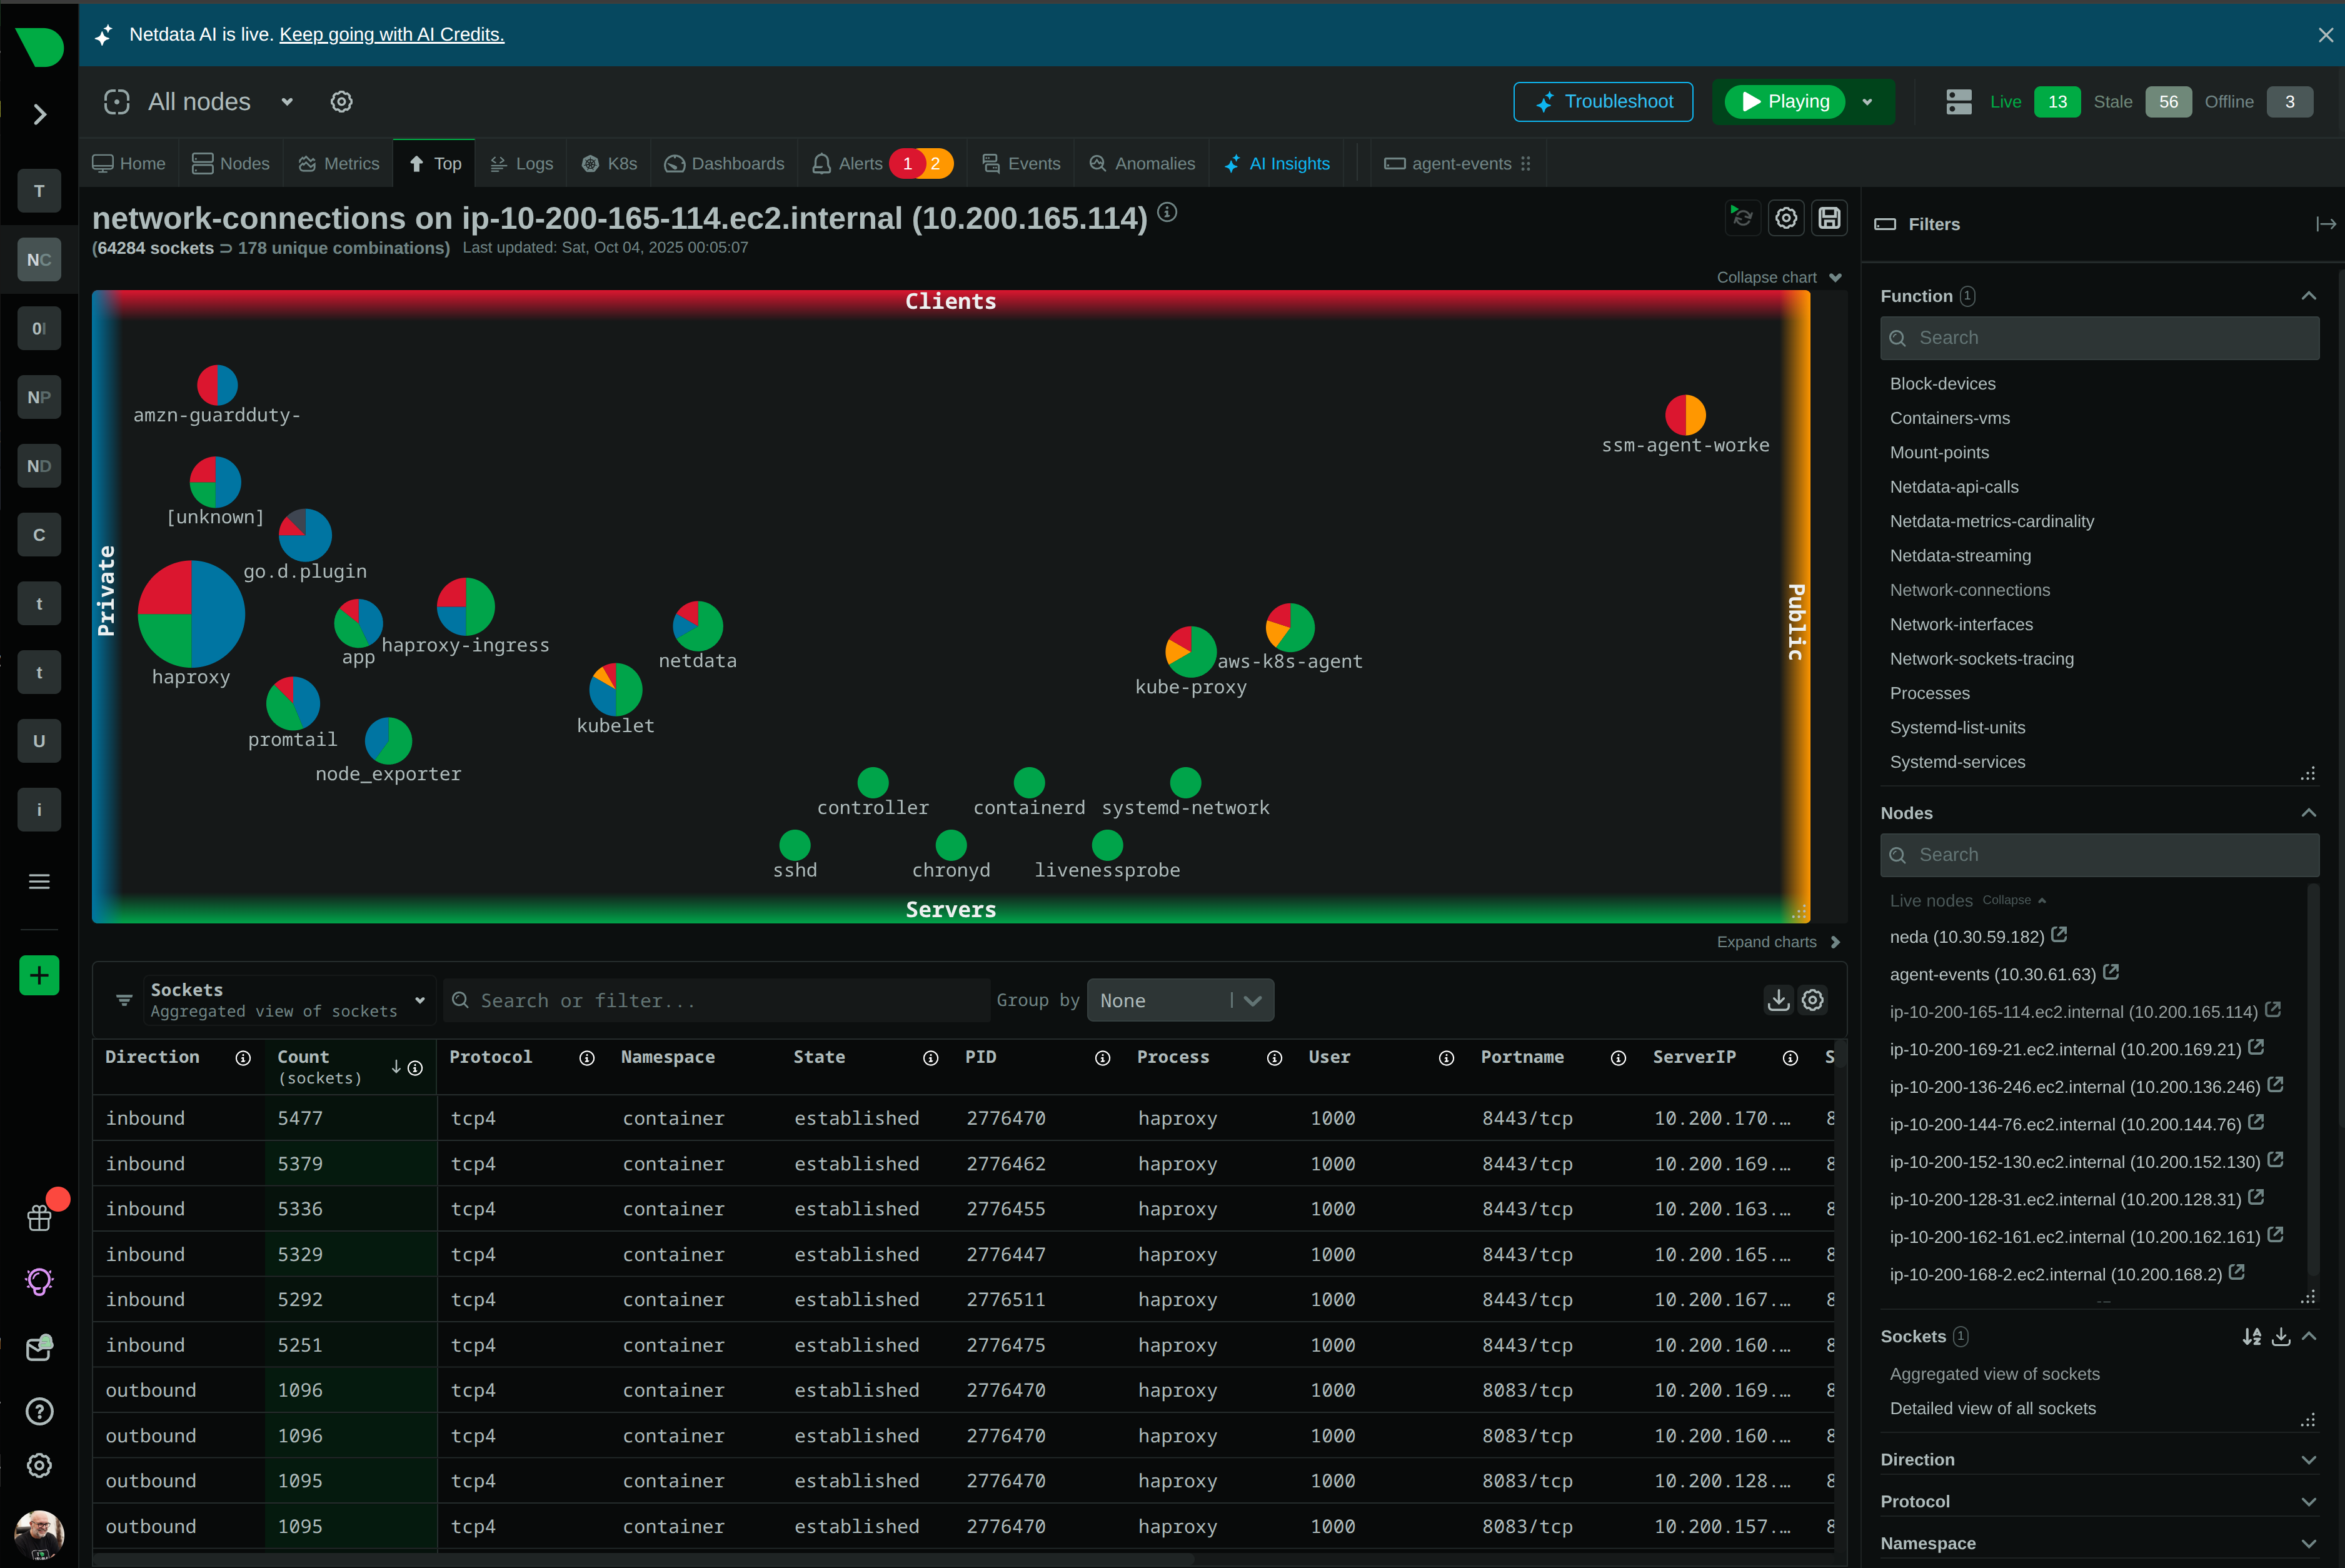
See Network Problems Before They Become Incidents

Netdata’s eBPF monitoring reveals kernel-level network behavior - per-second TCP/UDP bandwidth, connections, and retransmissions - directly in your infrastructure dashboard. Zero configuration. ML-based anomaly detection. AI-powered root cause analysis. All at predictable per-node pricing.

Background Hero

Kernel-Level Visibility Meets Operational Simplicity

eBPF network monitoring designed for infrastructure teams, not kernel programmers

Instant Network Clarity

Auto-discovered TCP/UDP metrics appear in dashboards within 60 seconds of installation. No kernel programming. No eBPF expertise. Just visibility.

Unified Infrastructure View

Network metrics integrated with CPU, memory, disk, and application monitoring. Correlate bandwidth spikes with system events automatically.

ML-Powered Anomaly Detection

18 ML models per network metric detect unusual patterns in real-time. 99% false positive reduction through multi-model consensus - no manual threshold tuning.

Predictable Economics

Flat per-node pricing with unlimited network metrics. No charges for connection count or data volume. 90% cost reduction vs commercial platforms.

Complete Historical Context

Per-second network data stored for days, weeks, or years. Multi-tier retention enables forensic analysis and capacity planning without sampling.

Data Sovereignty by Design

All network telemetry stays on-premises under your control. Zero cloud egress costs. SOC 2 Type 2 certified architecture.

Trusted by operations teams managing critical infrastructure worldwide

Transform Network Troubleshooting from Guesswork to Precision

Correlate Network Issues with Infrastructure Events Instantly

When bandwidth spikes or retransmissions surge, see exactly what triggered it - memory pressure, CPU saturation, disk I/O storms - on the same dashboard. Netdata’s unified observability eliminates the manual correlation work that wastes hours during incidents.

80% MTTR reduction

See Unified Observability

Correlate Network Issues with Infrastructure Events Instantly

Monitor Host-Level Network Activity Across Your Infrastructure

Track bandwidth, connections, and retransmissions at the kernel level on Linux hosts. eBPF provides deep visibility into network behavior from bare metal servers and VMs. For container environments, Netdata combines eBPF with cgroups data for comprehensive network observability.

Per-second granularity

Explore Linux Monitoring

Monitor Host-Level Network Activity Across Your Infrastructure

Detect Network Anomalies Before They Impact Users

Machine learning analyzes every network metric - bandwidth, connections, retransmissions - detecting subtle degradations invisible to static thresholds. When patterns deviate from learned baselines, Anomaly Advisor surfaces the root cause in the top 30-50 metrics, cutting investigation time from hours to minutes.

99% false positive reduction

Learn About ML Anomaly Detection

Detect Network Anomalies Before They Impact Users

Ask AI Why Network Issues Happen, Get Answers in Plain Language

No more deciphering kernel traces or eBPF program outputs. Ask Netdata’s AI Co-Engineer questions like ‘Why are retransmissions spiking?’ and receive contextual explanations based on your actual infrastructure behavior - correlating network patterns with deployments, resource constraints, and system events.

Natural language troubleshooting

Discover AI Co-Engineer

Ask AI Why Network Issues Happen, Get Answers in Plain Language

Store Years of Network Data in Gigabytes, Not Terabytes

Industry-leading compression (0.6 bytes per sample) enables long-term retention without storage explosion. Multi-tier architecture maintains per-second granularity for recent data while automatically aggregating to per-minute and per-hour for historical analysis - all updated in parallel during collection.

40× storage efficiency

Understand Tiered Retention

Store Years of Network Data in Gigabytes, Not Terabytes

Production-Optimized eBPF with Minimal System Impact

Netdata’s eBPF implementation uses <5% CPU and 150-200MB RAM while collecting per-second network metrics. University of Amsterdam research (ICSOC 2023) validated Netdata as the monitoring solution with the lowest CPU and memory overhead. Intelligent kernel feature detection automatically uses optimal collection mode - CO-RE, trampolines, or legacy kprobes.

<5% CPU overhead

See Resource Efficiency

Production-Optimized eBPF with Minimal System Impact

How Netdata eBPF Compares

Kernel-Level Network Visibility Without the Trade-Offs

Traditional eBPF monitoring forces you to choose between simplicity, cost, and completeness. Netdata delivers all three by embedding network visibility into infrastructure observability - not as a separate specialized tool.

Capability

Netdata eBPF

Traditional eBPF Tools

Configuration Required

✅ Zero
Auto-discovery, instant dashboards, no setup

⚠️ Extensive
Manual service discovery, custom dashboards

Data Retention

✅ Unlimited
Years of per-second data on-premises

⚠️ Limited
Hours to days, vendor-stored

Cost Model

✅ Predictable
Flat per-node, unlimited metrics

⚠️ Variable
Per-cluster, per-host, or volume-based

ML Anomaly Detection

✅ Included
18 models per metric, automatic

❌ Not Available
Manual threshold configuration only

Infrastructure Integration

✅ Native
Unified with CPU, memory, disk, apps

⚠️ Separate
Network-only tool, requires correlation

Platform Support

✅ Broad
Bare metal, VMs, Linux kernel ≥4.11

⚠️ Limited
Specific environments only

Data Sovereignty

✅ Complete
All telemetry stays on-premises

⚠️ Partial
Often requires vendor cloud storage

Query Interface

✅ Point-and-Click
No query language required

⚠️ Complex
PromQL, PxL, or custom scripting

Resource Overhead

✅ Minimal
<5% CPU, 150-200MB RAM total

⚠️ Significant
Higher CPU and memory per cluster

AI Troubleshooting

✅ Integrated
Natural language root cause analysis

❌ Not Available
Manual investigation required

See Complete Feature Comparison →

eBPF Network Monitoring Across Your Linux Infrastructure

Complete L4 Network Visibility

Track bandwidth sent and received, active connections, TCP retransmissions, and connection states - all at per-second granularity. Automatic breakdown by application and systemd service.

Per-second granularity, zero sampling

Explore Metrics Management
TCP/UDP Metrics Dashboard

Why Operations Teams Choose Netdata for eBPF Network Monitoring

Kernel-level visibility without kernel-level complexity - embedded in the infrastructure observability platform you already trust

Frequently Asked Questions