The only agent that thinks for itself

Autonomous Monitoring with self-learning AI built-in, operating independently across your entire stack.

Unlimited Metrics & Logs
Machine learning & MCP
5% CPU, 150MB RAM
3GB disk, >1 year retention
800+ integrations, zero config
Dashboards, alerts out of the box
> Discover Netdata Agents
Centralized metrics streaming and storage

Aggregate metrics from multiple agents into centralized Parent nodes for unified monitoring across your infrastructure.

Stream from unlimited agents
Long-term data retention
High availability clustering
Data replication & backup
Scalable architecture
Enterprise-grade security
> Learn about Parents
Fully managed cloud platform

Access your monitoring data from anywhere with our SaaS platform. No infrastructure to manage, automatic updates, and global availability.

Zero infrastructure management
99.9% uptime SLA
Global data centers
Automatic updates & patches
Enterprise SSO & RBAC
SOC2 & ISO certified
> Explore Netdata Cloud
Deploy Netdata Cloud in your infrastructure

Run the full Netdata Cloud platform on-premises for complete data sovereignty and compliance with your security policies.

Complete data sovereignty
Air-gapped deployment
Custom compliance controls
Private network integration
Dedicated support team
Kubernetes & Docker support
> Learn about Cloud On-Premises
Powerful, intuitive monitoring interface

Modern, responsive UI built for real-time troubleshooting with customizable dashboards and advanced visualization capabilities.

Real-time chart updates
Customizable dashboards
Dark & light themes
Advanced filtering & search
Responsive on all devices
Collaboration features
> Explore Netdata UI
Monitor on the go

Native iOS and Android apps bring full monitoring capabilities to your mobile device with real-time alerts and notifications.

iOS & Android apps
Push notifications
Touch-optimized interface
Offline data access
Biometric authentication
Widget support
> Download apps

Best energy efficiency

True real-time per-second

100% automated zero config

Centralized observability

Multi-year retention

High availability built-in

Zero maintenance

Always up-to-date

Enterprise security

Complete data control

Air-gap ready

Compliance certified

Millisecond responsiveness

Infinite zoom & pan

Works on any device

Native performance

Instant alerts

Monitor anywhere

80% Faster Incident Resolution
AI-powered troubleshooting from detection, to root cause and blast radius identification, to reporting.
True Real-Time and Simple, even at Scale
Linearly and infinitely scalable full-stack observability, that can be deployed even mid-crisis.
90% Cost Reduction, Full Fidelity
Instead of centralizing the data, Netdata distributes the code, eliminating pipelines and complexity.
Control Without Surrender
SOC 2 Type 2 certified with every metric kept on your infrastructure.
Integrations

800+ collectors and notification channels, auto-discovered and ready out of the box.

800+ data collectors
Auto-discovery & zero config
Cloud, infra, app protocols
Notifications out of the box
> Explore integrations
Real Results
46% Cost Reduction

Reduced monitoring costs by 46% while cutting staff overhead by 67%.

— Leonardo Antunez, Codyas

Zero Pipeline

No data shipping. No central storage costs. Query at the edge.

From Our Users
"Out-of-the-Box"

So many out-of-the-box features! I mostly don't have to develop anything.

— Simon Beginn, LANCOM Systems

No Query Language

Point-and-click troubleshooting. No PromQL, no LogQL, no learning curve.

Enterprise Ready
67% Less Staff, 46% Cost Cut

Enterprise efficiency without enterprise complexity—real ROI from day one.

— Leonardo Antunez, Codyas

SOC 2 Type 2 Certified

Zero data egress. Only metadata reaches the cloud. Your metrics stay on your infrastructure.

Full Coverage
800+ Collectors

Auto-discovered and configured. No manual setup required.

Any Notification Channel

Slack, PagerDuty, Teams, email, webhooks—all built-in.

From Our Users
"A Rare Unicorn"

Netdata gives more than you invest in it. A rare unicorn that obeys the Pareto rule.

— Eduard Porquet Mateu, TMB Barcelona

99% Downtime Reduction

Reduced website downtime by 99% and cloud bill by 30% using Netdata alerts.

— Falkland Islands Government

Real Savings
30% Cloud Cost Reduction

Optimized resource allocation based on Netdata alerts cut cloud spending by 30%.

— Falkland Islands Government

46% Cost Cut

Reduced monitoring staff by 67% while cutting operational costs by 46%.

— Codyas

Real Coverage
"Plugin for Everything"

Netdata has agent capacity or a plugin for everything, including Windows and Kubernetes.

— Eduard Porquet Mateu, TMB Barcelona

"Out-of-the-Box"

So many out-of-the-box features! I mostly don't have to develop anything.

— Simon Beginn, LANCOM Systems

Real Speed
Troubleshooting in 30 Seconds

From 2-3 minutes to 30 seconds—instant visibility into any node issue.

— Matthew Artist, Nodecraft

20% Downtime Reduction

20% less downtime and 40% budget optimization from out-of-the-box monitoring.

— Simon Beginn, LANCOM Systems

Pay per Node. Unlimited Everything Else.

One price per node. Unlimited metrics, logs, users, and retention. No per-GB surprises.

Free tier—forever
No metric limits or caps
Retention you control
Cancel anytime
> See pricing plans
What's Your Monitoring Really Costing You?

Most teams overpay by 40-60%. Let's find out why.

Expose hidden metric charges
Calculate tool consolidation
Customers report 30-67% savings
Results in under 60 seconds
> See what you're really paying
Your Infrastructure Is Unique. Let's Talk.

Because monitoring 10 nodes is different from monitoring 10,000.

On-prem & air-gapped deployment
Volume pricing & agreements
Architecture review for your scale
Compliance & security support
> Start a conversation
Monitoring That Sells Itself

Deploy in minutes. Impress clients in hours. Earn recurring revenue for years.

30-second live demos close deals
Zero config = zero support burden
Competitive margins & deal protection
Response in 48 hours
> Apply to partner
Per-Second Metrics at Homelab Prices

Same engine, same dashboards, same ML. Just priced for tinkerers.

Community: Free forever · 5 nodes · non-commercial
Homelab: $90/yr · unlimited nodes · fair usage
> Start monitoring your lab—free
$1,000 Per Referral. Unlimited Referrals.

Your colleagues get 10% off. You get 10% commission. Everyone wins.

10% of subscriptions, up to $1,000 each
Track earnings inside Netdata Cloud
PayPal/Venmo payouts in 3-4 weeks
No caps, no complexity
> Get your referral link
Cost Proof
40% Budget Optimization

"Netdata's significant positive impact" — LANCOM Systems

Calculate Your Savings

Compare vs Datadog, Grafana, Dynatrace

Savings Proof
46% Cost Reduction

"Cut costs by 46%, staff by 67%" — Codyas

30% Cloud Bill Savings

"Reduced cloud bill by 30%" — Falkland Islands Gov

Enterprise Proof
"Better Than Combined Alternatives"

"Better observability with Netdata than combining other tools." — TMB Barcelona

Real Engineers, <24h Response

DPA, SLAs, on-prem, volume pricing

Why Partners Win
Demo Live Infrastructure

One command, 30 seconds, real data—no sandbox needed

Zero Tickets, High Margins

Auto-config + per-node pricing = predictable profit

Homelab Ready
"Absolutely Incredible"

"We tested every monitoring system under the sun." — Benjamin Gabler, CEO Rocket.Net

76k+ GitHub Stars

3rd most starred monitoring project

Worth Recommending
Product That Delivers

Customers report 40-67% cost cuts, 99% downtime reduction

Zero Risk to Your Rep

Free tier lets them try before they buy

Never Fight Fires Alone

Docs, community, and expert help—pick your path to resolution.

Learn.netdata.cloud docs
Discord, Forums, GitHub
Premium support available
> Get answers now
60 Seconds to First Dashboard

One command to install. Zero config. 850+ integrations documented.

Linux, Windows, K8s, Docker
Auto-discovers your stack
> Start monitoring now
See Netdata in Action

Watch real-time monitoring in action—demos, tutorials, and engineering deep dives.

Product demos and walkthroughs
Real infrastructure, not staged
> Start with the 3-minute tour
Level Up Your Monitoring
Real problems. Real solutions. 112+ guides from basic monitoring to AI observability.
76,000+ Engineers Strong
615+ contributors. 1.5M daily downloads. One mission: simplify observability.
Per-Second. 90% Cheaper. Data Stays Home.
Side-by-side comparisons: costs, real-time granularity, and data sovereignty for every major tool.

See why teams switch from Datadog, Prometheus, Grafana, and more.

> Browse all comparisons
Edge-Native Observability, Born Open Source
Per-second visibility, ML on every metric, and data that never leaves your infrastructure.
Founded in 2016
615+ contributors worldwide
Remote-first, engineering-driven
Open source first
> Read our story
Promises We Publish—and Prove
12 principles backed by open code, independent validation, and measurable outcomes.
Open source, peer-reviewed
Zero config, instant value
Data sovereignty by design
Aligned pricing, no surprises
> See all 12 principles
Edge-Native, AI-Ready, 100% Open
76k+ stars. Full ML, AI, and automation—GPLv3+, not premium add-ons.
76,000+ GitHub stars
GPLv3+ licensed forever
ML on every metric, included
Zero vendor lock-in
> Explore our open source
Build Real-Time Observability for the World
Remote-first team shipping per-second monitoring with ML on every metric.
Remote-first, fully distributed
Open source (76k+ stars)
Challenging technical problems
Your code on millions of systems
> See open roles
Talk to a Netdata Human in <24 Hours
Sales, partnerships, press, or professional services—real engineers, fast answers.
Discuss your observability needs
Pricing and volume discounts
Partnership opportunities
Media and press inquiries
> Book a conversation
Your Data. Your Rules.
On-prem data, cloud control plane, transparent terms.
Trust & Scale
76,000+ GitHub Stars

One of the most popular open-source monitoring projects

SOC 2 Type 2 Certified

Enterprise-grade security and compliance

Data Sovereignty

Your metrics stay on your infrastructure

Validated
University of Amsterdam

"Most energy-efficient monitoring solution" — ICSOC 2023, peer-reviewed

ADASTEC (Autonomous Driving)

"Doesn't miss alerts—mission-critical trust for safety software"

Community Stats
615+ Contributors

Global community improving monitoring for everyone

1.5M+ Downloads/Day

Trusted by teams worldwide

GPLv3+ Licensed

Free forever, fully open source agent

Why Join?
Remote-First

Work from anywhere, async-friendly culture

Impact at Scale

Your work helps millions of systems

Compliance
SOC 2 Type 2

Audited security controls

GDPR Ready

Data stays on your infrastructure

Zero-Pipeline Log Management

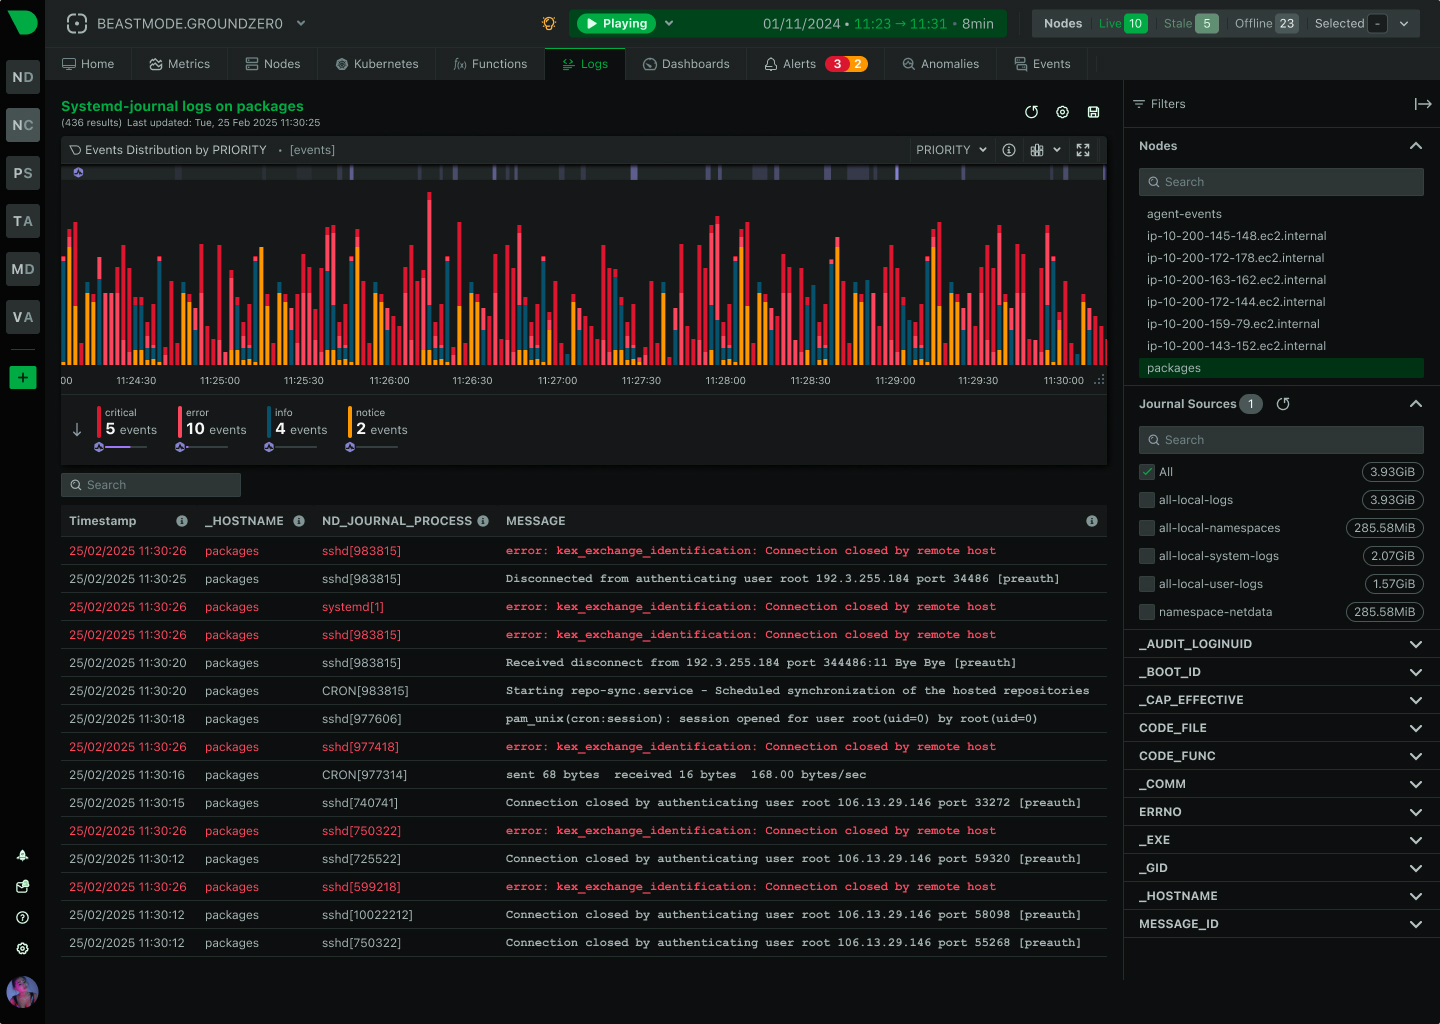
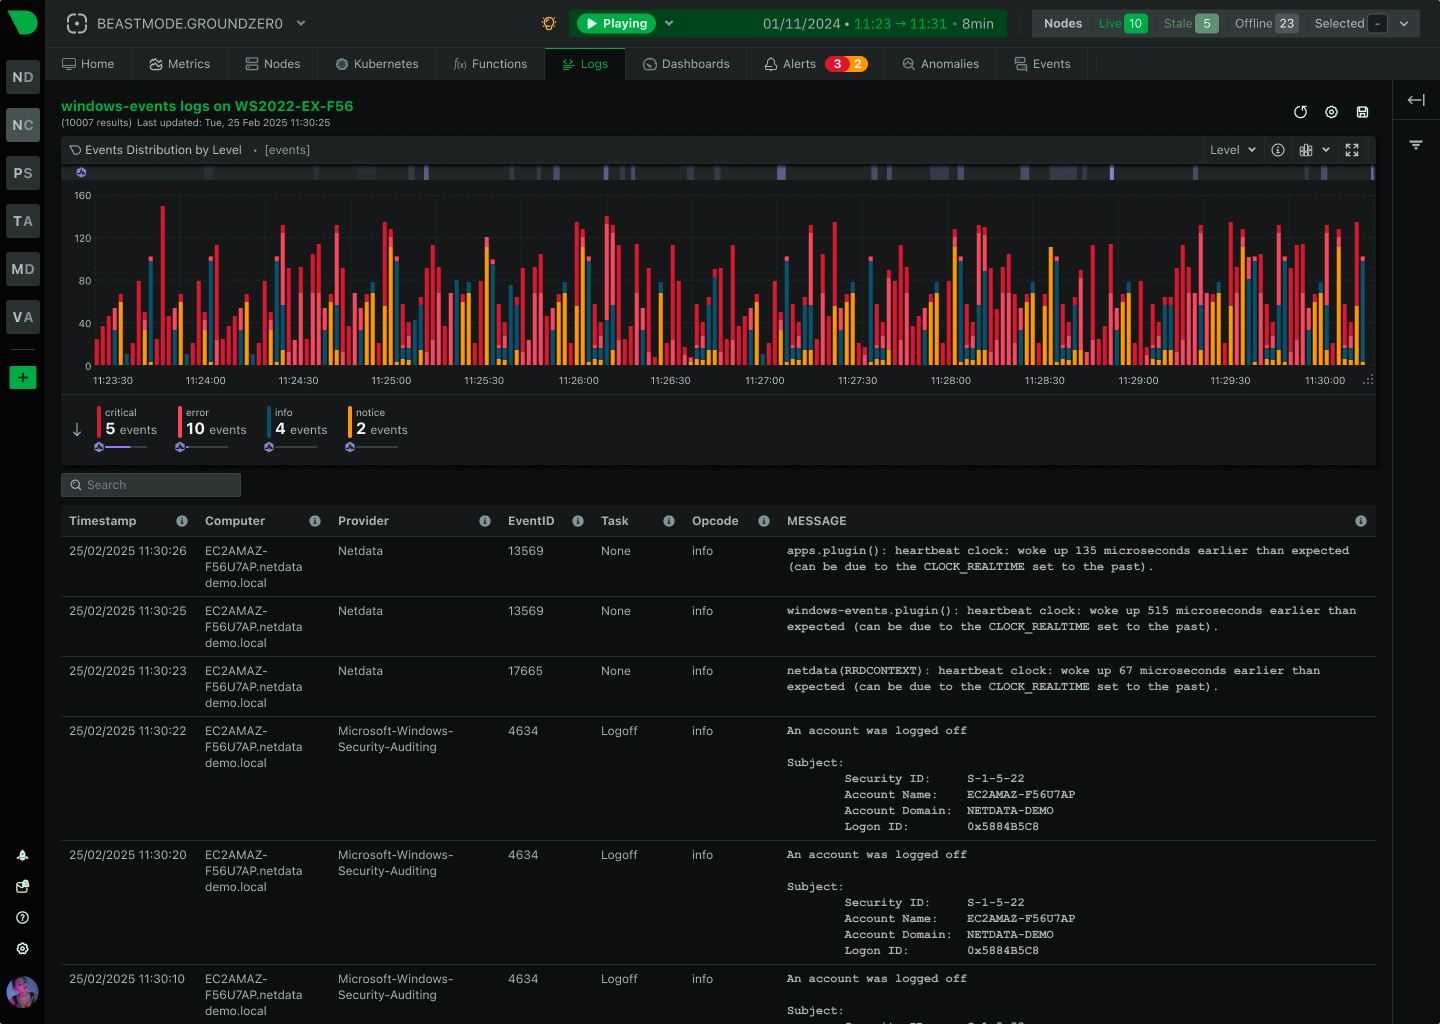
Query Logs Directly Where They Live

Eliminate expensive centralized clusters and volume-based pricing. Netdata queries systemd-journal and Windows Event Logs directly at the edge - delivering 90% cost reduction, sub-second queries, and complete data sovereignty without sacrificing visibility.

Background Hero

Transform Log Management Economics

Revolutionary edge-based architecture eliminates the entire centralized pipeline

90% Cost Reduction

Predictable per-node pricing eliminates volume-based charges. No ingestion fees, no indexing clusters, no surprise bills - just predictable costs that scale with infrastructure.

Sub-Second Queries

Instant responses on million+ entry datasets. Direct file access with OS-optimized memory mapping delivers immediate answers when every second counts during incidents.

Superior Analysis Accuracy

Analyze significantly more entries before sampling. Every field is indexed automatically with unlimited cardinality - trust your data during critical troubleshooting.

Complete Data Sovereignty

Logs never leave your infrastructure. Zero cloud storage, cryptographic tamper detection, and compliance-by-design satisfy GDPR, HIPAA, and PCI DSS automatically.

Native Metrics Correlation

Click any metric anomaly to see related log errors instantly. Same agent, same timeline, zero timestamp matching - unified observability without integration complexity.

Deploy in 60 Seconds

Auto-discovers systemd-journal and Windows Event Logs. Zero configuration, no schema design, no query languages - from installation to insight in under a minute.

Trusted by operations teams worldwide

See the Complete Picture Without Tool Switching

Eliminate Cost Explosions with Predictable Pricing

Traditional platforms charge per-GB for ingestion and indexing - forcing you to sample logs or face exponential costs. Netdata’s predictable per-node pricing means collecting more logs costs the same. Scale your infrastructure without cost anxiety, maintaining 100% visibility while achieving 90% savings compared to volume-based platforms.

90% cost reduction

Calculate Your Savings

Eliminate Cost Explosions with Predictable Pricing

Troubleshoot Faster with Real-Time Queries

Traditional platforms take seconds to minutes for queries on multi-TB datasets - extending MTTR during critical incidents. Netdata delivers sub-second responses by querying logs directly where they live using memory-mapped I/O and OS page cache optimization. Engineers iterate rapidly during troubleshooting instead of waiting for results, reducing cognitive load and accelerating resolution. Real-time streaming with PLAY mode lets you watch logs flow as events happen.

Sub-second queries

See Performance Benchmarks

Troubleshoot Faster with Real-Time Queries

Trust Your Data with Superior Analysis Accuracy

Traditional platforms sample limited log entries before timeout, creating statistical uncertainty in results. Netdata evaluates significantly more data - achieving dramatically tighter confidence intervals for accurate incident analysis. Every field is indexed automatically with unlimited high-cardinality support, so dynamic fields like container IDs and session tokens work natively. During incidents, you see actual prevalence of issues, not rough estimates.

All fields indexed automatically

Learn About Intelligent Sampling

Trust Your Data with Superior Analysis Accuracy

Maintain Complete Data Sovereignty by Design

Compliance teams reject tools requiring log data egress - and for good reason. Data breaches carry massive costs, and GDPR fines can reach up to 4% of global revenue. Netdata keeps all log data on your infrastructure with zero cloud storage. Forward Secure Sealing provides cryptographic tamper detection satisfying HIPAA, PCI DSS, and SOX retention requirements automatically. Your logs, your infrastructure, your control.

Zero data egress

Explore Compliance Features

Maintain Complete Data Sovereignty by Design

Unify Observability with Native Correlation

When metrics live in one tool and logs in another, engineers waste significant time managing observability infrastructure and correlating data manually. Netdata collects metrics and logs from the same agent, providing unified timelines with zero timestamp matching. Click any metric anomaly to query logs for the same timeframe instantly - same source, same filtering model, single interface. Eliminate multiple separate platforms while accelerating troubleshooting from symptom to root cause.

Single unified platform

See Unified Observability

Unify Observability with Native Correlation

Deploy in Minutes with Zero Configuration

Most organizations struggle with initial observability tool setup, spending more time configuring than monitoring. Netdata auto-discovers systemd-journal on Linux and Windows Event Logs automatically - no schema configuration, no index mapping, no query languages. Dashboards generate algorithmically based on available fields. Engineers get powerful log analysis capabilities within 60 seconds of installation, focusing on solving problems instead of maintaining log infrastructure.

60-second deployment

Start Free Trial

Deploy in Minutes with Zero Configuration

How Netdata Compares

Zero-Pipeline Architecture vs Traditional Centralized Platforms

See how Netdata’s revolutionary edge-based approach eliminates the cost, complexity, and performance bottlenecks of traditional log management platforms.

Capability

Netdata

Traditional Platforms

Architecture

✅ Ideal
Query logs directly where generated

⚠️ Limited
Ship all logs to central databases

Pricing Model

✅ Ideal
Predictable per-node, no volume charges

❌ Expensive
Volume-based ingestion and indexing fees

Query Performance

✅ Ideal
Sub-second via direct file access

⚠️ Limited
Network latency plus cluster processing

Sampling Accuracy

✅ Advanced
Significantly more entries analyzed

⚠️ Limited
Limited entries before timeout

Field Indexing

✅ Ideal
Every field indexed, unlimited cardinality

⚠️ Limited
Schema configuration, cardinality limits

Data Location

✅ Ideal
On-premises always, zero egress

❌ Challenging
Data leaves infrastructure

Setup Complexity

✅ Ideal
60-second auto-discovery deployment

⚠️ Complex
Cluster setup, schema design, tuning

Metrics Correlation

✅ Ideal
Same agent, automatic correlation

⚠️ Manual
Separate systems, timestamp matching

Operational Overhead

✅ Ideal
No clusters, shards, or indexing jobs

❌ Complex
Cluster tuning, capacity planning

Compliance Features

✅ Advanced
Forward Secure Sealing, cryptographic proof

⚠️ Basic
Write-once without tamper evidence

See Detailed Comparison

Comprehensive Log Management Capabilities

systemd-journal Native Integration

Query systemd-journal files directly with libsystemd APIs. Every field indexed automatically, unlimited cardinality, real-time streaming with PLAY mode. Memory-mapped I/O delivers sub-second queries on million+ entry datasets.

Zero pipeline architecture

Explore Linux Logging
Linux Logs Dashboard

Key Advantages of Zero-Pipeline Log Management

Revolutionary edge-based architecture delivers superior economics and performance

Frequently Asked Questions