See What Matters, Ignore the Noise
Get 400+ intelligent alerts working in 60 seconds - with component-level precision that pinpoints exactly what failed and where, plus edge-native evaluation that works even during network partitions.


Get 400+ intelligent alerts working in 60 seconds - with component-level precision that pinpoints exactly what failed and where, plus edge-native evaluation that works even during network partitions.
From installation to insight in under a minute
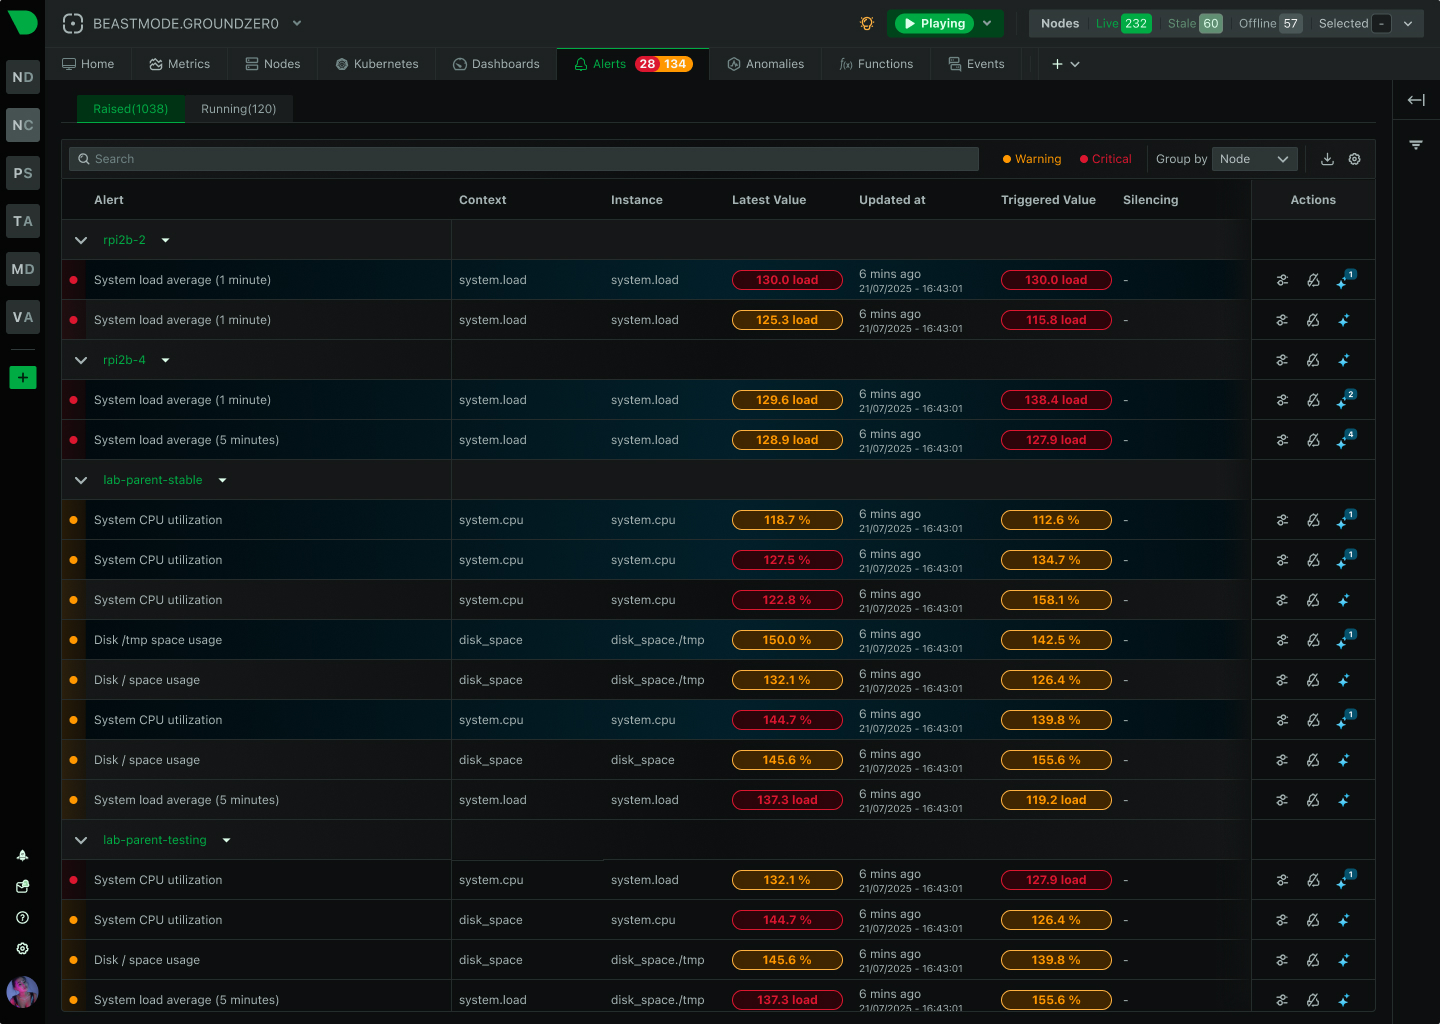
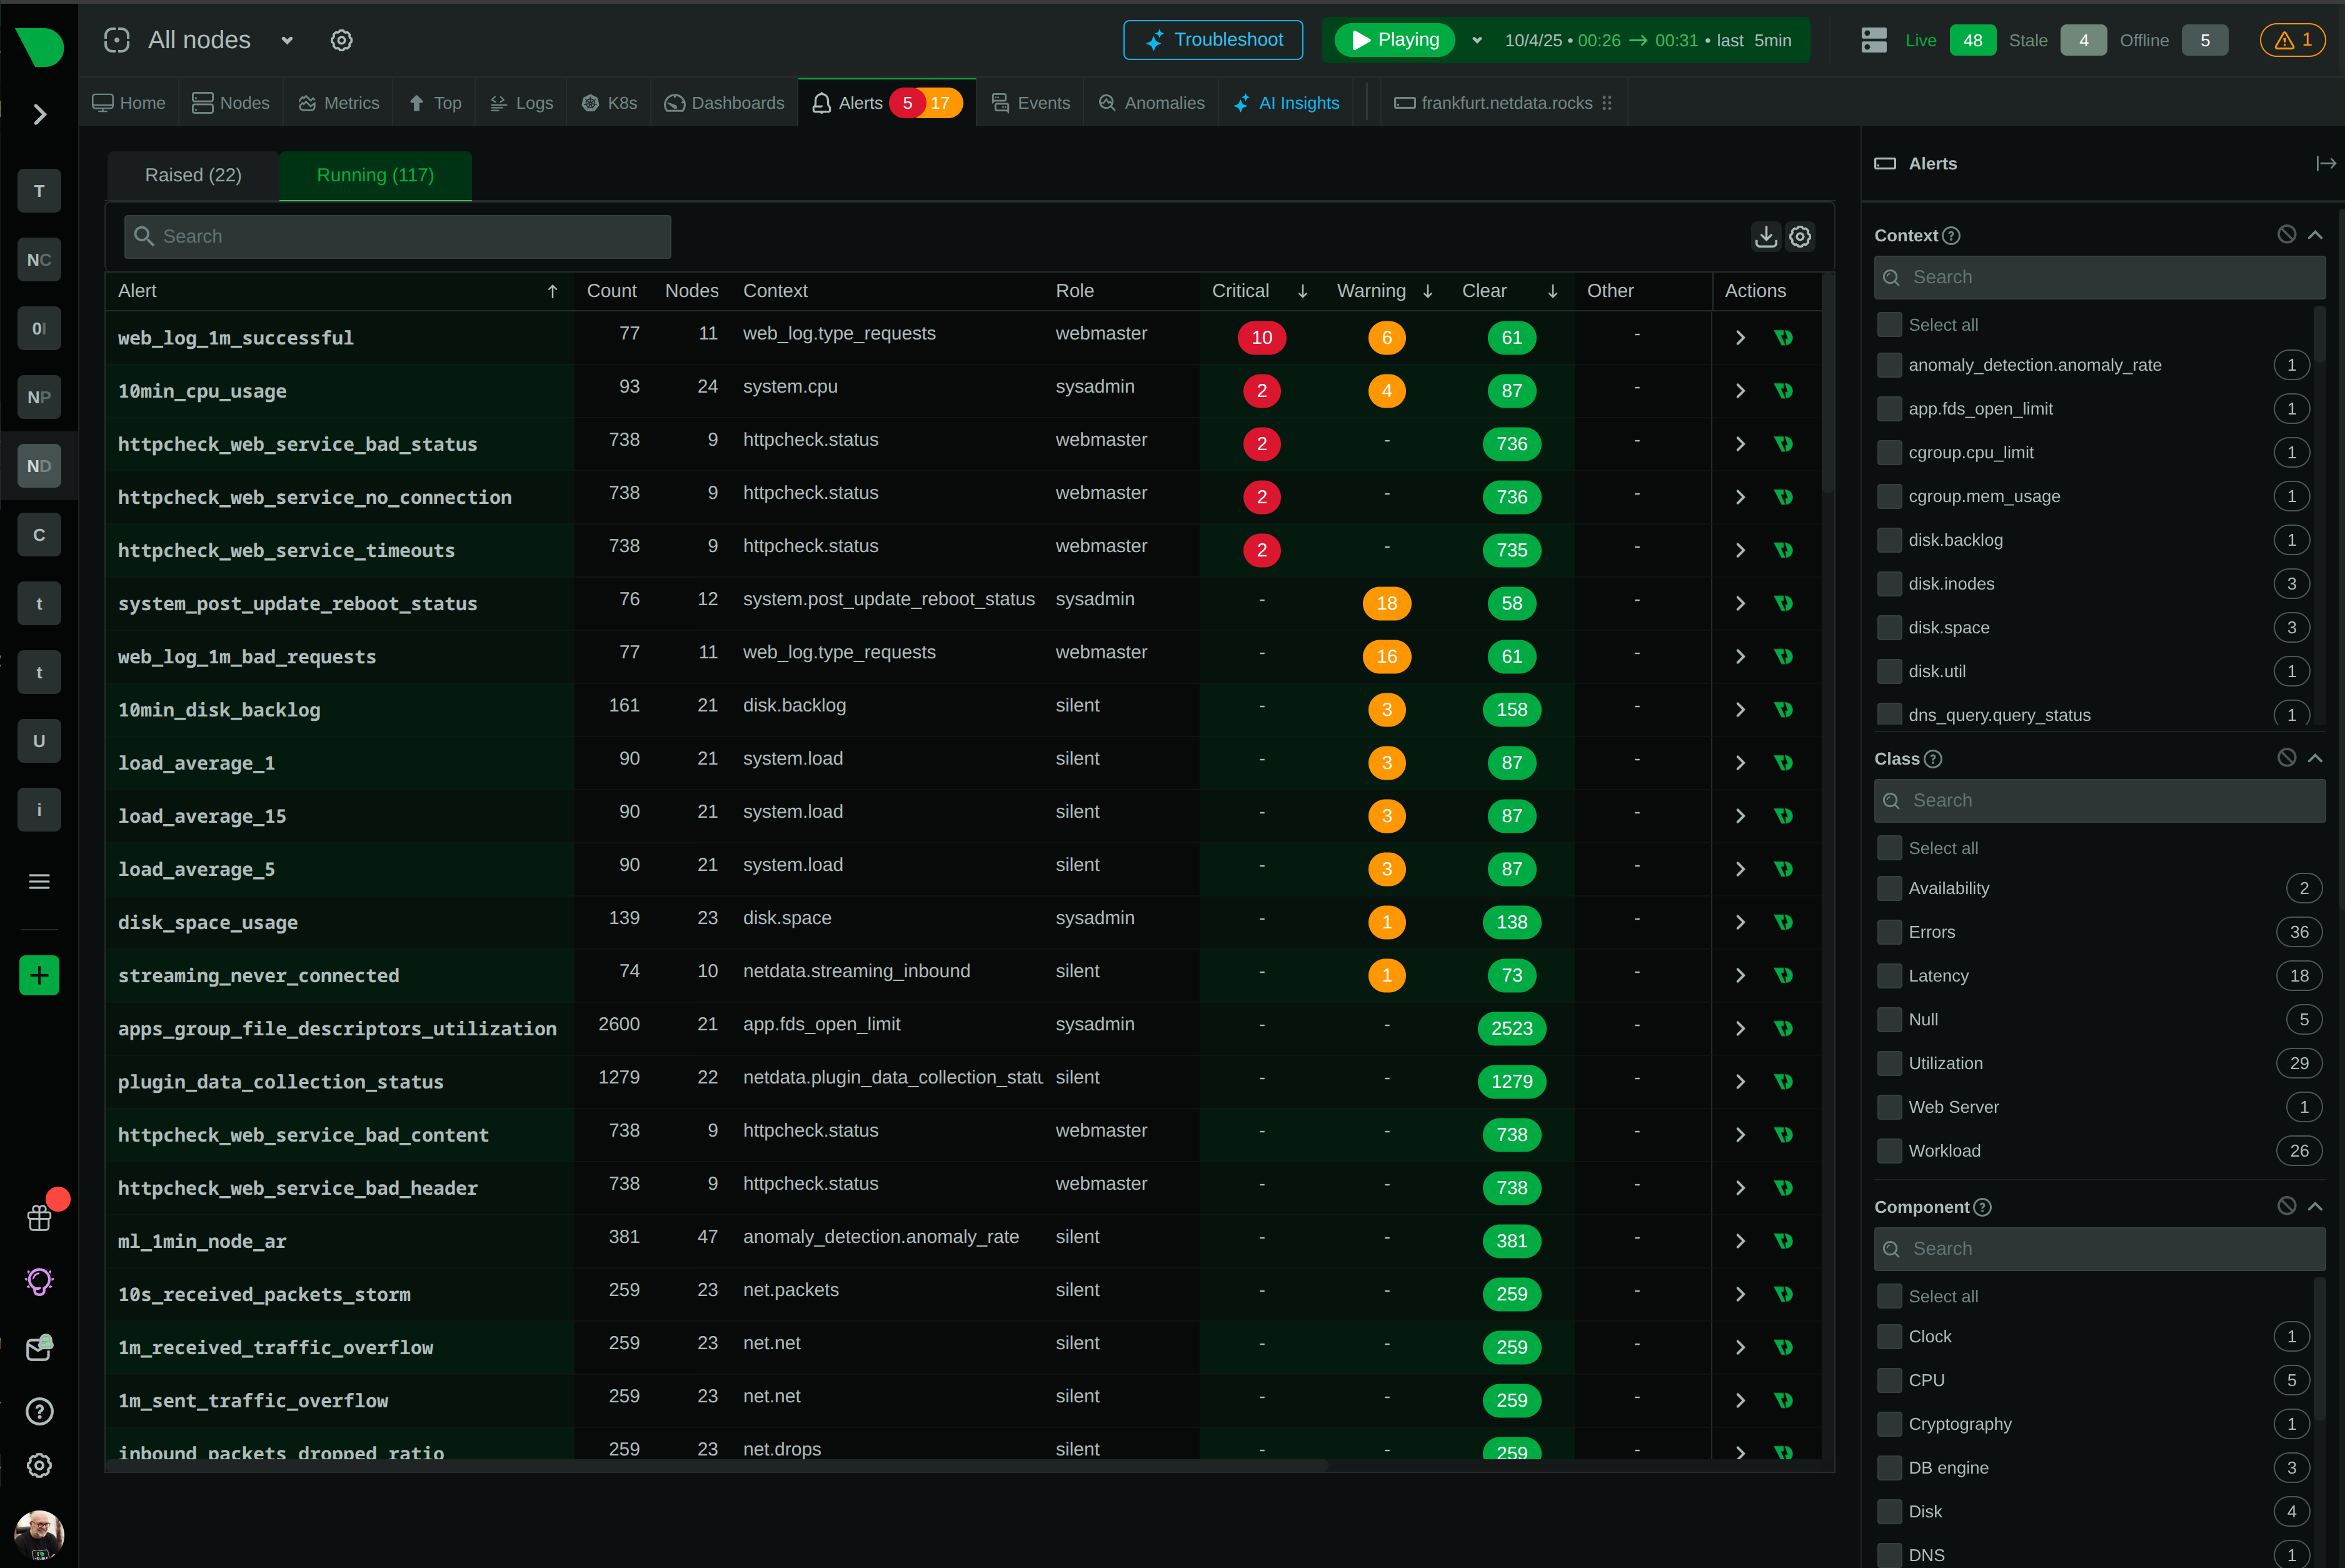
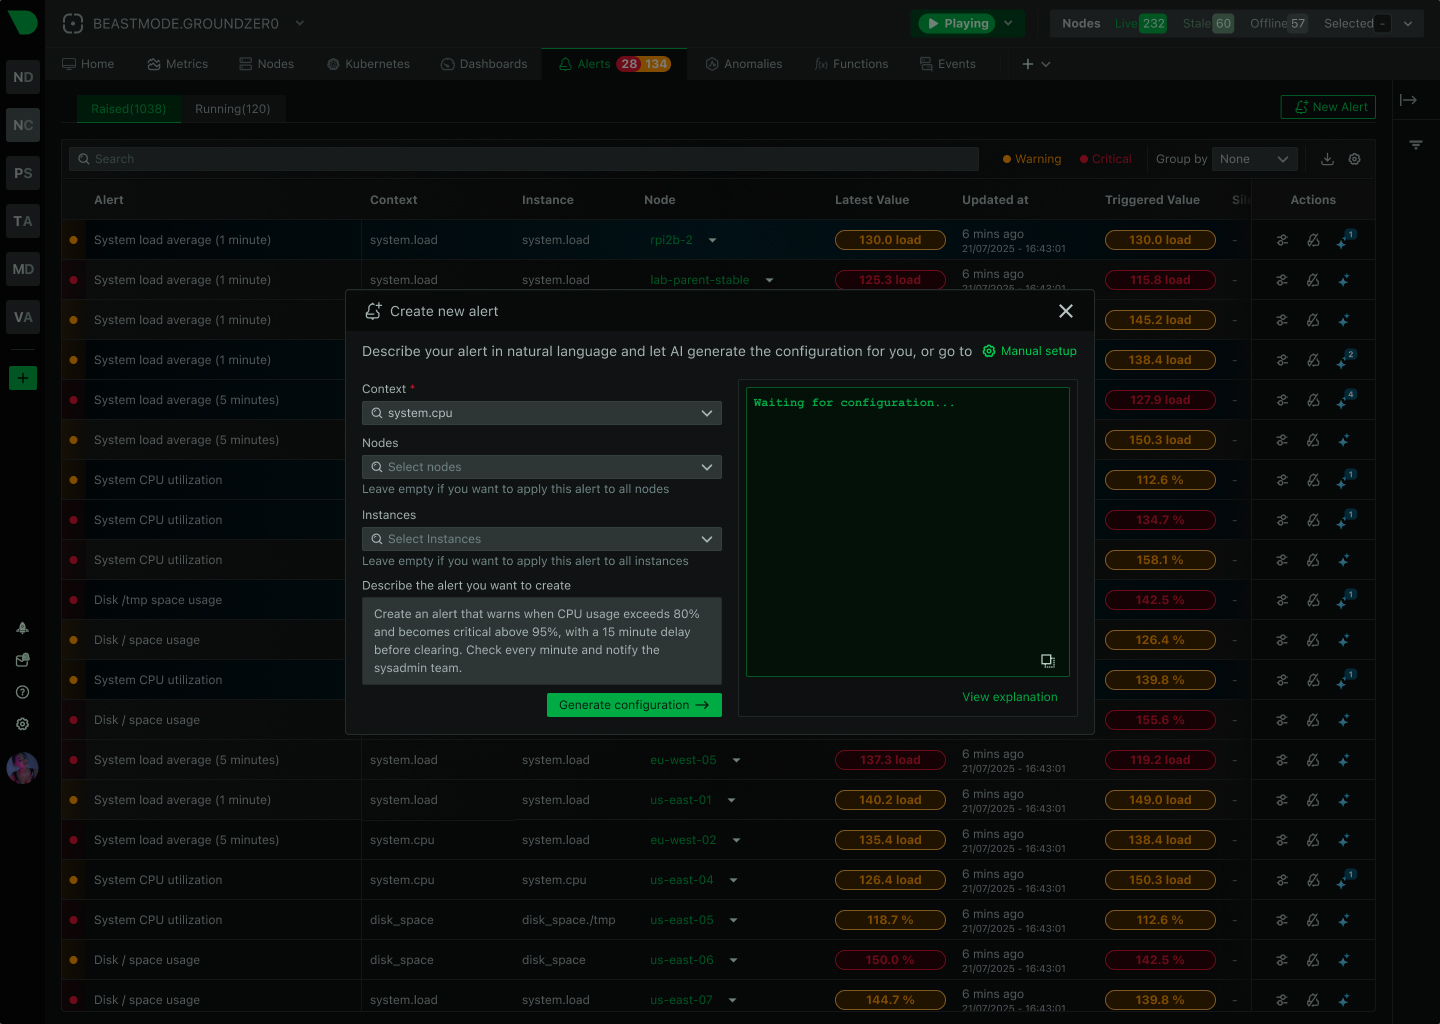
400+ pre-configured alerts auto-apply to discovered services - from CPU and memory to databases and containers - with zero manual configuration required.
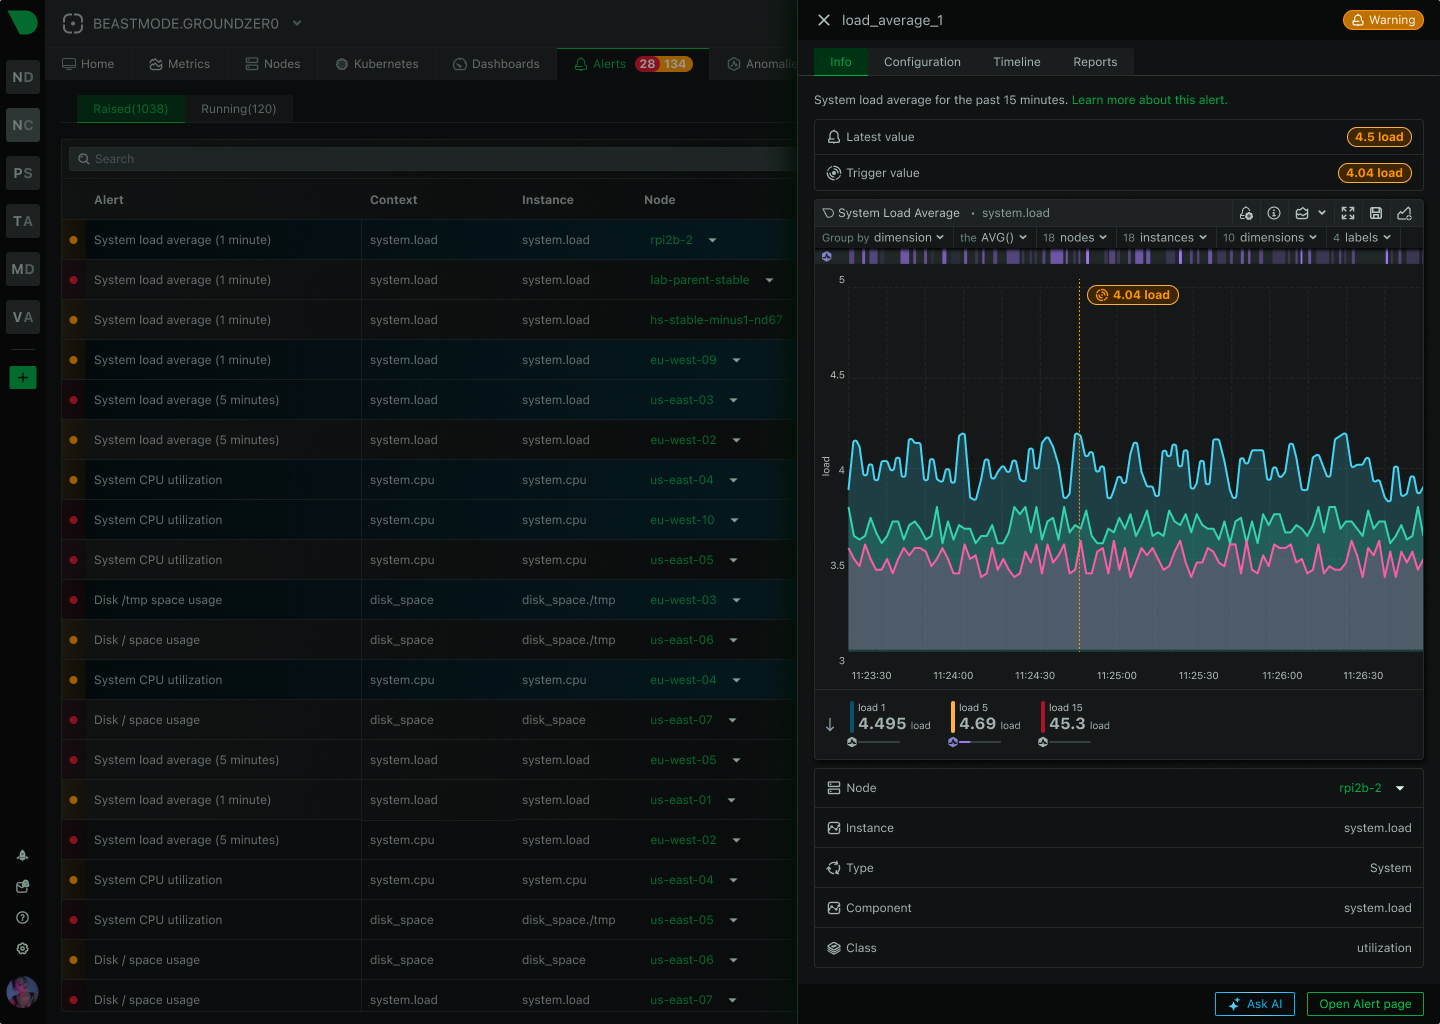
Know exactly what failed and where - per-disk alerts, per-interface monitoring, per-container tracking - eliminating investigation guesswork during incidents.
Alerts evaluate at the source with sub-2-second latency, working even during network partitions - no central bottleneck, no single point of failure.
Route alerts to the right team through their preferred channel - from SMS and Slack to PagerDuty and custom webhooks - with automatic deduplication.
18-model consensus anomaly detection provides an additional signal for investigation - separate from alerts but invaluable for spotting unusual behavior.
From alert to root cause in seconds - Anomaly Advisor correlates metrics across infrastructure, revealing cascading failures and blast radius automatically.
Trusted by DevOps teams worldwide
60 seconds to full protection
View Alert Templates
Component-level precision
See Alert Precision
29 native integrations
Configure Notifications
Zero central dependency
Explore Edge Architecture

18 models per metric
Learn About ML Architecture

80% MTTR reduction
See AI Investigation


How Netdata Compares
See how Netdata’s edge-native architecture delivers superior alerting compared to traditional centralized approaches.
Capability
Netdata
Traditional Monitoring
Time to First Alert
✅ 60 seconds
Zero-config, auto-discovery, instant coverage
⚠️ Days to weeks
Manual rule creation, threshold tuning required
Pre-Configured Alerts
✅ 400+ templates
Infrastructure, databases, services, containers
❌ Limited or none
Build most alerts from scratch
ML Anomaly Detection
✅ Included everywhere
18 models per metric, separate signal
❌ Not available
Or expensive enterprise add-on
Alert Evaluation
✅ Edge-native distributed
Sub-2-second latency, works offline
⚠️ Centralized server
Network dependency, single bottleneck
Component Precision
✅ Automatic per-component
Per-disk, per-interface, per-container
⚠️ Manual configuration
Infrastructure-level generic alerts
Query Language
✅ None required
Simple expressions, template system
⚠️ PromQL or custom DSL
Specialized skills mandatory
Notification Routing
✅ 29 integrations
Multi-channel, role-based, deduplication
⚠️ Limited channels
Basic email/webhook support
Scalability Model
✅ Linear edge-native
10 to 100,000 nodes, same performance
⚠️ Centralized bottleneck
Performance degrades with scale
Cost Structure
✅ Per-node pricing
No per-alert or per-metric charges
⚠️ Complex volume-based
Per-metric, per-monitor, unpredictable
Install Netdata and get comprehensive alert coverage immediately - infrastructure, databases, web services, containers, Kubernetes. Auto-discovery applies alerts to new instances automatically as infrastructure grows.
60 seconds to full coverage
View Alert TemplatesKey advantages that transform alert management
400+ pre-configured alerts work in 60 seconds - infrastructure, databases, services, containers - with zero manual configuration required for 95% of use cases.
Know exactly which disk, interface, or container failed - eliminating investigation guesswork and enabling parallel triage across teams during incidents.
Alerts evaluate at the source with sub-2-second latency, working even during network partitions - no central bottleneck, no single point of failure.
Route alerts to the right team through their preferred channel with automatic deduplication - from SMS and Slack to PagerDuty and custom webhooks.
From alert to root cause in seconds - Anomaly Advisor correlates metrics across infrastructure, revealing cascading failures and blast radius automatically.
Auto-discovery applies alerts to new instances automatically as infrastructure grows - no manual per-host configuration, no query language to learn.
Per-second data collection with sub-2-second alert evaluation - catch transient issues and microbursts that minute-based monitoring misses entirely.
Alerts, metrics, logs, and AI investigation in single platform - eliminate tool sprawl and context switching during incidents for faster resolution.
18-model anomaly detection provides additional investigation signal - spot unusual patterns that complement traditional alert thresholds.

May 30, 2026
The standard advice on high-cardinality observability (aggregate before storage, pay for cardinality, drop the labels) solves the wrong problem. Here's what's actually going on.

May 20, 2026
The netdata/skills repo is an open-source collection of 54 agent skills that teach Claude Code, Cursor, Copilot, and other AI coding agents how to set up OpenTelemetry instrumentation, configure Netdata, and troubleshoot production issues using live telemetry via MCP.

May 15, 2026
Pair the OpenTelemetry Collector with Netdata as your OTLP backend. Per-second charts, ML anomaly detection, AI troubleshooting, and infrastructure correlation. No per-metric pricing.