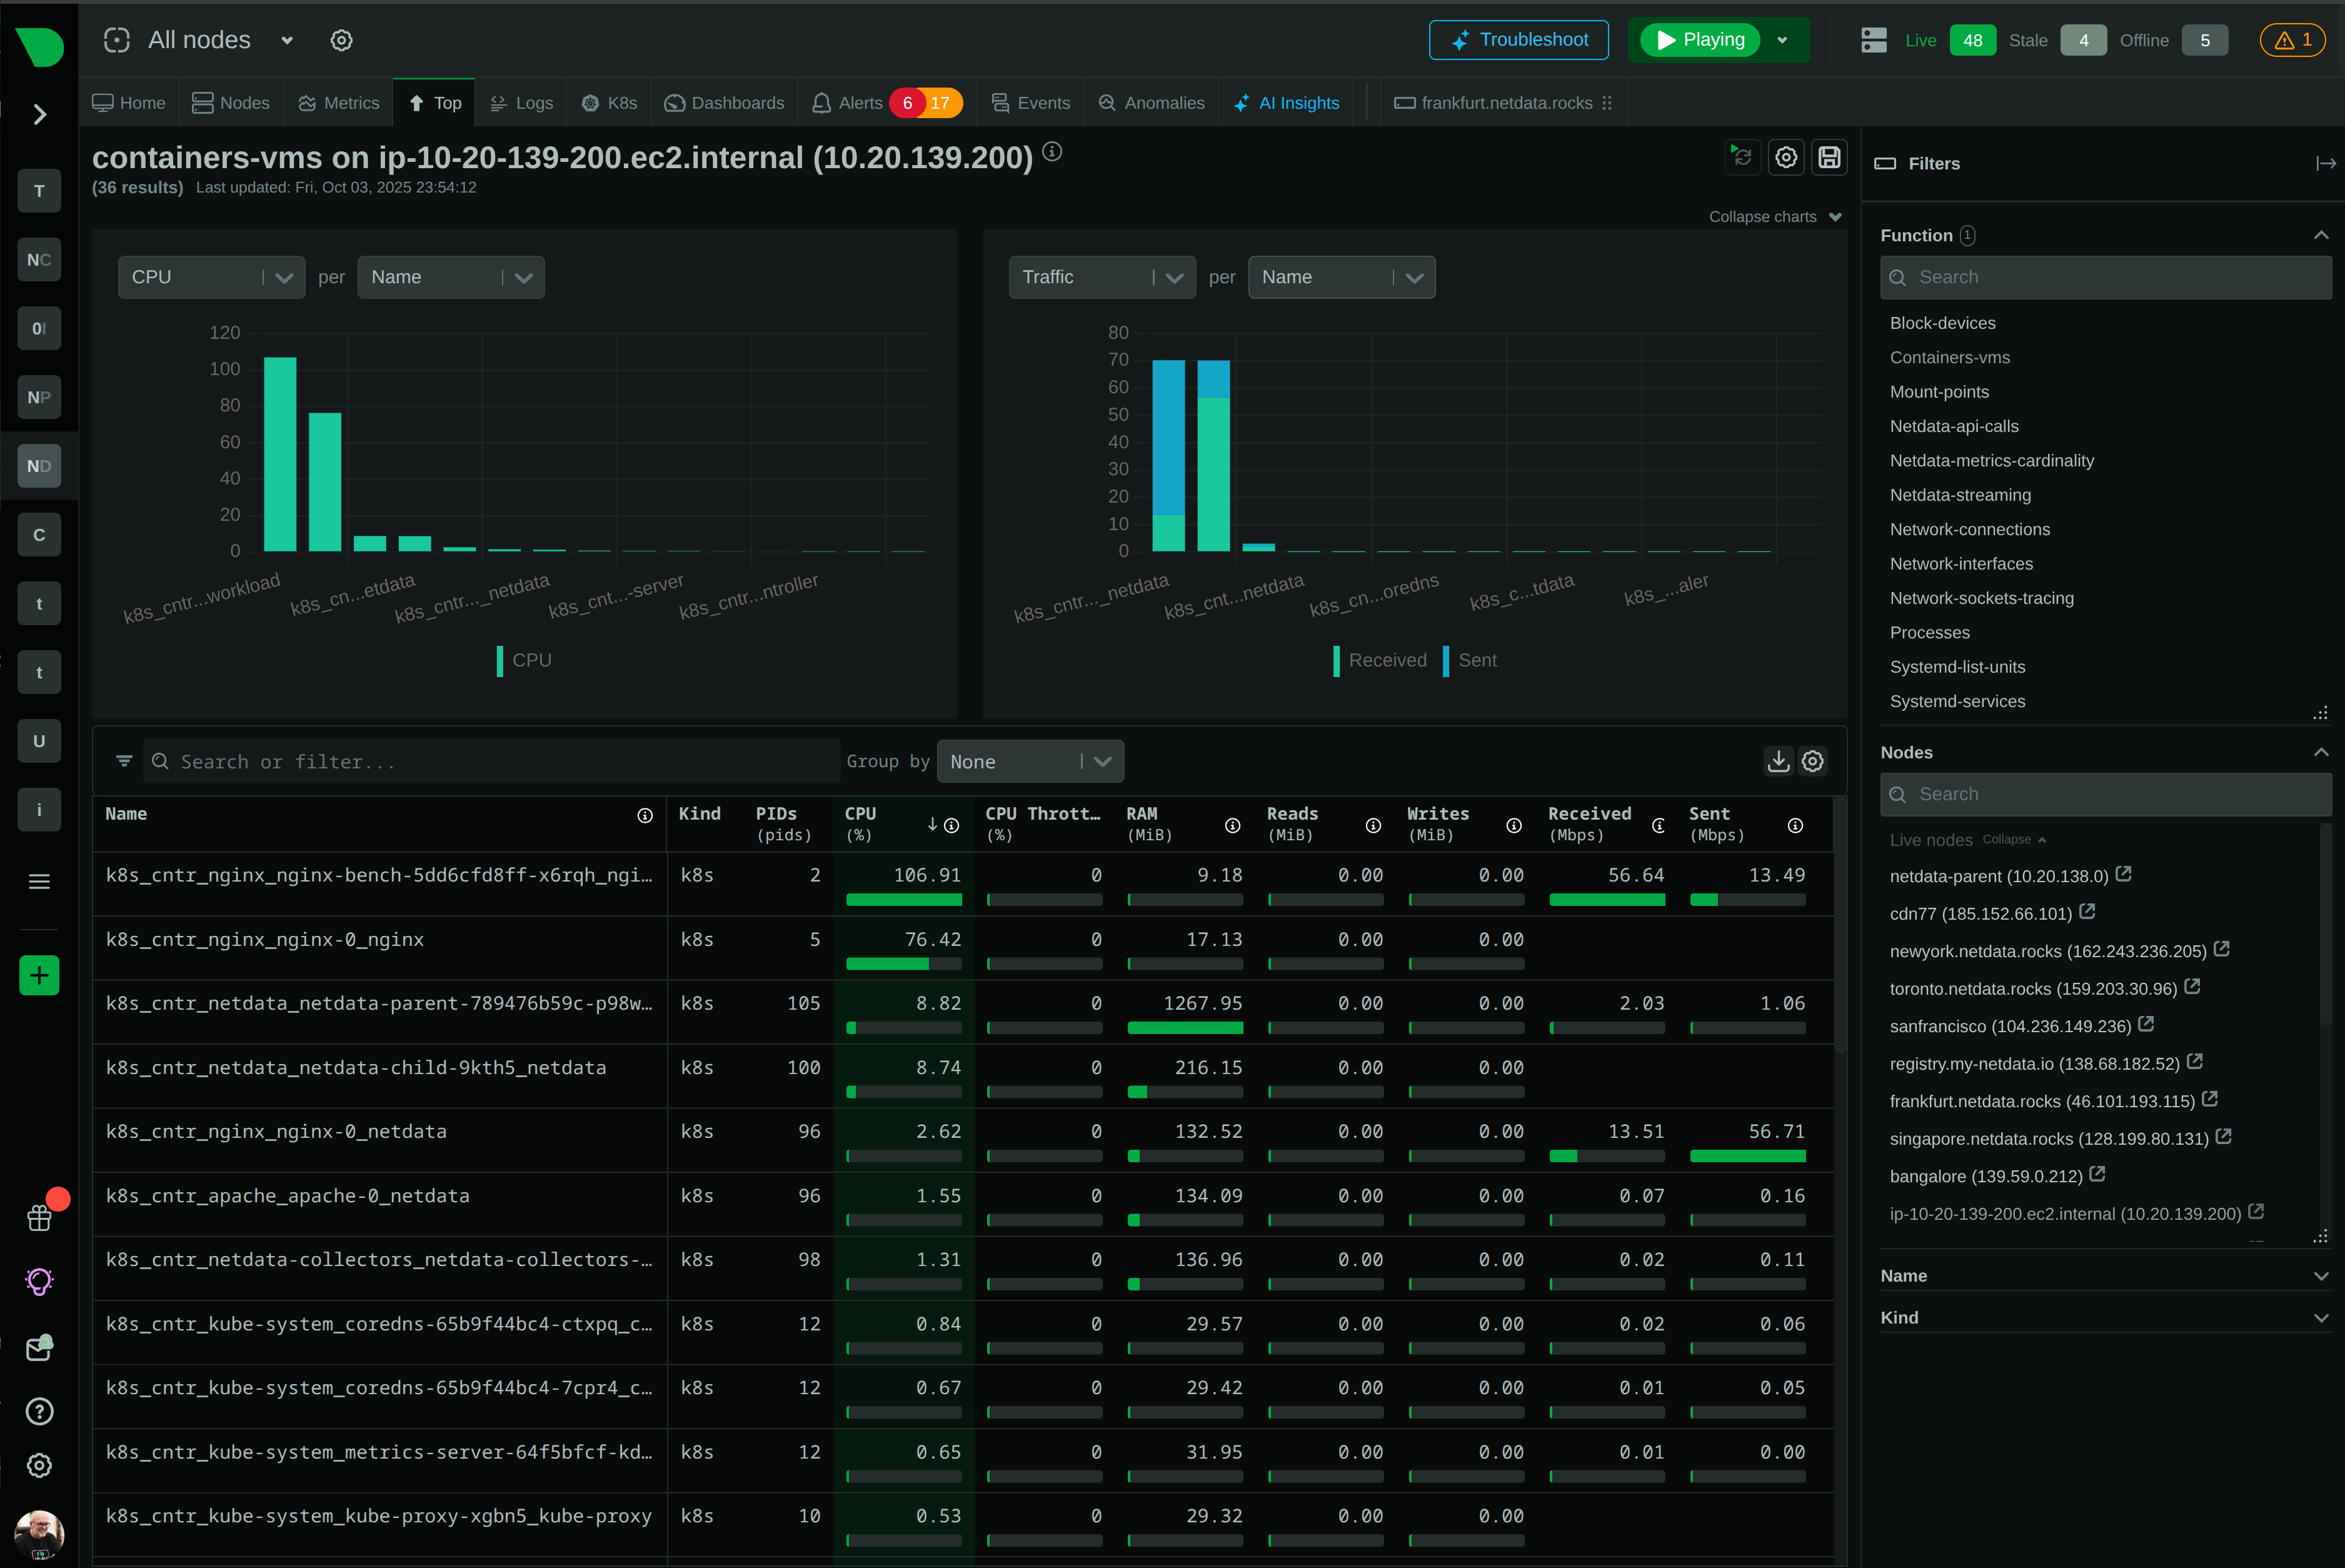
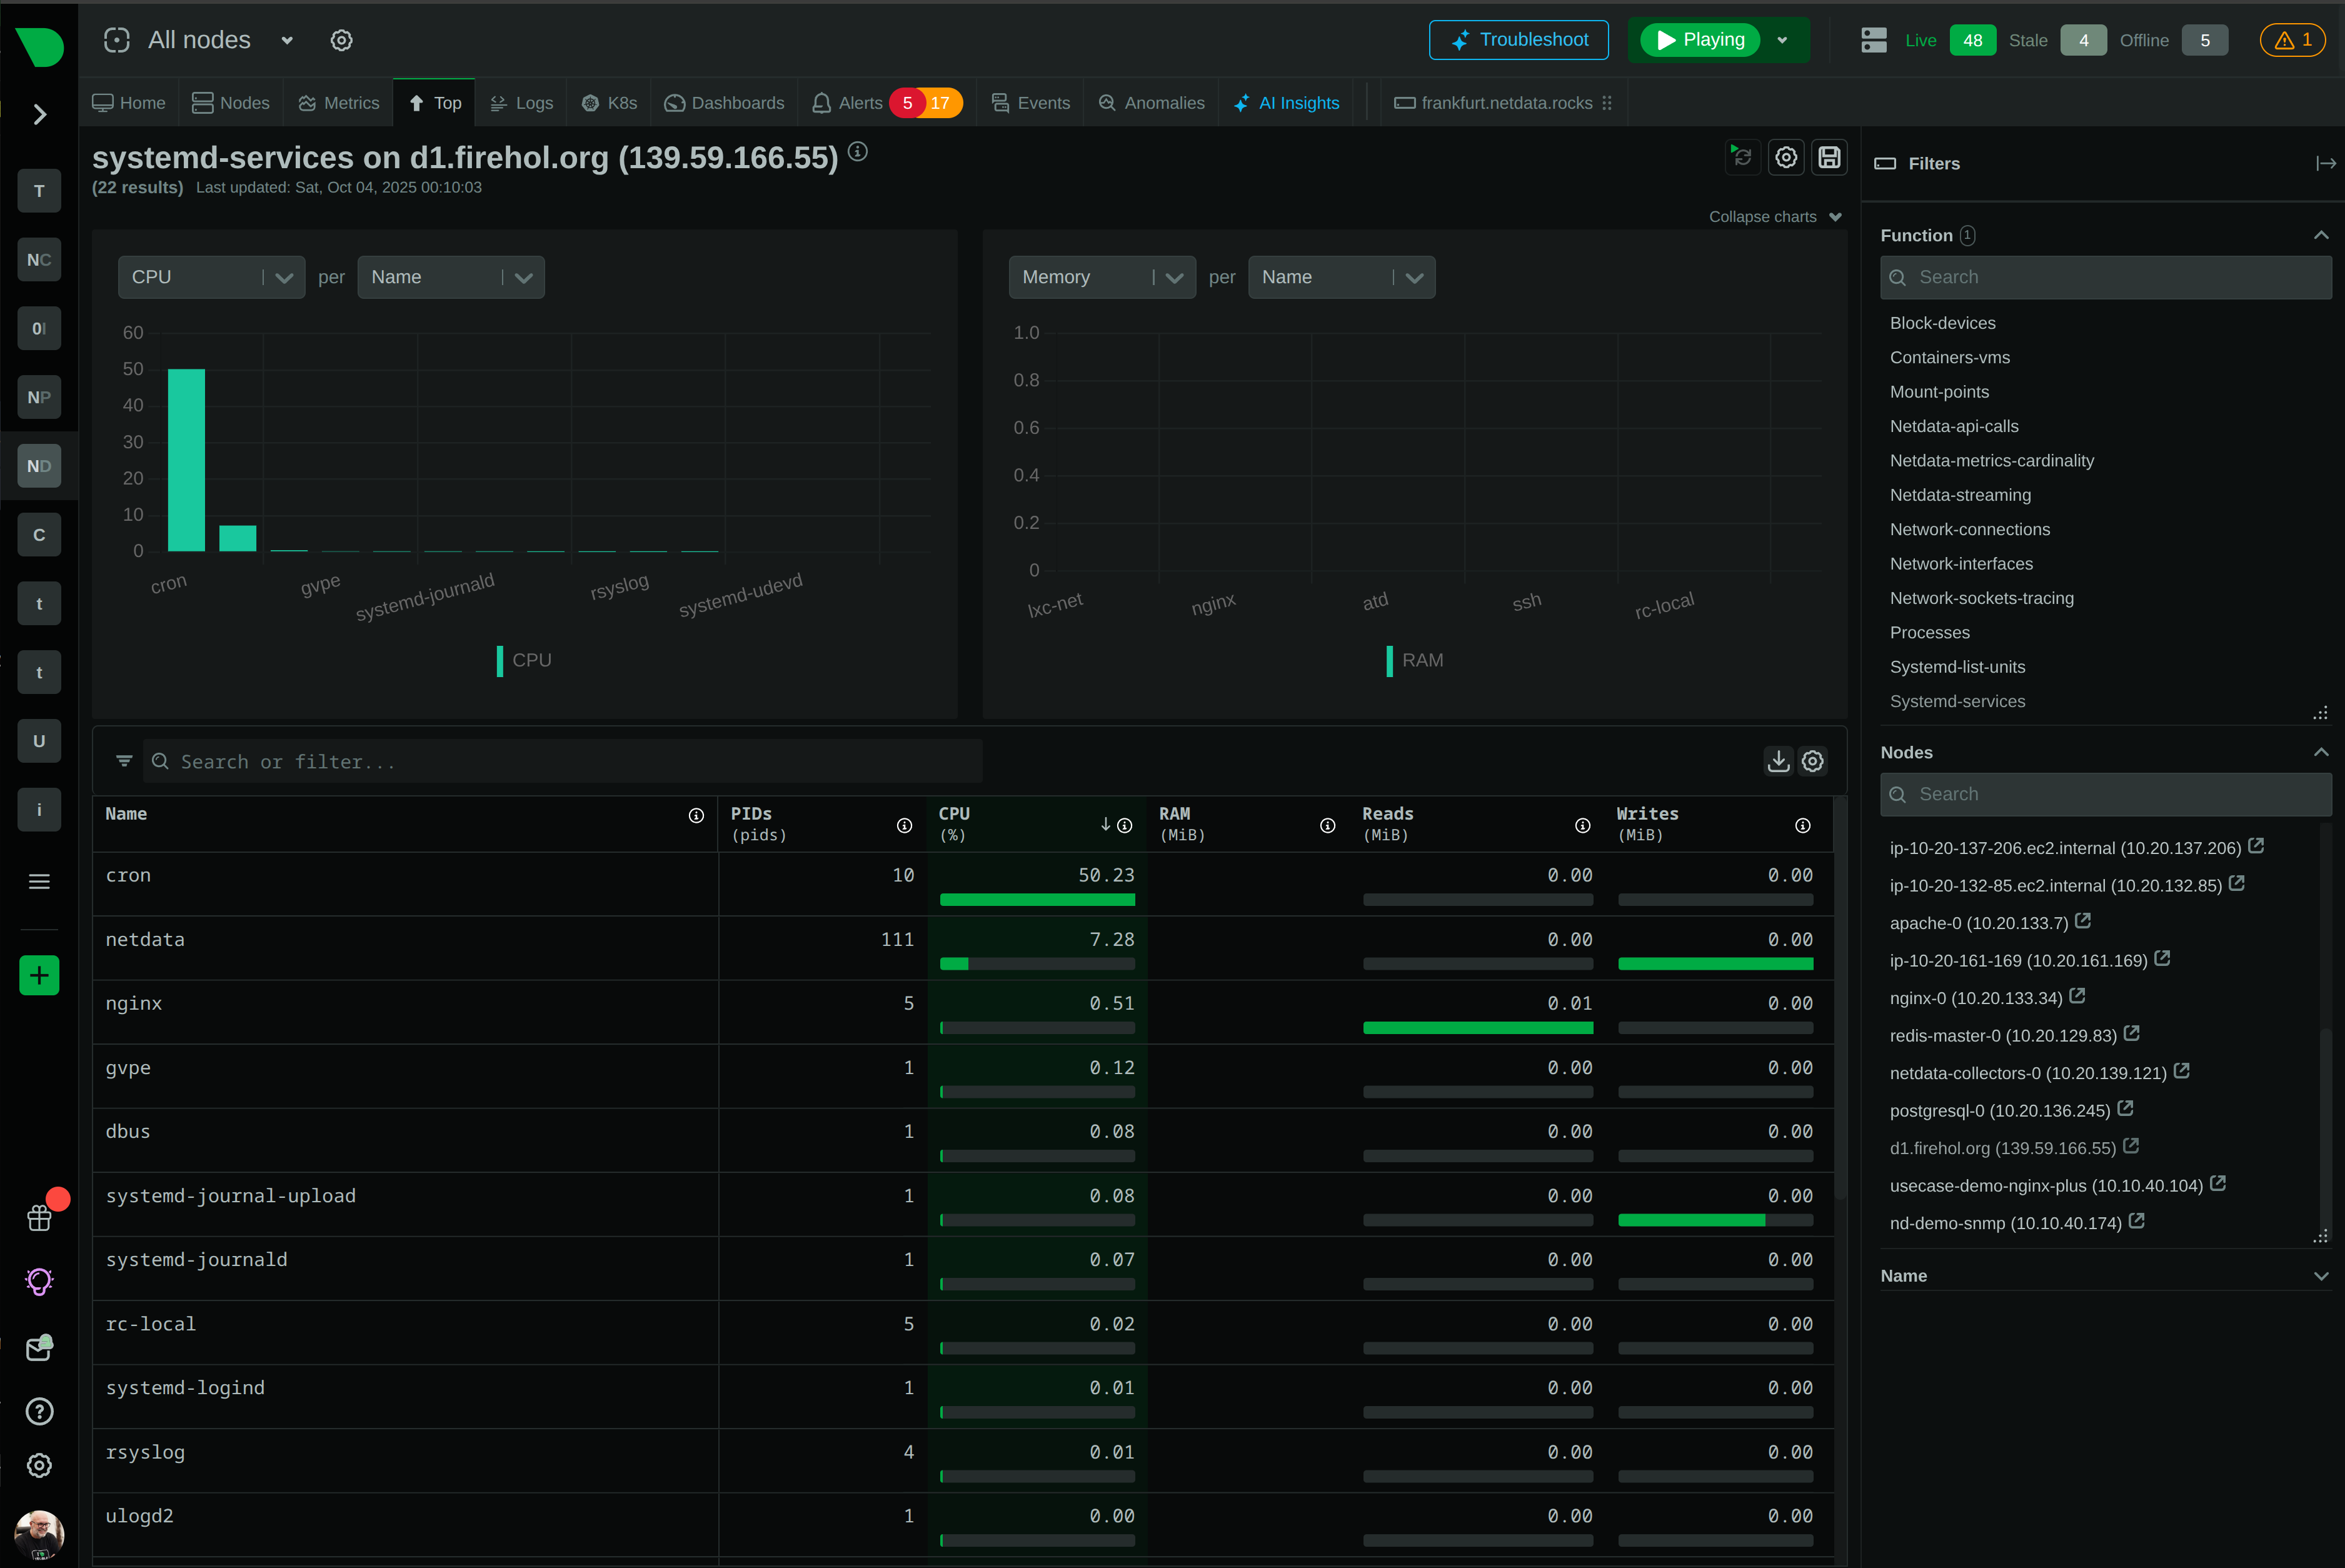
See Who’s Consuming What - Instantly
From individual processes to Kubernetes clusters, Netdata reveals top resource consumers in seconds through intuitive dashboards. No query languages. No SSH access. No complexity.

From individual processes to Kubernetes clusters, Netdata reveals top resource consumers in seconds through intuitive dashboards. No query languages. No SSH access. No complexity.

Powerful capabilities that transform troubleshooting
Sort, filter, and group any metric with interactive dropdowns. No PromQL, no SQL, no query languages required.
Capture microbursts and transient spikes that minute-averaging hides. See what happened, not statistical approximations.
Anomaly Advisor automatically ranks thousands of metrics by relevance during incidents. Root cause surfaces in top 30-50 results.
Every process, container, and service tracked from the moment it starts. Zero configuration, zero blind spots.
Trace resource spikes from Kubernetes cluster to specific PID in one click. See the full story, not scattered symptoms.
Flat per-node pricing with unlimited metrics. Monitor everything without anxiety about the next bill.
Trusted by operations teams worldwide
top, htop, and ps with browser-based visibility. Sort by any metric, filter by category or user, and see historical data - not just current state. Give operations teams console-quality insights without infrastructure access, turning firefighting into informed incident response.80% MTTR reduction
Learn about Netdata Functions

Complete visibility into process families
Explore Integrations

Zero-config Kubernetes monitoring
View Kubernetes Integration

99% false positive reduction
Discover Anomaly Advisor

Why Netdata Wins
See how Netdata transforms resource identification from complex queries to instant insights
Capability
Netdata
Traditional Monitoring
Query Language Required
✅ None
Point-and-click interactive dropdowns
❌ PromQL/SQL Required
Complex syntax for simple questions
Time to First Insight
✅ 60 Seconds
From install to actionable data
⚠️ Hours to Weeks
Configuration and dashboard building required
Data Granularity
✅ Per-Second
Captures microbursts and transient spikes
⚠️ Per-Minute
Averages hide critical patterns
Process Tracking
✅ Automatic
Every PID discovered and grouped
⚠️ Manual Config
Requires agent configuration
Container Monitoring
✅ Native Integration
Zero-config Kubernetes support
⚠️ Separate Tools
Additional components required
ML Anomaly Detection
✅ Included
18 models per metric, automatic
❌ Paid Add-On
Extra cost or not available
Cross-Stack Correlation
✅ Automatic
PID to pod in one click
⚠️ Manual
Jump between multiple tools
Historical Process Data
✅ Full History
See what happened during incidents
❌ Current State Only
SSH tools show live data only
Pricing Model
✅ Flat Per-Node
Unlimited metrics and processes
❌ Volume-Based
Costs increase with data collected
Total Cost of Ownership
✅ 90% Cost Reduction
Predictable and transparent pricing
❌ Exponential Scaling
Costs grow with metrics volume
Browser-based process explorer with sorting, filtering, and historical data. Replaces SSH and console tools with team-friendly collaboration.
Real-time process intelligence
Explore Integrations
Everything you need to identify and troubleshoot resource consumers
Every process, container, and service tracked from creation without configuration or manual setup.
Thousands of PIDs organized into meaningful application categories with accumulated metrics from process families.
Eighteen unsupervised models per metric achieve 99% false positive reduction through consensus-based detection.
Interactive dropdowns with real-time statistics enable sorting and filtering without learning query languages.
Automatic correlation from Kubernetes cluster to specific PID reveals complete root cause paths.
Capture microbursts and transient spikes that minute-averaging hides with true real-time monitoring.
See what happened during incidents with full historical data, not just current state snapshots.
Flat per-node pricing with unlimited metrics eliminates anxiety about collecting comprehensive data.

December 1, 2025
The industry says 'monitor everything' is bad. But the same industry keeps discovering monitoring gaps during outages. What's really going on?

November 7, 2025
Join Netdata in Las Vegas for the Gartner IT Infrastructure, Operations & Cloud Strategies Conference. Don't miss our founder's talk on why 80% of organizations will overspend for observability in 2026.
November 7, 2025
Automatically create and manage ServiceNow incidents from Netdata alerts. Bridge the gap between real-time monitoring and your ITSM workflow to accelerate incident response.