From Incident to Insight in Seconds
Slash MTTR by 80% with per-second visibility, ML-powered anomaly detection, and AI-driven root cause analysis. See what’s wrong, understand why it happened, and fix it faster than ever before.


Slash MTTR by 80% with per-second visibility, ML-powered anomaly detection, and AI-driven root cause analysis. See what’s wrong, understand why it happened, and fix it faster than ever before.
Six innovations that redefine how teams debug production systems
ML correlates thousands of metrics automatically, surfacing the root cause in top 30-50 results within seconds of incident detection.
Catch transient issues invisible to minute-based monitoring. See every heartbeat of every system with sub-2-second latency.
Ask questions in plain English. Get instant explanations, recommended actions, and automated reports without query languages.
Debug without SSH. Browser-based access to processes, connections, and services with history, ML, and AI built in.
400+ pre-configured alerts adapt automatically to infrastructure changes. Intelligent thresholds reduce noise while maintaining coverage.
From install to insight in 60 seconds. Zero configuration, automatic discovery, pre-trained ML, and algorithmic dashboards.
Trusted by DevOps teams worldwide
80% MTTR Reduction
Learn About Anomaly Advisor
10-60× More Granular
Explore Real-Time Monitoring

Console Precision + History
Discover Netdata Functions

Natural Language Queries
Meet the AI Co-Engineer

99% false positive reduction
Understand ML Anomaly Detection

Zero Pipeline Complexity
Explore Unified Observability


How Netdata Compares
See how Netdata’s architecture delivers faster incident resolution, better accuracy, and lower costs compared to traditional observability platforms.
Capability
Netdata
Traditional Monitoring
Data Granularity
✅ Per-Second
Catch transient issues others miss
⚠️ Per-Minute
Averages hide critical spikes
Time to Insight
✅ Sub-2 Seconds
From event to visualization
⚠️ 30-300 Seconds
Pipeline delays slow response
Root Cause Analysis
✅ Automated
ML correlates all metrics automatically
⚠️ Manual
Engineers jump between dashboards
Anomaly Detection
✅ Built-In ML
18 models per metric, consensus-based
⚠️ Basic or Add-On
Static thresholds or premium tier
Setup Time
✅ 60 Seconds
Zero configuration required
⚠️ Hours to Days
Manual configuration required
Query Interface
✅ Point-and-Click
No query language needed
⚠️ PromQL/SQL
Requires specialized expertise
AI Troubleshooting
✅ Integrated
Cloud AI or bring-your-own LLM
⚠️ Limited or Add-On
Premium tier or separate tool
Data Sovereignty
✅ On-Premises
All data stays local by default
⚠️ Varies
Some support on-prem, many cloud-only
Cost Model
✅ Per-Node
Predictable, unlimited metrics
⚠️ Per-Metric/GB
Often volume-based pricing
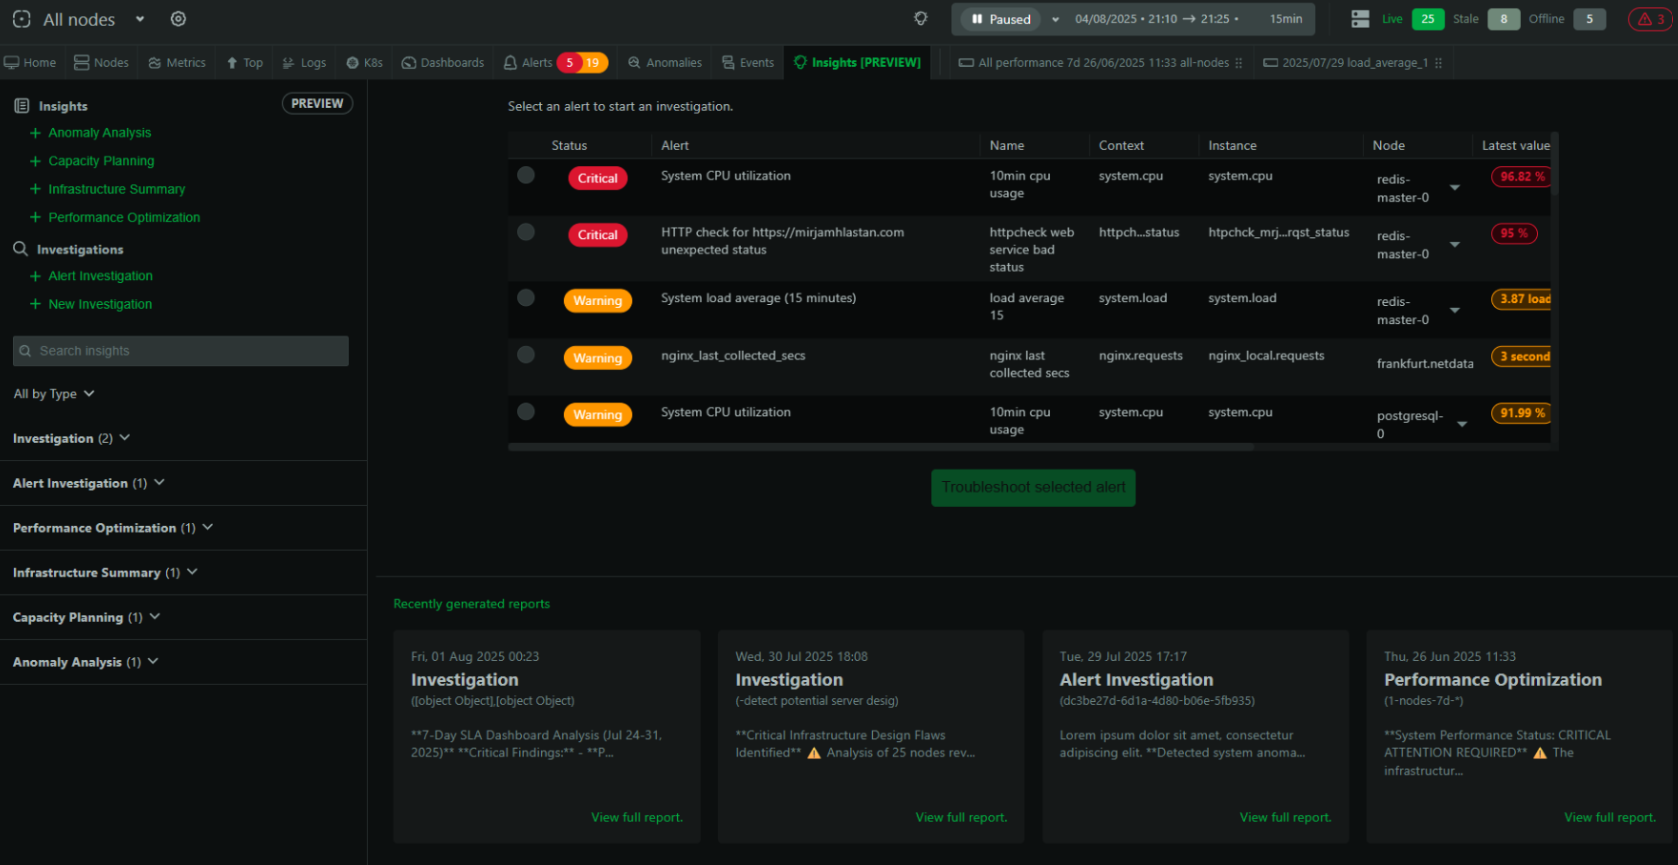
Alert fires. Anomaly Advisor correlates all metrics. Root cause surfaces in top 30-50 results. AI explains in plain English. You fix it. Minutes, not hours.
From alert to resolution in minutes
Learn About Anomaly AdvisorSix reasons Netdata transforms how teams debug production systems
ML analyzes thousands of metrics automatically, surfacing root cause in top 30-50 results within seconds of incident detection.
Catch transient issues invisible to minute-based monitoring with sub-2-second latency from event to insight.
Natural language queries, automated reports, and instant explanations without query languages or specialized skills.
Browser-based debugging with CLI-level precision plus history, ML, and AI. No SSH access required.
400+ component-level alerts adapt automatically to your infrastructure. Intelligent thresholds provide better coverage.
From install to insight in 60 seconds. Zero configuration, automatic discovery, and pre-trained ML.

September 2, 2025
Our AI investigations and insights are now out of preview. Every space can scale on-demand with AI Credits.
August 4, 2025
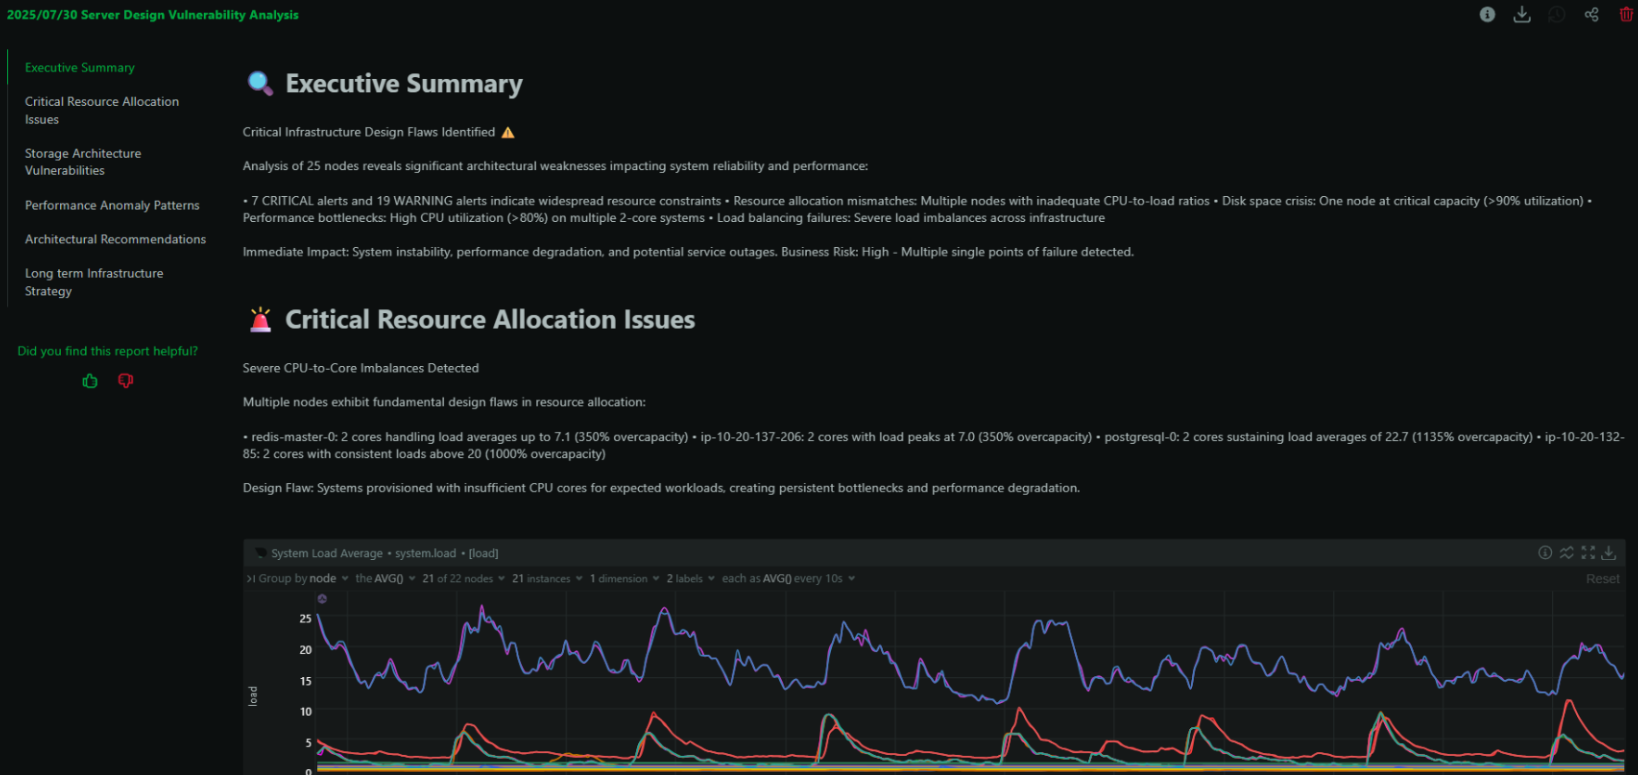
Ask Netdata Anything, Get an Expert Analysis in Minutes - introducing conversational infrastructure troubleshooting powered by Netdata AI: Your Co-SRE.
August 3, 2025
Introducing Automated Alert Troubleshooting - Netdata AI: Your Co-SRE that performs initial investigations, identifies root causes, and eliminates alert fatigue.