


Machbase Monitoring
What Is Machbase?
Machbase is a high-performance time-series database designed for efficient data storage and quick query performance, making it an essential tool in data-driven environments. Used widely across industries for handling vast amounts of data swiftly, Machbase technology supports a wide range of applications in data collection and analysis, greatly aiding in operational decisions and insights.
Monitoring Machbase With Netdata
To monitor Machbase, Netdata utilizes an openmetrics (Prometheus) exporter, allowing seamless integration and data ingestion from any Prometheus exporter, including the Machbase Exporter. With Netdata, users can achieve automated dashboards, alerts, and more without needing a Prometheus server or Grafana. This streamlined integration ensures real-time visibility into Machbase performance metrics, helping optimize database operations through intuitive visualizations and responsive alerts to any disruptions.
Why Is Machbase Monitoring Important?
Monitoring Machbase is crucial due to its role in handling significant time-series data, where performance and accuracy are paramount. By keeping track of database metrics and identifying potential issues early, organizations can prevent data loss, ensure system resilience, and maintain high levels of performance. This proactive monitoring approach supports continuous data availability, which is vital for maintaining business operations and strategic data analysis.
What Are The Benefits Of Using Machbase Monitoring Tools?
Employing tools for monitoring Machbase unveils multiple benefits, including enhanced system performance, increased efficiency, and cost-effectiveness through reduced downtime. The combination of Netdata and Machbase allows for optimal database usage and extends users’ ability to harness complete data insights easily, enabling timely business decisions.
View Netdata Live or Sign Up To Netdata today to begin optimizing your Machbase monitoring!
FAQs
What Is Machbase Monitoring?
Machbase monitoring involves tracking the performance and status of the Machbase time-series database to ensure it operates efficiently and effectively, providing the necessary insights for optimal data-driven decision-making.
Why Is Machbase Monitoring Important?
This monitoring is pivotal because it helps identify potential performance bottlenecks and operational issues which, if unresolved, could lead to data loss, downtime, and inefficiencies, impacting business adversely.
What Does A Machbase Monitor Do?
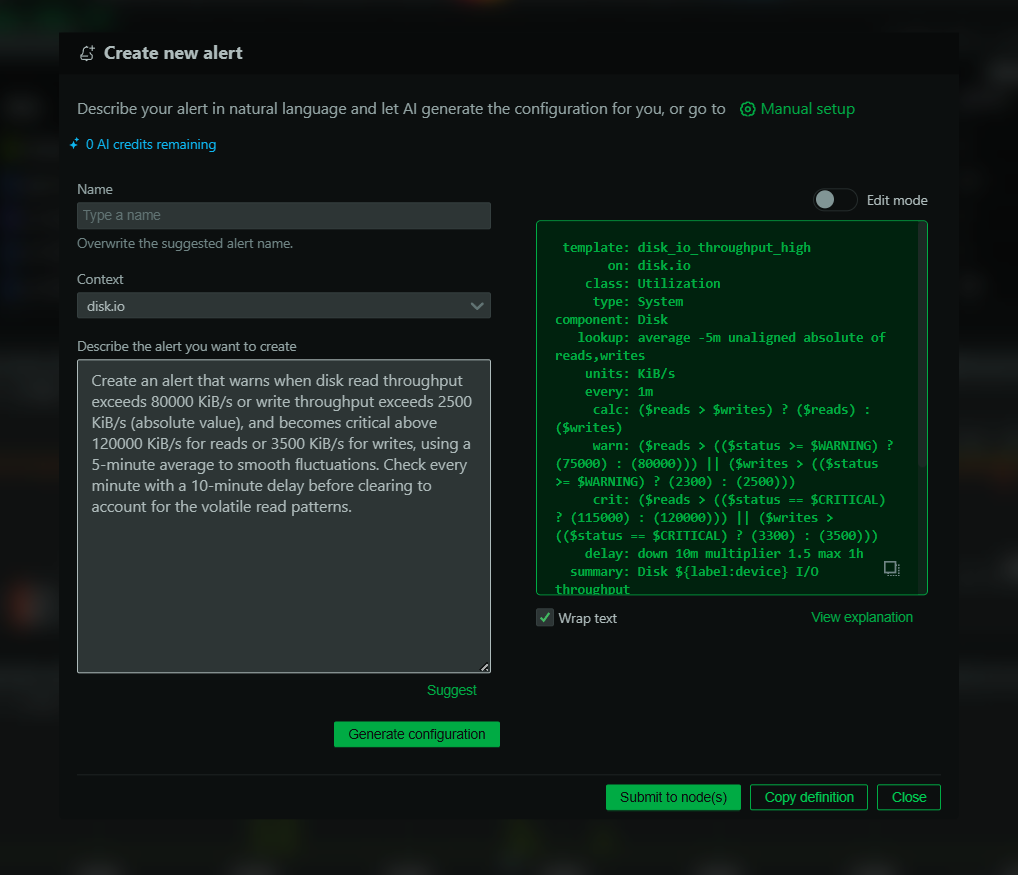
A Machbase monitor collects and analyzes database performance metrics, alerting users to any anomalies or issues and providing strategic views into data flow and usage trends for timely corrective actions.
How Can I Monitor Machbase In Real Time?
Real-time monitoring of Machbase can be achieved using Netdata, which leverages the Machbase Prometheus exporter to provide immediate insights into database metrics and issues, facilitating prompt interventions and maintaining optimal performance.