


TP-Link P110 Monitoring
What Is TP-Link P110?
The TP-Link P110 is a smart plug designed to provide efficient energy management within IoT environments. It allows users to monitor and control their energy usage by connecting everyday appliances and devices. With its integration into a smart home network, it offers the flexibility to automate and optimize energy consumption based on user preference.
Monitoring TP-Link P110 With Netdata
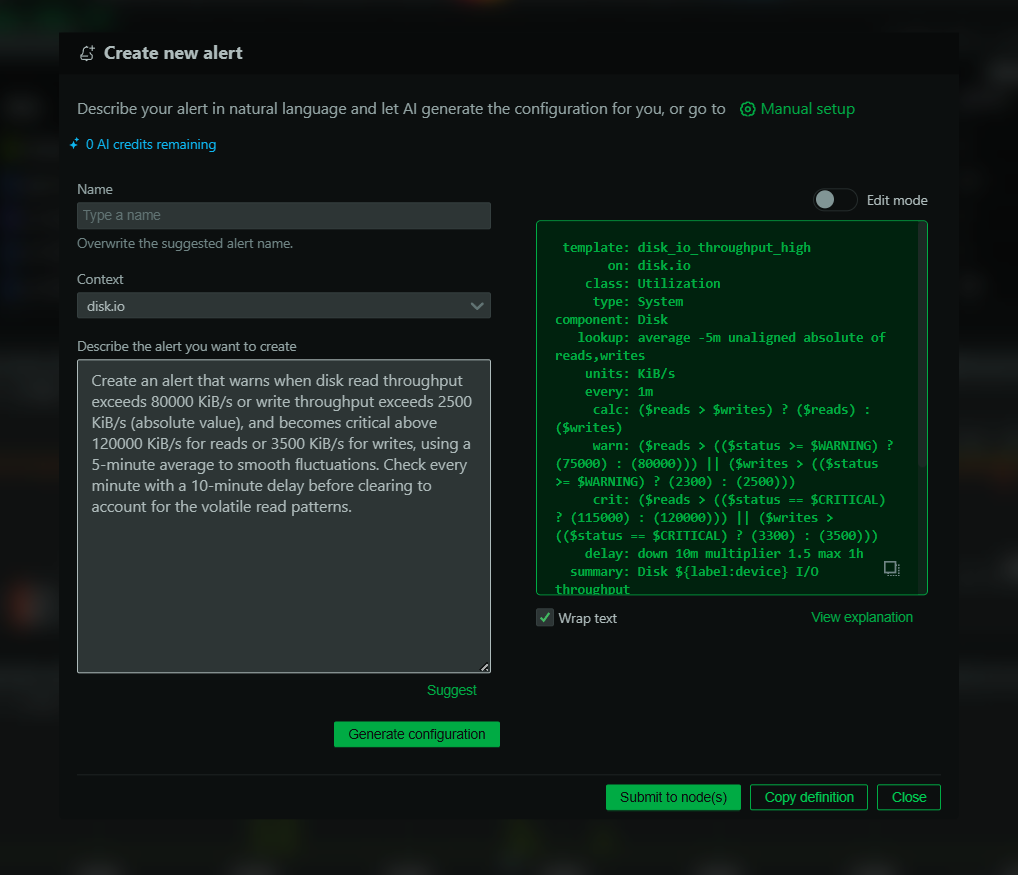
To monitor the TP-Link P110, Netdata utilizes an openmetrics (Prometheus) exporter. This integration allows you to collect data from the TP-Link P110 without the need for setting up a Prometheus server or Grafana dashboard since Netdata provides automated dashboards and alerting out of the box. By setting up Netdata, you can ingest data from any Prometheus exporter, gaining insights in real-time.
Why Is TP-Link P110 Monitoring Important?
Monitoring the TP-Link P110 smart plug is crucial for effective energy management. It provides visibility into power consumption patterns, enabling users to make informed decisions to optimize energy use and reduce costs. Moreover, continuous monitoring helps in identifying any anomalies or faults in connected devices, ensuring the reliability and safety of your home network.
What Are The Benefits Of Using TP-Link P110 Monitoring Tools?
Using monitoring tools for the TP-Link P110 like Netdata significantly enhances your ability to track and manage energy usage accurately. With real-time alerts and detailed analytics, these tools help prevent overconsumption and allow for timely interventions when issues are detected. Netdata’s integration means simple setup and immediate access to sophisticated monitoring capabilities.
View Netdata Live or Sign Up for Netdata today.
FAQs
What Is TP-Link P110 Monitoring?
TP-Link P110 monitoring involves tracking the energy usage and performance of devices connected through the TP-Link P110 smart plug using tools like Netdata, which provide real-time insights and alerts.
Why Is TP-Link P110 Monitoring Important?
By monitoring TP-Link P110, users can optimize their energy usage, manage costs effectively, and maintain the operational integrity of their connected devices.
What Does A TP-Link P110 Monitor Do?
A TP-Link P110 monitor tracks and reports on energy usage, providing data that helps users manage consumption and protect their devices against overload situations.
How Can I Monitor TP-Link P110 In Real Time?
You can monitor TP-Link P110 in real time by leveraging Netdata’s openmetrics integration which provides immediate data visualization and alerting without additional setup for Prometheus servers or Grafana dashboards.