


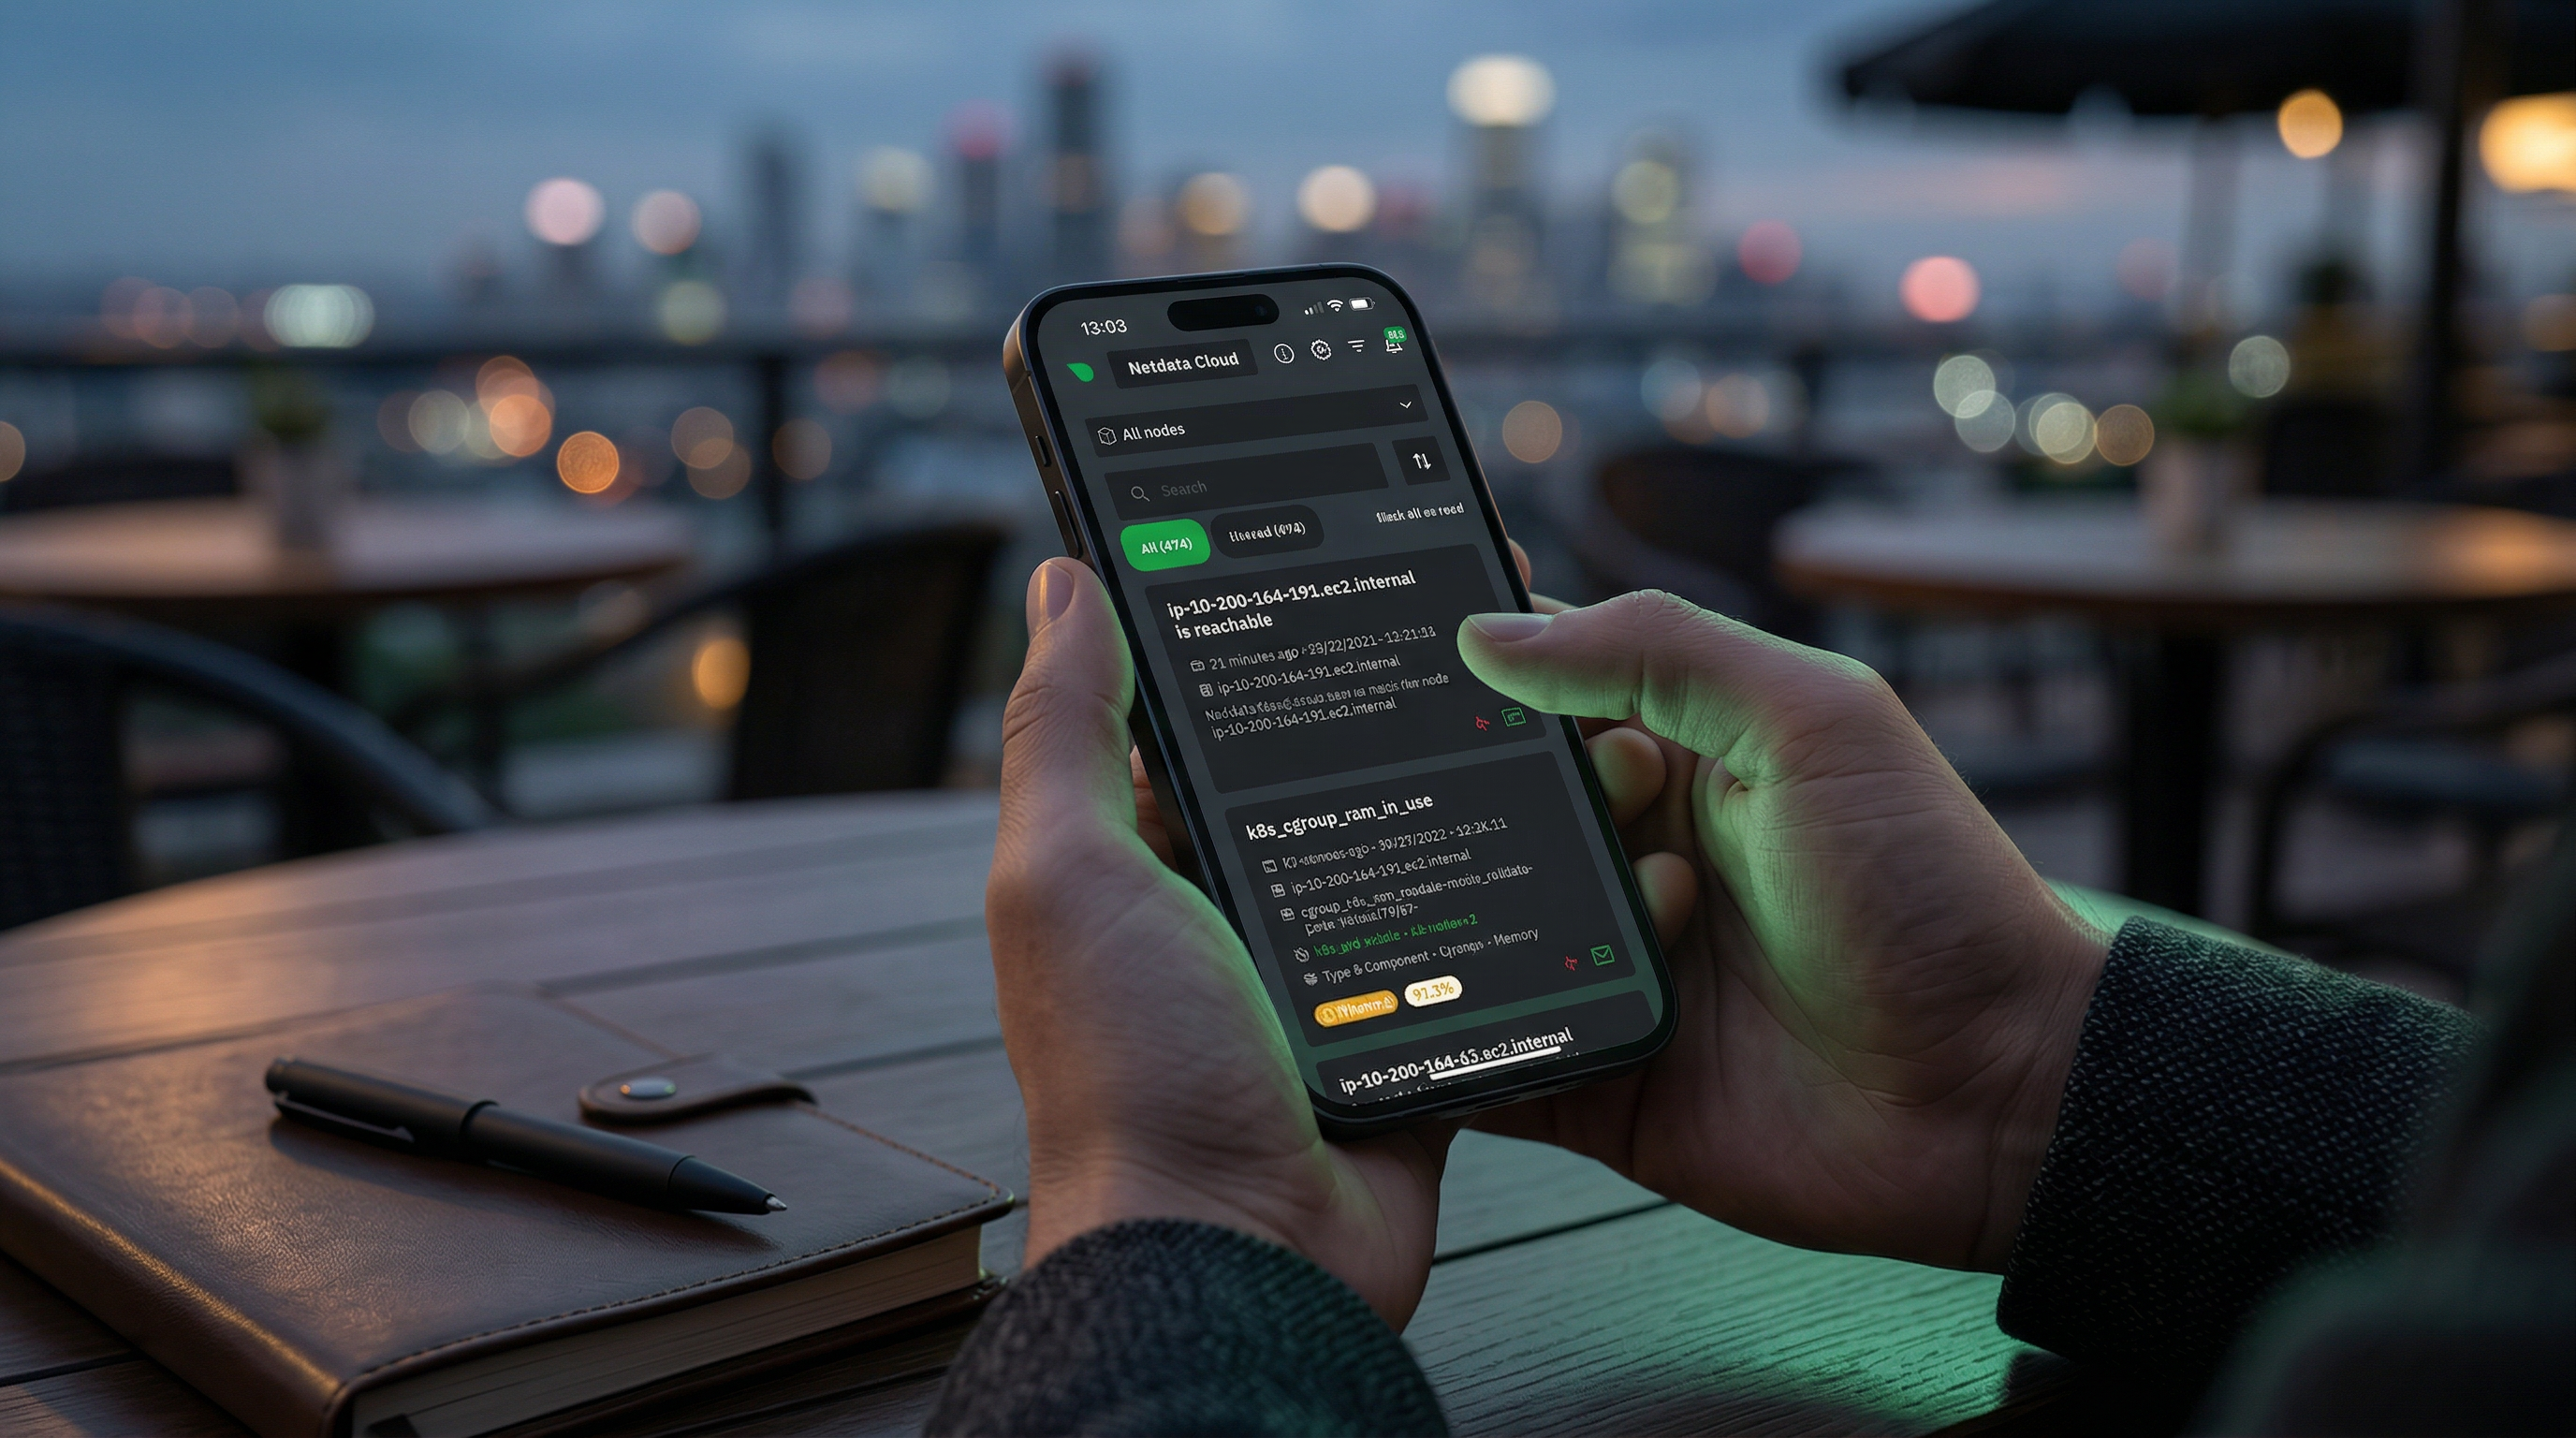
Your Infrastructure, Always Within Reach
Native iOS and Android apps that put real-time alerts and AI troubleshooting in your pocket. See what’s wrong, understand why, and know how to fix it — from anywhere.

The only agent that thinks for itself
Autonomous Monitoring with self-learning AI built-in, operating independently across your entire stack.
Centralized metrics streaming and storage
Aggregate metrics from multiple agents into centralized Parent nodes for unified monitoring across your infrastructure.
Fully managed cloud platform
Access your monitoring data from anywhere with our SaaS platform. No infrastructure to manage, automatic updates, and global availability.
Deploy Netdata Cloud in your infrastructure
Run the full Netdata Cloud platform on-premises for complete data sovereignty and compliance with your security policies.
Powerful, intuitive monitoring interface
Modern, responsive UI built for real-time troubleshooting with customizable dashboards and advanced visualization capabilities.
Monitor on the go
Native iOS and Android apps bring full monitoring capabilities to your mobile device with real-time alerts and notifications.
Best energy efficiency
True real-time per-second
100% automated zero config
Centralized observability
Multi-year retention
High availability built-in
Zero maintenance
Always up-to-date
Enterprise security
Complete data control
Air-gap ready
Compliance certified
Millisecond responsiveness
Infinite zoom & pan
Works on any device
Native performance
Instant alerts
Monitor anywhere
80% Faster Incident Resolution
True Real-Time and Simple, even at Scale
90% Cost Reduction, Full Fidelity
Single Pane of Glass
Control Without Surrender
Integrations
800+ collectors and notification channels, auto-discovered and ready out of the box.
Reduced monitoring costs by 46% while cutting staff overhead by 67%.
— Leonardo Antunez, Codyas
No data shipping. No central storage costs. Query at the edge.
So many out-of-the-box features! I mostly don't have to develop anything.
— Simon Beginn, LANCOM Systems
Point-and-click troubleshooting. No PromQL, no LogQL, no learning curve.
Enterprise efficiency without enterprise complexity—real ROI from day one.
— Leonardo Antunez, Codyas
Zero data egress. Only metadata reaches the cloud. Your metrics stay on your infrastructure.
Auto-discovered and configured. No manual setup required.
Slack, PagerDuty, Teams, email, webhooks—all built-in.
Built for the People Who Get Paged
Every Industry Has Rules. We Master Them.
Monitor Any Technology. Configure Nothing.
Complete Visibility. Total Control.
Don't Take Our Word for It
Netdata gives more than you invest in it. A rare unicorn that obeys the Pareto rule.
— Eduard Porquet Mateu, TMB Barcelona
Reduced website downtime by 99% and cloud bill by 30% using Netdata alerts.
— Falkland Islands Government
Optimized resource allocation based on Netdata alerts cut cloud spending by 30%.
— Falkland Islands Government
Reduced monitoring staff by 67% while cutting operational costs by 46%.
— Codyas
Netdata has agent capacity or a plugin for everything, including Windows and Kubernetes.
— Eduard Porquet Mateu, TMB Barcelona
So many out-of-the-box features! I mostly don't have to develop anything.
— Simon Beginn, LANCOM Systems
From 2-3 minutes to 30 seconds—instant visibility into any node issue.
— Matthew Artist, Nodecraft
20% less downtime and 40% budget optimization from out-of-the-box monitoring.
— Simon Beginn, LANCOM Systems
Pay per Node. Unlimited Everything Else.
One price per node. Unlimited metrics, logs, users, and retention. No per-GB surprises.
What's Your Monitoring Really Costing You?
Most teams overpay by 40-60%. Let's find out why.
Your Infrastructure Is Unique. Let's Talk.
Because monitoring 10 nodes is different from monitoring 10,000.
Monitoring That Sells Itself
Deploy in minutes. Impress clients in hours. Earn recurring revenue for years.
Per-Second Metrics at Homelab Prices
Same engine, same dashboards, same ML. Just priced for tinkerers.
$1,000 Per Referral. Unlimited Referrals.
Your colleagues get 10% off. You get 10% commission. Everyone wins.
"Netdata's significant positive impact" — LANCOM Systems
Compare vs Datadog, Grafana, Dynatrace
"Cut costs by 46%, staff by 67%" — Codyas
"Reduced cloud bill by 30%" — Falkland Islands Gov
"Better observability with Netdata than combining other tools." — TMB Barcelona
DPA, SLAs, on-prem, volume pricing
One command, 30 seconds, real data—no sandbox needed
Auto-config + per-node pricing = predictable profit
"We tested every monitoring system under the sun." — Benjamin Gabler, CEO Rocket.Net
3rd most starred monitoring project
Customers report 40-67% cost cuts, 99% downtime reduction
Free tier lets them try before they buy
AI Support Assistant, Available 24/7
Nedi has access to all official documentation, source code, and resources. Ask any question about Netdata—responds in your language.
Engineering Insights & Product Updates

Feb 2026
Introducing the Netdata Cloud MCP Server
The Netdata Cloud MCP Server is now available …

Feb 2026
Netdata at Howard Conference and Expo …
The Netdata team will be at the Howard …

Feb 2026
Netdata at Tech Show London 2025: …
The intersection of cloud and AI is creating …

Feb 2026
Netdata at the 10th Edition India DevOps …
DevOps has fundamentally transformed how …
Never Fight Fires Alone
Docs, community, and expert help—pick your path to resolution.
60 Seconds to First Dashboard
One command to install. Zero config. 850+ integrations documented.
Level Up Your Monitoring
76,000+ Engineers Strong
Per-Second. 90% Cheaper. Data Stays Home.
See why teams switch from Datadog, Prometheus, Grafana, and more.
> Browse all comparisonsTrace issues directly in the source code
Get architecture recommendations
One of the most popular open-source monitoring projects
Enterprise-grade security and compliance
Your metrics stay on your infrastructure
"Most energy-efficient monitoring solution" — ICSOC 2023, peer-reviewed
"Doesn't miss alerts—mission-critical trust for safety software"
Global community improving monitoring for everyone
Trusted by teams worldwide
Free forever, fully open source agent
Work from anywhere, async-friendly culture
Your work helps millions of systems
Native iOS and Android apps that put real-time alerts and AI troubleshooting in your pocket. See what’s wrong, understand why, and know how to fix it — from anywhere.

Everything you need to monitor and troubleshoot your infrastructure from your phone
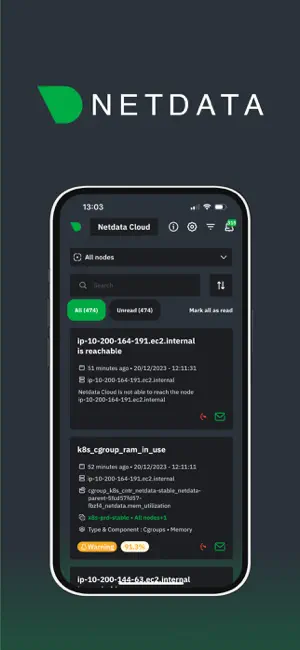
Get alerted the moment something goes wrong. 400+ pre-configured alert templates with intelligent thresholds — critical alerts can bypass Do Not Disturb.
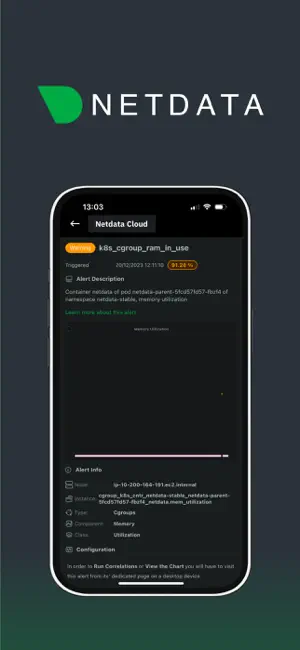
Tap ‘Ask AI’ on any alert for instant root cause analysis in plain language. What’s wrong, why it happened, and how to fix it — no laptop needed.
During incidents, the top 30-50 most relevant metrics are automatically surfaced. No hunting through dashboards — the needle in the haystack is found for you.
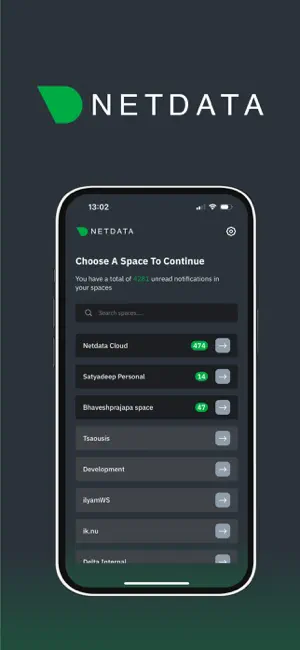
Switch between multiple Netdata Cloud spaces from a single app. Manage alerts and infrastructure across all your environments in one place.
Silence notifications during maintenance windows, set priority levels, and configure retention — all from the app’s settings.
Sub-2-second delivery from infrastructure event to your phone. Edge-native architecture means alerts are evaluated locally and pushed instantly.
Trusted by operations teams worldwide


How Netdata Mobile Compares
See how Netdata’s mobile experience compares to traditional monitoring apps.
Capability
Netdata Mobile
Traditional Monitoring
Alert Configuration
✅ Component-Level
400+ pre-configured templates
⚠️ Manual Setup
Build alerts from scratch
Notification Speed
✅ Sub-2-Second
Edge-to-mobile latency under 2 seconds
⚠️ 15-60 Seconds
Centralized processing delays
AI Troubleshooting
✅ Built-In
Ask AI, Anomaly Advisor, RCA
⚠️ Premium Add-On
Extra cost, limited mobile access
Root Cause Analysis
✅ Automated
Top 30-50 metrics identified instantly
❌ Manual
Hunt through thousands of charts
Mobile Pricing
✅ Included
Per-node pricing, unlimited users
⚠️ Per-Host + Usage
Complex pricing with data charges
Setup Time
✅ 60 Seconds
Zero configuration required
⚠️ Hours to Days
Complex setup, manual tuning
Netdata provides native mobile apps for both iOS (iPhone and iPad) and Android devices. Download from the App Store or Google Play. Both apps provide the same core functionality: push notifications, AI-powered troubleshooting, and real-time infrastructure monitoring.
Push notifications require a paid subscription - either a Business plan or Homelab plan (for personal non-commercial use only). Mobile access is included in these plans for unlimited users at no additional cost. Freelancers, professionals, and businesses should use the Business plan or Open Source. See our pricing page for details.
Netdata Mobile leverages edge-native architecture with distributed intelligence - mobile queries hit edge agents directly, not centralized databases. This delivers sub-2-second latency (vs. 15-60 seconds for competitors), 400+ pre-configured alerts for immediate value, and AI-powered troubleshooting built-in. Plus, mobile access is included at a fixed per-node price with no per-device or per-user charges - 90% cost reduction vs. competitors.
No. Netdata Mobile monitors your infrastructure (servers, containers, cloud, databases, networks) from your phone - it’s not a mobile APM tool. If you need to monitor mobile application performance (crashes, user sessions, app-specific metrics), consider tools like Firebase Crashlytics or Embrace. Netdata excels at monitoring the infrastructure that powers your applications.
Netdata ships with 400+ pre-configured component-level alert templates based on real-world operational experience. These alerts use intelligent thresholds with rolling windows that adapt to workload patterns - not simple fixed thresholds. Additionally, ML-based anomaly detection provides a separate signal that surfaces unusual behavior across all metrics, giving you another lens to view your infrastructure.
Tap ‘Ask AI’ on any alert to get instant root cause analysis in plain language. Netdata’s AI Co-Engineer analyzes complete infrastructure context, identifies the root cause, explains cascading effects, and suggests fixes - all from your mobile device. You can also generate automated AI Insights reports (Infrastructure Summary, Anomaly Analysis, Capacity Planning) in 2-3 minutes and share PDF reports with stakeholders directly from the app.
Anomaly Advisor automatically ranks thousands of metrics by relevance during incidents. Instead of manually hunting through dashboards, the root cause appears in the top 30-50 results - accessible from your mobile device. This dramatically accelerates troubleshooting by surfacing what matters most, showing cascading failures, and identifying blast radius - all without query languages or manual analysis.
Netdata delivers sub-2-second latency from infrastructure event to mobile notification. This is possible because alerts are evaluated at the edge (where data is generated), not in centralized cloud services. Alerts are evaluated locally, then immediately pushed to mobile - significantly faster than competitors that must process data through centralized databases before generating notifications.
No. Mobile access is included in your Netdata Business or Homelab plan at no additional cost. There are no per-user charges, no per-device fees, and no per-notification costs. Your entire team can use the mobile app on unlimited devices - the price is based only on the number of infrastructure nodes monitored.
Netdata Mobile requires internet connectivity to receive push notifications and query infrastructure data. However, Netdata’s edge-native architecture means agents continue collecting data locally even during network partitions. When connectivity is restored, mobile automatically reconnects and displays the latest data. For complete offline access, use Netdata’s local dashboards directly on agents/parents.
Setup takes about 60 seconds: (1) Download the app from App Store or Google Play, (2) Sign in to your Netdata Cloud account, (3) Your infrastructure appears automatically based on your existing Netdata setup. No mobile-specific configuration required - alerts, dashboards, and AI features work automatically based on your existing Netdata infrastructure.
Netdata Mobile maintains data sovereignty - all metrics and logs stay on-premises. Only metadata (node names, chart titles, alert configurations) is synchronized to Netdata Cloud. When you query data from mobile, it’s fetched directly from your distributed agents/parents, not from a centralized cloud database. Your observability data never leaves your infrastructure.
Yes. Netdata provides flexible notification routing and alert filtering. You can configure which alerts generate mobile notifications, set severity thresholds, create custom notification rules, and define different routing for on-call vs. off-shift hours. Critical alerts can bypass Do Not Disturb when configured. All settings are managed through Netdata Cloud and apply automatically to mobile.
Yes. Mobile notifications include context-rich information (affected services, baseline comparisons) that can be shared with team members. You can generate AI Insights reports from mobile and share PDF incident analyses with stakeholders. For advanced team coordination, Netdata integrates with Slack, PagerDuty, Opsgenie, and other collaboration tools.
Netdata delivers 90% cost reduction vs. Datadog/New Relic. Netdata’s fixed per-node pricing includes mobile for unlimited users, ML, AI, and logs - no per-host charges, no data volume fees, no surprise bills. See our pricing page for details.
Netdata’s distributed architecture provides resilience. If a Parent fails, agents continue collecting data locally and can connect to other Parents in your cluster. Mobile notifications continue working through available Parents. When the failed Parent recovers, agents automatically replicate any missed data. There’s no single point of failure - mobile monitoring remains operational even during partial infrastructure outages.
Yes, via Model Context Protocol (MCP). MCP is available via Netdata Cloud for infrastructure-wide access (Business/Homelab plan) and on every Agent/Parent for direct local access (free, open-source). Connect Claude, ChatGPT, Gemini, or other LLMs to ask infrastructure questions in natural language with complete context from Netdata’s edge intelligence. This ‘bring your own LLM’ approach works alongside Netdata’s managed AI features.
Yes. Netdata automatically discovers and monitors Kubernetes clusters, pods, containers, and services. Mobile alerts include container-specific context (namespace, pod name, resource limits). You can view container metrics, logs, and anomalies from mobile. Netdata’s edge-native architecture is ideal for ephemeral container environments - agents track short-lived containers without missing data.
Netdata reduces alert noise through component-level alerts with intelligent configuration - 400+ pre-configured templates based on real-world operational experience use rolling windows and adaptive thresholds, not fixed values. ML-based anomaly detection (18 models per metric) runs as a separate signal providing additional visibility into unusual behavior, but does not filter alerts directly. This combination helps you focus on actionable issues.
Netdata Mobile Apps provide native iOS/Android experiences optimized for alerts and notifications: push notifications that bypass Do Not Disturb, notification center with alert history, quick access to AI troubleshooting, and mobile-optimized alert management. Mobile web access (via browser) provides full dashboard capabilities for deep troubleshooting. Use mobile apps for alert triage and immediate response; use mobile web for comprehensive analysis when needed.
February 27, 2026
Connect AI coding agents like Claude Code, Codex, and Cursor to your entire infrastructure with a single endpoint. The Netdata Cloud MCP Server brings infrastructure-wide observability to any MCP-compatible AI tool.
February 3, 2026
Join Netdata at the Howard Conference and Expo 'Game On' event, February 24-26, 2026 in Fairhope, Alabama. Learn how real-time, high-fidelity monitoring helps you stay ahead of infrastructure challenges.
February 3, 2026
Visit Netdata at Tech Show London, March 4-5 at ExCeL London. Stop by Booth F223 in the Cloud & AI Infrastructure zone to see how high-fidelity monitoring transforms your infrastructure operations.
Available for iOS and Android. Set up in 60 seconds.
See how Netdata can improve visibility, reduce downtime, and simplify monitoring — no commitment required.