The only agent that thinks for itself

Autonomous Monitoring with self-learning AI built-in, operating independently across your entire stack.

Unlimited Metrics & Logs
Machine learning & MCP
5% CPU, 150MB RAM
3GB disk, >1 year retention
800+ integrations, zero config
Dashboards, alerts out of the box
> Discover Netdata Agents
Centralized metrics streaming and storage

Aggregate metrics from multiple agents into centralized Parent nodes for unified monitoring across your infrastructure.

Stream from unlimited agents
Long-term data retention
High availability clustering
Data replication & backup
Scalable architecture
Enterprise-grade security
> Learn about Parents
Fully managed cloud platform

Access your monitoring data from anywhere with our SaaS platform. No infrastructure to manage, automatic updates, and global availability.

Zero infrastructure management
99.9% uptime SLA
Global data centers
Automatic updates & patches
Enterprise SSO & RBAC
SOC2 & ISO certified
> Explore Netdata Cloud
Deploy Netdata Cloud in your infrastructure

Run the full Netdata Cloud platform on-premises for complete data sovereignty and compliance with your security policies.

Complete data sovereignty
Air-gapped deployment
Custom compliance controls
Private network integration
Dedicated support team
Kubernetes & Docker support
> Learn about Cloud On-Premises
Powerful, intuitive monitoring interface

Modern, responsive UI built for real-time troubleshooting with customizable dashboards and advanced visualization capabilities.

Real-time chart updates
Customizable dashboards
Dark & light themes
Advanced filtering & search
Responsive on all devices
Collaboration features
> Explore Netdata UI
Monitor on the go

Native iOS and Android apps bring full monitoring capabilities to your mobile device with real-time alerts and notifications.

iOS & Android apps
Push notifications
Touch-optimized interface
Offline data access
Biometric authentication
Widget support
> Download apps

Best energy efficiency

True real-time per-second

100% automated zero config

Centralized observability

Multi-year retention

High availability built-in

Zero maintenance

Always up-to-date

Enterprise security

Complete data control

Air-gap ready

Compliance certified

Millisecond responsiveness

Infinite zoom & pan

Works on any device

Native performance

Instant alerts

Monitor anywhere

80% Faster Incident Resolution
AI-powered troubleshooting from detection, to root cause and blast radius identification, to reporting.
True Real-Time and Simple, even at Scale
Linearly and infinitely scalable full-stack observability, that can be deployed even mid-crisis.
90% Cost Reduction, Full Fidelity
Instead of centralizing the data, Netdata distributes the code, eliminating pipelines and complexity.
Control Without Surrender
SOC 2 Type 2 certified with every metric kept on your infrastructure.
Integrations

800+ collectors and notification channels, auto-discovered and ready out of the box.

800+ data collectors
Auto-discovery & zero config
Cloud, infra, app protocols
Notifications out of the box
> Explore integrations
Real Results
46% Cost Reduction

Reduced monitoring costs by 46% while cutting staff overhead by 67%.

— Leonardo Antunez, Codyas

Zero Pipeline

No data shipping. No central storage costs. Query at the edge.

From Our Users
"Out-of-the-Box"

So many out-of-the-box features! I mostly don't have to develop anything.

— Simon Beginn, LANCOM Systems

No Query Language

Point-and-click troubleshooting. No PromQL, no LogQL, no learning curve.

Enterprise Ready
67% Less Staff, 46% Cost Cut

Enterprise efficiency without enterprise complexity—real ROI from day one.

— Leonardo Antunez, Codyas

SOC 2 Type 2 Certified

Zero data egress. Only metadata reaches the cloud. Your metrics stay on your infrastructure.

Full Coverage
800+ Collectors

Auto-discovered and configured. No manual setup required.

Any Notification Channel

Slack, PagerDuty, Teams, email, webhooks—all built-in.

From Our Users
"A Rare Unicorn"

Netdata gives more than you invest in it. A rare unicorn that obeys the Pareto rule.

— Eduard Porquet Mateu, TMB Barcelona

99% Downtime Reduction

Reduced website downtime by 99% and cloud bill by 30% using Netdata alerts.

— Falkland Islands Government

Real Savings
30% Cloud Cost Reduction

Optimized resource allocation based on Netdata alerts cut cloud spending by 30%.

— Falkland Islands Government

46% Cost Cut

Reduced monitoring staff by 67% while cutting operational costs by 46%.

— Codyas

Real Coverage
"Plugin for Everything"

Netdata has agent capacity or a plugin for everything, including Windows and Kubernetes.

— Eduard Porquet Mateu, TMB Barcelona

"Out-of-the-Box"

So many out-of-the-box features! I mostly don't have to develop anything.

— Simon Beginn, LANCOM Systems

Real Speed
Troubleshooting in 30 Seconds

From 2-3 minutes to 30 seconds—instant visibility into any node issue.

— Matthew Artist, Nodecraft

20% Downtime Reduction

20% less downtime and 40% budget optimization from out-of-the-box monitoring.

— Simon Beginn, LANCOM Systems

Pay per Node. Unlimited Everything Else.

One price per node. Unlimited metrics, logs, users, and retention. No per-GB surprises.

Free tier—forever
No metric limits or caps
Retention you control
Cancel anytime
> See pricing plans
What's Your Monitoring Really Costing You?

Most teams overpay by 40-60%. Let's find out why.

Expose hidden metric charges
Calculate tool consolidation
Customers report 30-67% savings
Results in under 60 seconds
> See what you're really paying
Your Infrastructure Is Unique. Let's Talk.

Because monitoring 10 nodes is different from monitoring 10,000.

On-prem & air-gapped deployment
Volume pricing & agreements
Architecture review for your scale
Compliance & security support
> Start a conversation
Monitoring That Sells Itself

Deploy in minutes. Impress clients in hours. Earn recurring revenue for years.

30-second live demos close deals
Zero config = zero support burden
Competitive margins & deal protection
Response in 48 hours
> Apply to partner
Per-Second Metrics at Homelab Prices

Same engine, same dashboards, same ML. Just priced for tinkerers.

Community: Free forever · 5 nodes · non-commercial
Homelab: $90/yr · unlimited nodes · fair usage
> Start monitoring your lab—free
$1,000 Per Referral. Unlimited Referrals.

Your colleagues get 10% off. You get 10% commission. Everyone wins.

10% of subscriptions, up to $1,000 each
Track earnings inside Netdata Cloud
PayPal/Venmo payouts in 3-4 weeks
No caps, no complexity
> Get your referral link
Cost Proof
40% Budget Optimization

"Netdata's significant positive impact" — LANCOM Systems

Calculate Your Savings

Compare vs Datadog, Grafana, Dynatrace

Savings Proof
46% Cost Reduction

"Cut costs by 46%, staff by 67%" — Codyas

30% Cloud Bill Savings

"Reduced cloud bill by 30%" — Falkland Islands Gov

Enterprise Proof
"Better Than Combined Alternatives"

"Better observability with Netdata than combining other tools." — TMB Barcelona

Real Engineers, <24h Response

DPA, SLAs, on-prem, volume pricing

Why Partners Win
Demo Live Infrastructure

One command, 30 seconds, real data—no sandbox needed

Zero Tickets, High Margins

Auto-config + per-node pricing = predictable profit

Homelab Ready
"Absolutely Incredible"

"We tested every monitoring system under the sun." — Benjamin Gabler, CEO Rocket.Net

76k+ GitHub Stars

3rd most starred monitoring project

Worth Recommending
Product That Delivers

Customers report 40-67% cost cuts, 99% downtime reduction

Zero Risk to Your Rep

Free tier lets them try before they buy

Never Fight Fires Alone

Docs, community, and expert help—pick your path to resolution.

Learn.netdata.cloud docs
Discord, Forums, GitHub
Premium support available
> Get answers now
60 Seconds to First Dashboard

One command to install. Zero config. 850+ integrations documented.

Linux, Windows, K8s, Docker
Auto-discovers your stack
> Start monitoring now
See Netdata in Action

Watch real-time monitoring in action—demos, tutorials, and engineering deep dives.

Product demos and walkthroughs
Real infrastructure, not staged
> Start with the 3-minute tour
Level Up Your Monitoring
Real problems. Real solutions. 112+ guides from basic monitoring to AI observability.
76,000+ Engineers Strong
615+ contributors. 1.5M daily downloads. One mission: simplify observability.
Per-Second. 90% Cheaper. Data Stays Home.
Side-by-side comparisons: costs, real-time granularity, and data sovereignty for every major tool.

See why teams switch from Datadog, Prometheus, Grafana, and more.

> Browse all comparisons
Edge-Native Observability, Born Open Source
Per-second visibility, ML on every metric, and data that never leaves your infrastructure.
Founded in 2016
615+ contributors worldwide
Remote-first, engineering-driven
Open source first
> Read our story
Promises We Publish—and Prove
12 principles backed by open code, independent validation, and measurable outcomes.
Open source, peer-reviewed
Zero config, instant value
Data sovereignty by design
Aligned pricing, no surprises
> See all 12 principles
Edge-Native, AI-Ready, 100% Open
76k+ stars. Full ML, AI, and automation—GPLv3+, not premium add-ons.
76,000+ GitHub stars
GPLv3+ licensed forever
ML on every metric, included
Zero vendor lock-in
> Explore our open source
Build Real-Time Observability for the World
Remote-first team shipping per-second monitoring with ML on every metric.
Remote-first, fully distributed
Open source (76k+ stars)
Challenging technical problems
Your code on millions of systems
> See open roles
Talk to a Netdata Human in <24 Hours
Sales, partnerships, press, or professional services—real engineers, fast answers.
Discuss your observability needs
Pricing and volume discounts
Partnership opportunities
Media and press inquiries
> Book a conversation
Your Data. Your Rules.
On-prem data, cloud control plane, transparent terms.
Trust & Scale
76,000+ GitHub Stars

One of the most popular open-source monitoring projects

SOC 2 Type 2 Certified

Enterprise-grade security and compliance

Data Sovereignty

Your metrics stay on your infrastructure

Validated
University of Amsterdam

"Most energy-efficient monitoring solution" — ICSOC 2023, peer-reviewed

ADASTEC (Autonomous Driving)

"Doesn't miss alerts—mission-critical trust for safety software"

Community Stats
615+ Contributors

Global community improving monitoring for everyone

1.5M+ Downloads/Day

Trusted by teams worldwide

GPLv3+ Licensed

Free forever, fully open source agent

Why Join?
Remote-First

Work from anywhere, async-friendly culture

Impact at Scale

Your work helps millions of systems

Compliance
SOC 2 Type 2

Audited security controls

GDPR Ready

Data stays on your infrastructure

Netdata Agents

Complete Observability Engines That Run Everywhere

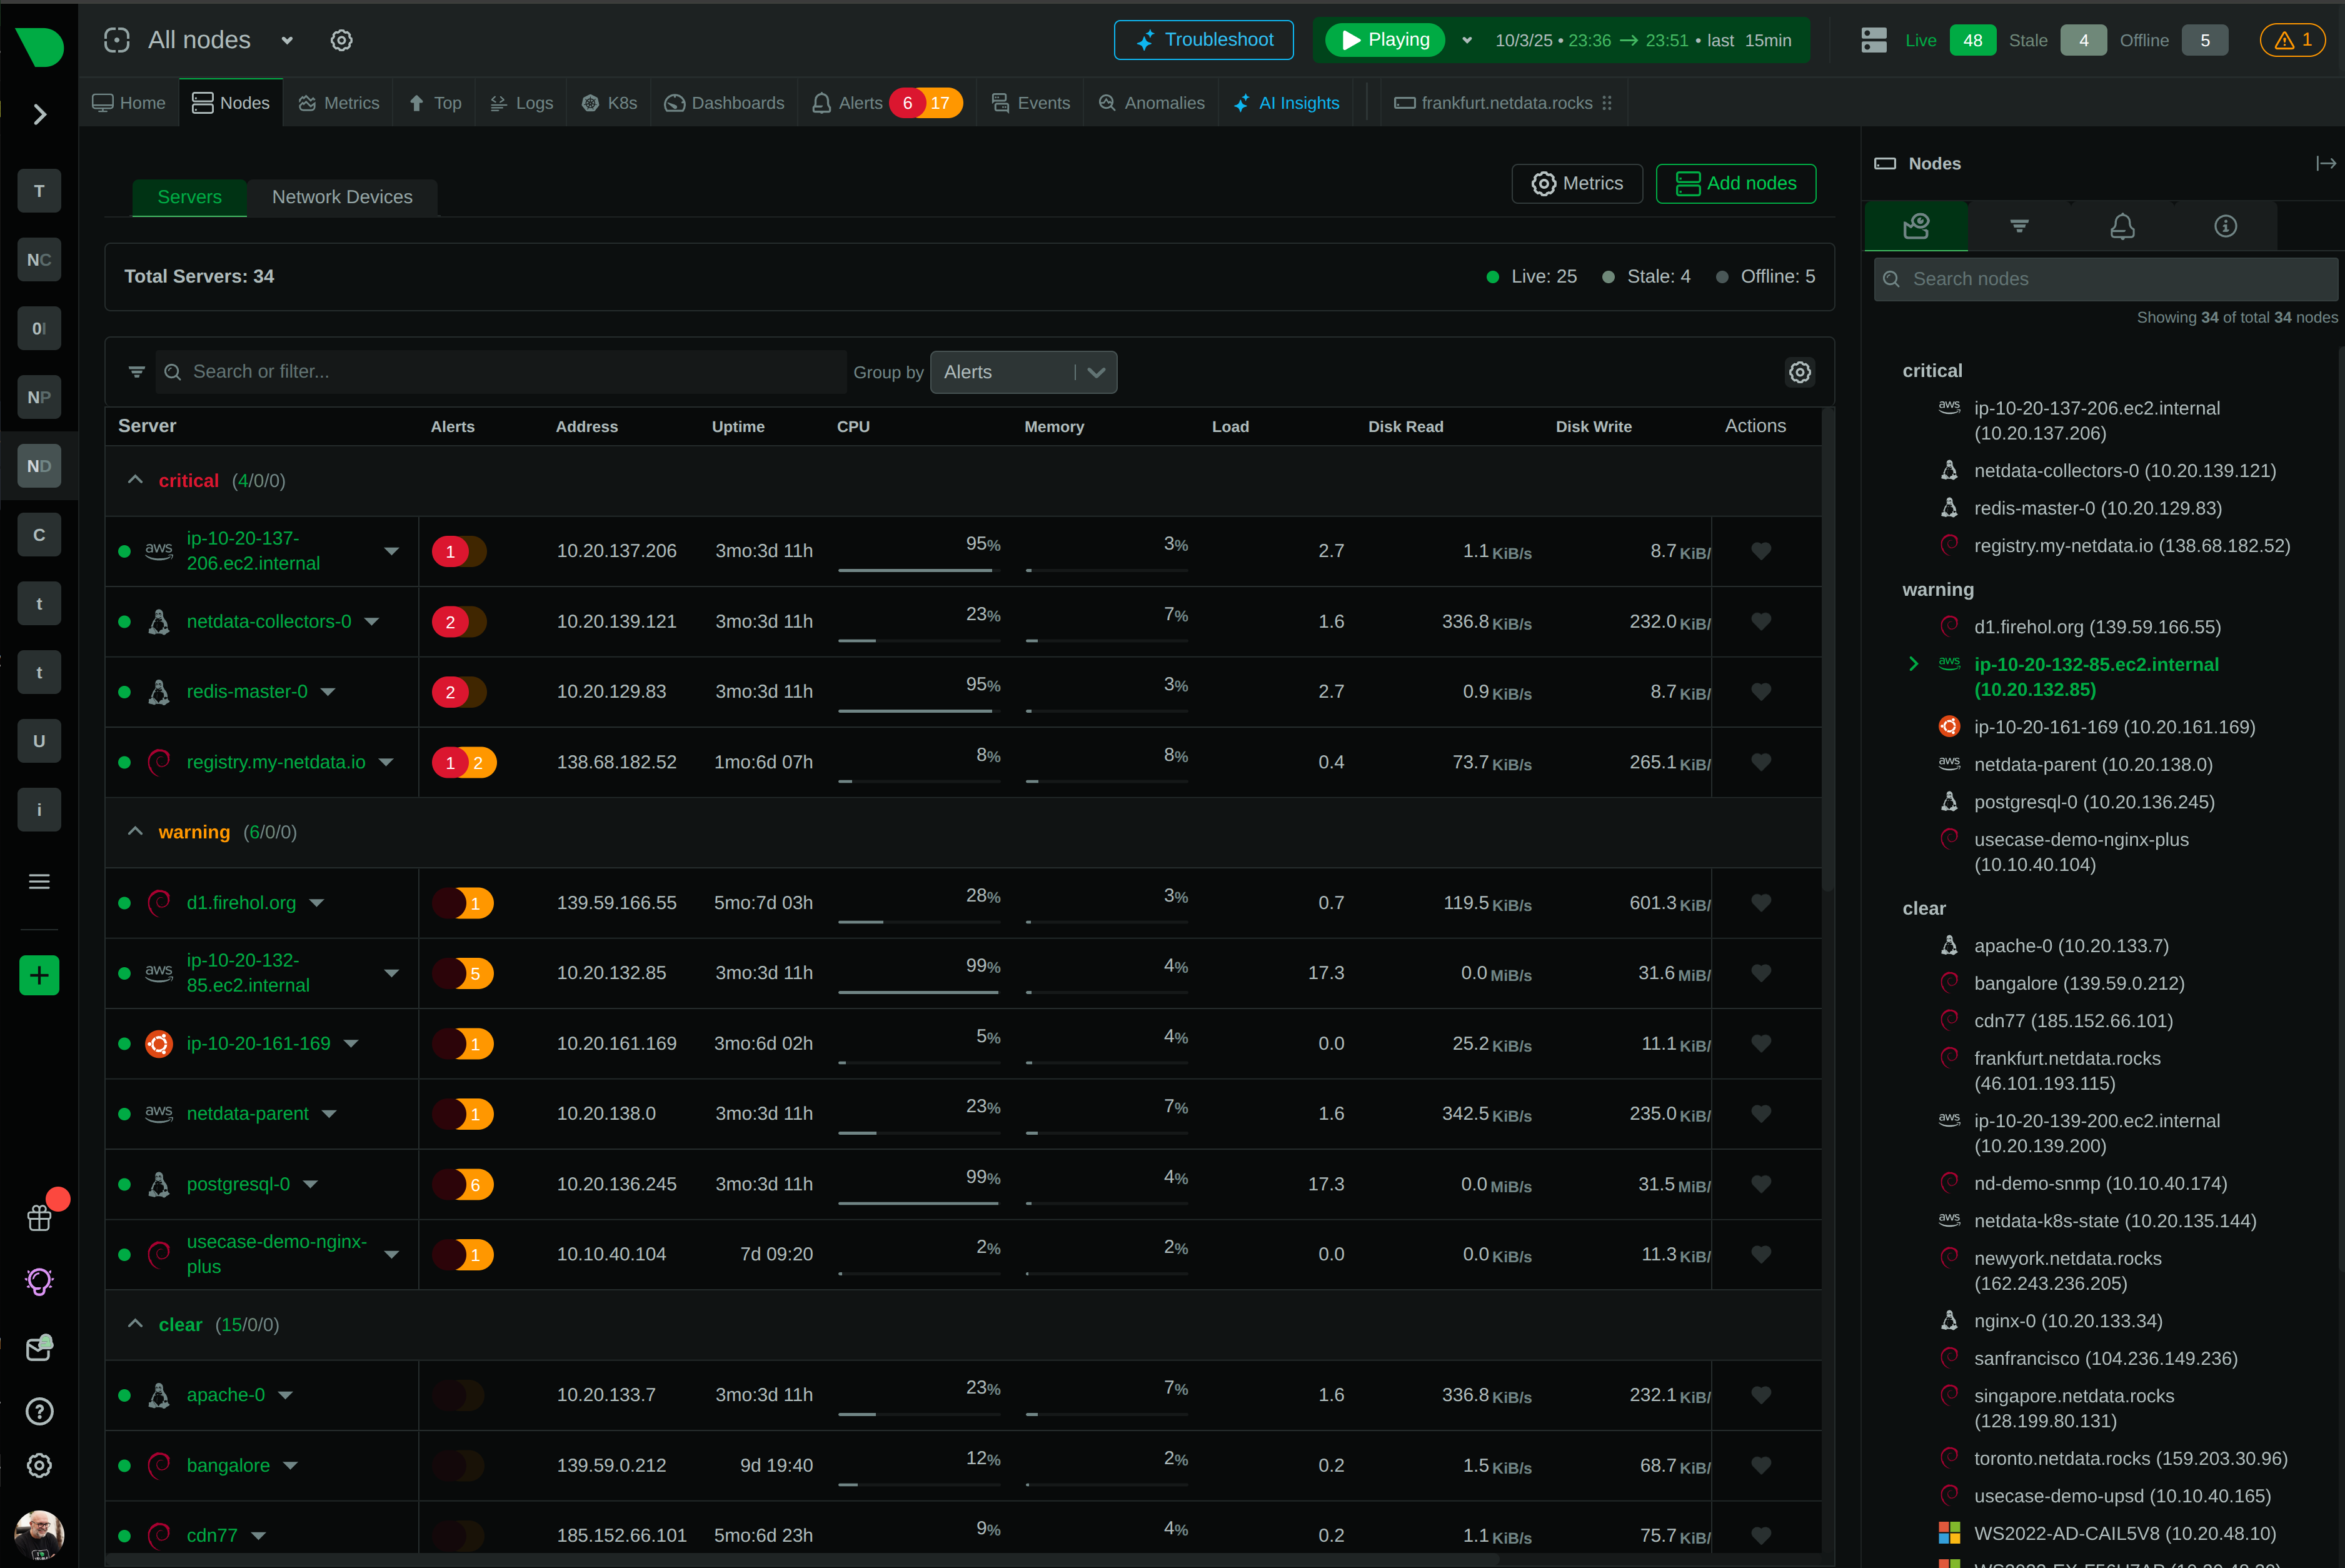
Each Netdata Agent is a full monitoring system - collection, storage, ML, alerts, dashboards - working autonomously at the edge. Deploy in 60 seconds, monitor everything instantly, troubleshoot with AI. No configuration, no complexity, no compromise.

Background Hero

Why Netdata Agents Stand Apart

Six innovations that redefine what monitoring agents can do

True Real-Time Visibility

Per-second data collection with sub-2-second latency. Catch the 3-second spike that triggers a 30-second outage - invisible to minute-based monitoring.

Edge Intelligence Built In

Each agent runs 18 ML models per metric, achieving 99% false positive reduction in anomaly detection. AI troubleshooting explains issues in plain language.

60-Second Deployment

One-line install, instant dashboards, 800+ integrations auto-discovered. Full visibility from the moment you deploy - no configuration, no waiting.

Complete Autonomy

Every agent is a full observability engine with collection, storage, ML, alerts, and dashboards. Works independently, collaborates seamlessly.

Predictable Economics

Transparent per-node pricing with unlimited metrics, logs, and users. 90% cost reduction versus volume-based platforms - no surprise bills.

Console Replacement

Browser-based access to all CLI tools - top, iostat, netstat, journalctl - with history, ML context, and AI guidance. Debug without SSH.

Trusted by operations teams worldwide

Edge Intelligence That Transforms Operations

See What Others Miss With Per-Second Precision

Traditional monitoring collects data every 30-60 seconds, missing 90% of transient issues. Netdata’s per-second granularity reveals microbursts, cascading failures, and security threats invisible to averaged data. When a database query spikes to 100% CPU for 3 seconds every 20 seconds, minute-based tools show harmless 15% average load. Netdata shows the damaging spike pattern - enabling accurate diagnosis and faster resolution.

10-60× more granular than standard monitoring

Learn about real-time monitoring

See What Others Miss With Per-Second Precision

Distribute Intelligence Instead of Centralizing Data

Each Netdata Agent is a complete monitoring system - not just a data forwarder. It collects metrics, stores them locally in multi-tier databases, trains 18 ML models per metric, evaluates health checks, triggers alerts, and serves dashboards independently. This distributed architecture eliminates centralized bottlenecks, reduces bandwidth costs, ensures data sovereignty, and scales linearly to any size. Add 1,000 nodes or 100,000 - performance remains consistent.

36% less CPU, 88% less RAM vs Prometheus at scale

Explore edge architecture

Distribute Intelligence Instead of Centralizing Data

Troubleshoot Production Without Ever Logging In

Netdata replaces SSH access with browser-based diagnostics that provide console-quality precision plus historical context. Access all traditional CLI tools - top, iostat, netstat, ss, df, free, iotop, htop, systemd-cgtop, journalctl - unified in one interface with per-second updates, ML anomaly context, and AI-powered guidance. Operations teams debug production securely without infrastructure access. Junior engineers operate at senior level with AI explaining issues in plain language.

Replaces dozens of console tools with history and ML

See Netdata Functions

Troubleshoot Production Without Ever Logging In

Machine Learning That Detects Real Anomalies

Netdata trains 18 unsupervised k-means models per metric automatically at the edge - no configuration, no tuning, no thresholds to set. Anomalies are flagged only when all 18 models agree, achieving 99% false positive reduction in anomaly detection. The Anomaly Advisor correlation engine cuts through thousands of metrics to surface root cause in the top 30-50 results. Models retrain every 3 hours, adapting continuously to infrastructure changes while consuming just 18KB RAM per metric.

99% false positive reduction in anomaly detection

Discover ML capabilities

Machine Learning That Detects Real Anomalies

AI Troubleshooting in Your Language

Ask questions about your infrastructure in plain English - no PromQL, SQL, or custom query languages required. Netdata’s AI has complete context: per-second metrics, ML anomalies, logs, topology, alert history. Choose managed AI via Netdata Cloud (includes 10 free sessions monthly with optimized playbooks) or bring your own LLM via Model Context Protocol running directly on agents. One-click ‘Ask AI’ on every alert provides instant explanations with recommended actions. AI Insights generates automated reports for capacity planning, performance optimization, and anomaly analysis.

80% MTTR reduction with AI-powered root cause analysis

Explore AI features

AI Troubleshooting in Your Language

Logs Without Pipelines, 90% Cost Reduction

Netdata eliminates log pipelines entirely through direct systemd-journal access on Linux and Windows Event Log on Windows. No log shipping, no Elasticsearch clusters, no Splunk licenses, no ingestion fees. Every field in every log entry is automatically indexed by the operating system - Netdata just makes it queryable at scale. Analyze 1 million entries before sampling versus 5,000 for traditional tools (200× more accurate). Instant correlation with metrics from the same source eliminates timestamp matching complexity. Forward Secure Sealing provides tamper detection for compliance.

200× query accuracy, 90% cost savings vs Elasticsearch/Splunk

Learn about logs management

Logs Without Pipelines, 90% Cost Reduction

How Netdata Agents Compare

Netdata vs Traditional Monitoring Agents

See how Netdata’s edge-native architecture delivers superior capabilities at a fraction of the cost

Capability

Netdata Agents

Traditional Agents

Data Granularity

✅ Per-Second
True real-time with 1s collection

⚠️ Per-Minute
30-60s intervals miss transient issues

Time to First Dashboard

✅ 60 Seconds
Instant visibility, zero configuration

⚠️ Days to Weeks
Manual dashboard building required

Machine Learning

✅ Included
18 models per metric, automatic

❌ Not Available
Requires separate tools or paid add-ons

Agent Footprint

✅ <5% CPU, 150-200MB RAM
Independently validated lowest overhead

⚠️ Higher Resource Usage
Significant production system impact

Storage Architecture

✅ Edge-Native
0.6 bytes/sample, multi-tier local storage

⚠️ Centralized
Expensive cloud storage with egress fees

Pricing Model

✅ Per-Node Flat Rate
Unlimited metrics, logs, users

❌ Volume-Based
Per-metric, per-log, per-feature charges

Query Language Required

✅ None
Point-and-click analysis, natural language AI

❌ PromQL/SQL Required
Steep learning curve for queries

Log Management

✅ Direct Access
No pipelines, 90% cost reduction

⚠️ Pipeline Required
Elasticsearch/Splunk infrastructure needed

Console Tools Access

✅ Built-In
All CLI tools in browser with history

❌ SSH Required
Separate access for troubleshooting

AI Troubleshooting

✅ Integrated
Managed AI or bring your own LLM

❌ Not Available
Generic chatbots without infrastructure context

Start Free 14-Day Trial →

Technical Capabilities That Set Netdata Apart

Kernel-Level Visibility Without Code Changes

Netdata leverages eBPF for kernel-space monitoring with significantly lower overhead than traditional userspace agents. Zero instrumentation required - monitor process lifecycles, system calls, network packets, file access, memory allocation, and CPU scheduling directly from the kernel.

Kernel-level insights

Learn about eBPF monitoring
eBPF Observability Dashboard

Key Advantages of Netdata Agents

Six reasons operations teams choose Netdata for edge observability

Frequently Asked Questions