Consolidate Tools Without Sacrificing Coverage
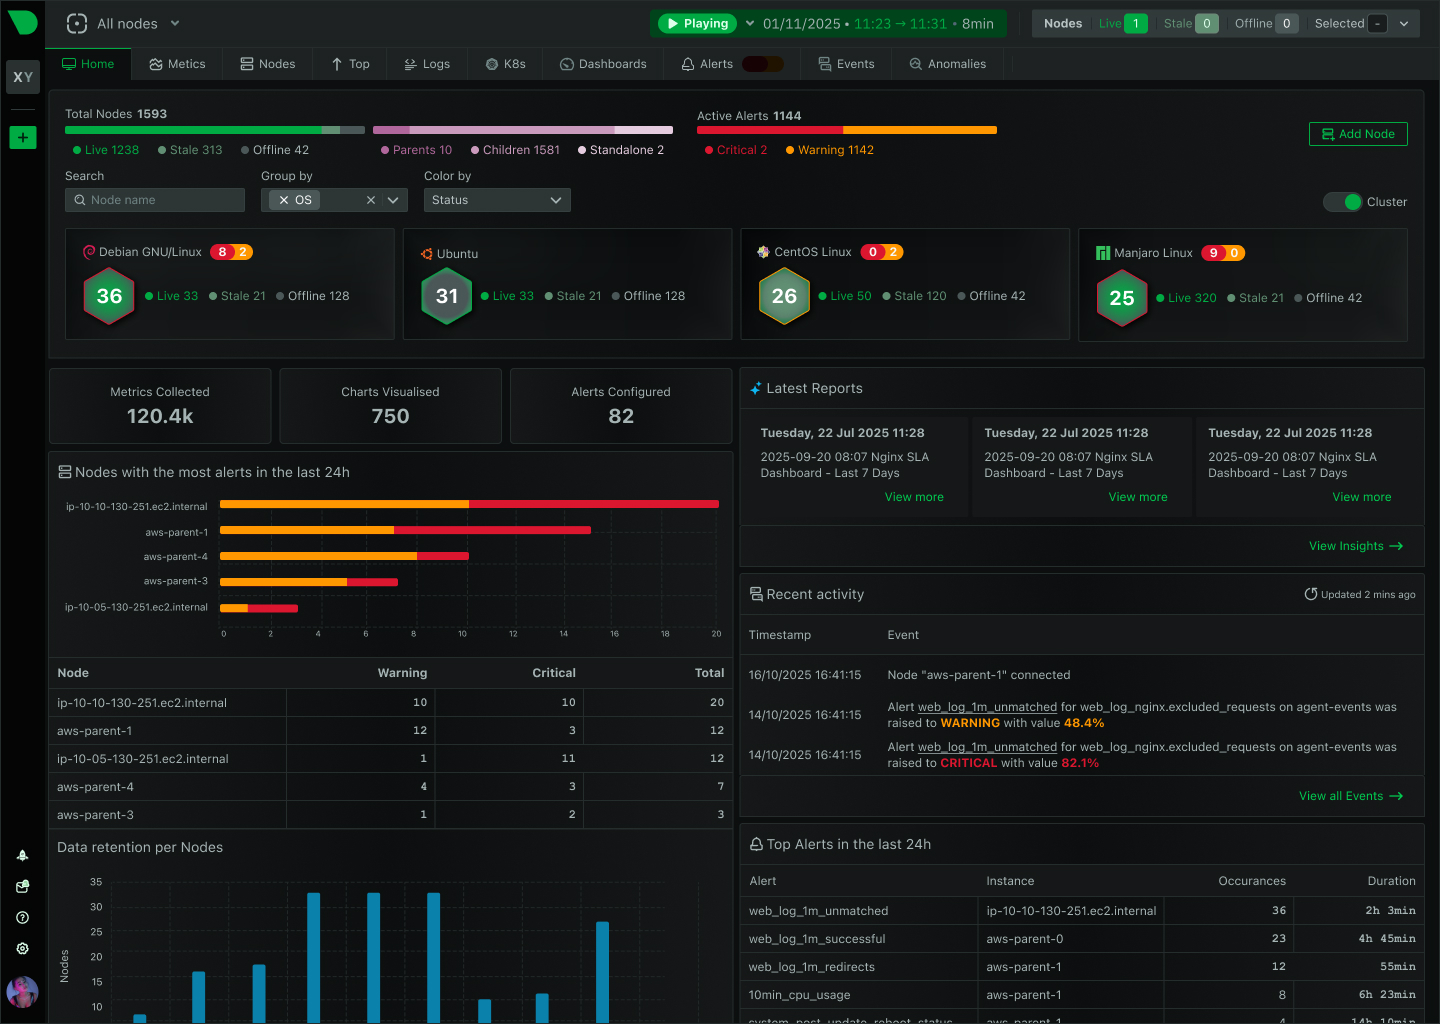
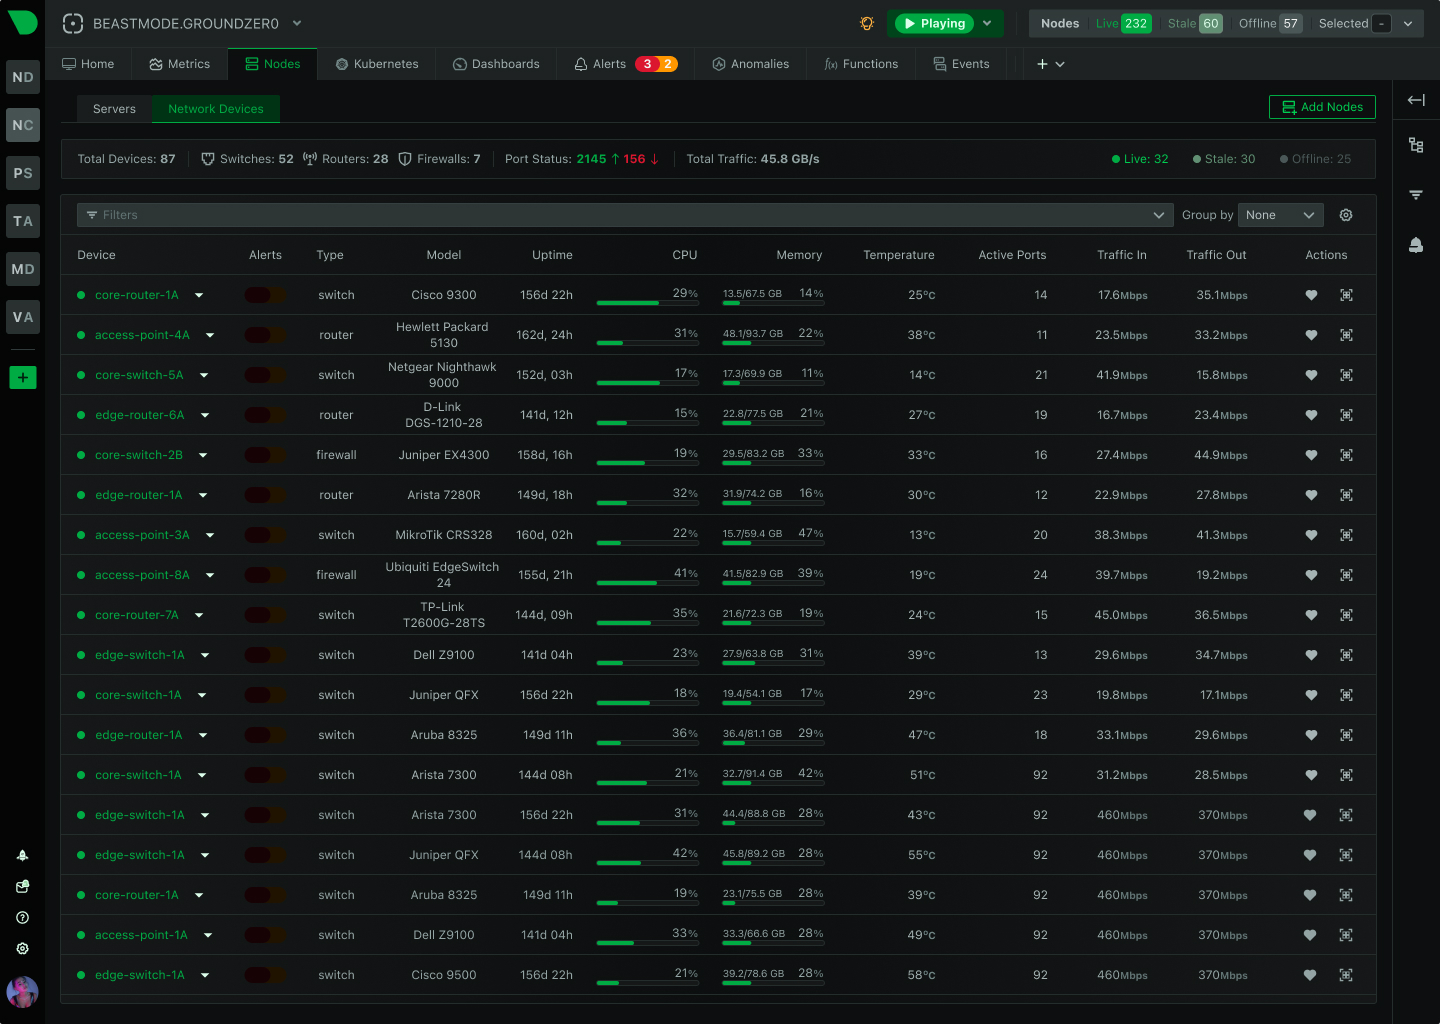
Retail teams juggle multiple monitoring tools - Prometheus for metrics, Elasticsearch for logs, Grafana for dashboards, separate alerting, custom scripts for POS monitoring. Each tool adds complexity, cost, and context-switching delays during incidents. Netdata replaces this fragmentation with a unified platform: metrics, logs, ML anomaly detection, alerts, and dashboards in one binary. Monitor POS hosts, payment databases, store networks, IoT sensors, and cloud infrastructure from a single interface - no PromQL, no pipeline configuration, no dashboard building.
90% cost reduction vs traditional monitoring stacks
Explore Unified Platform