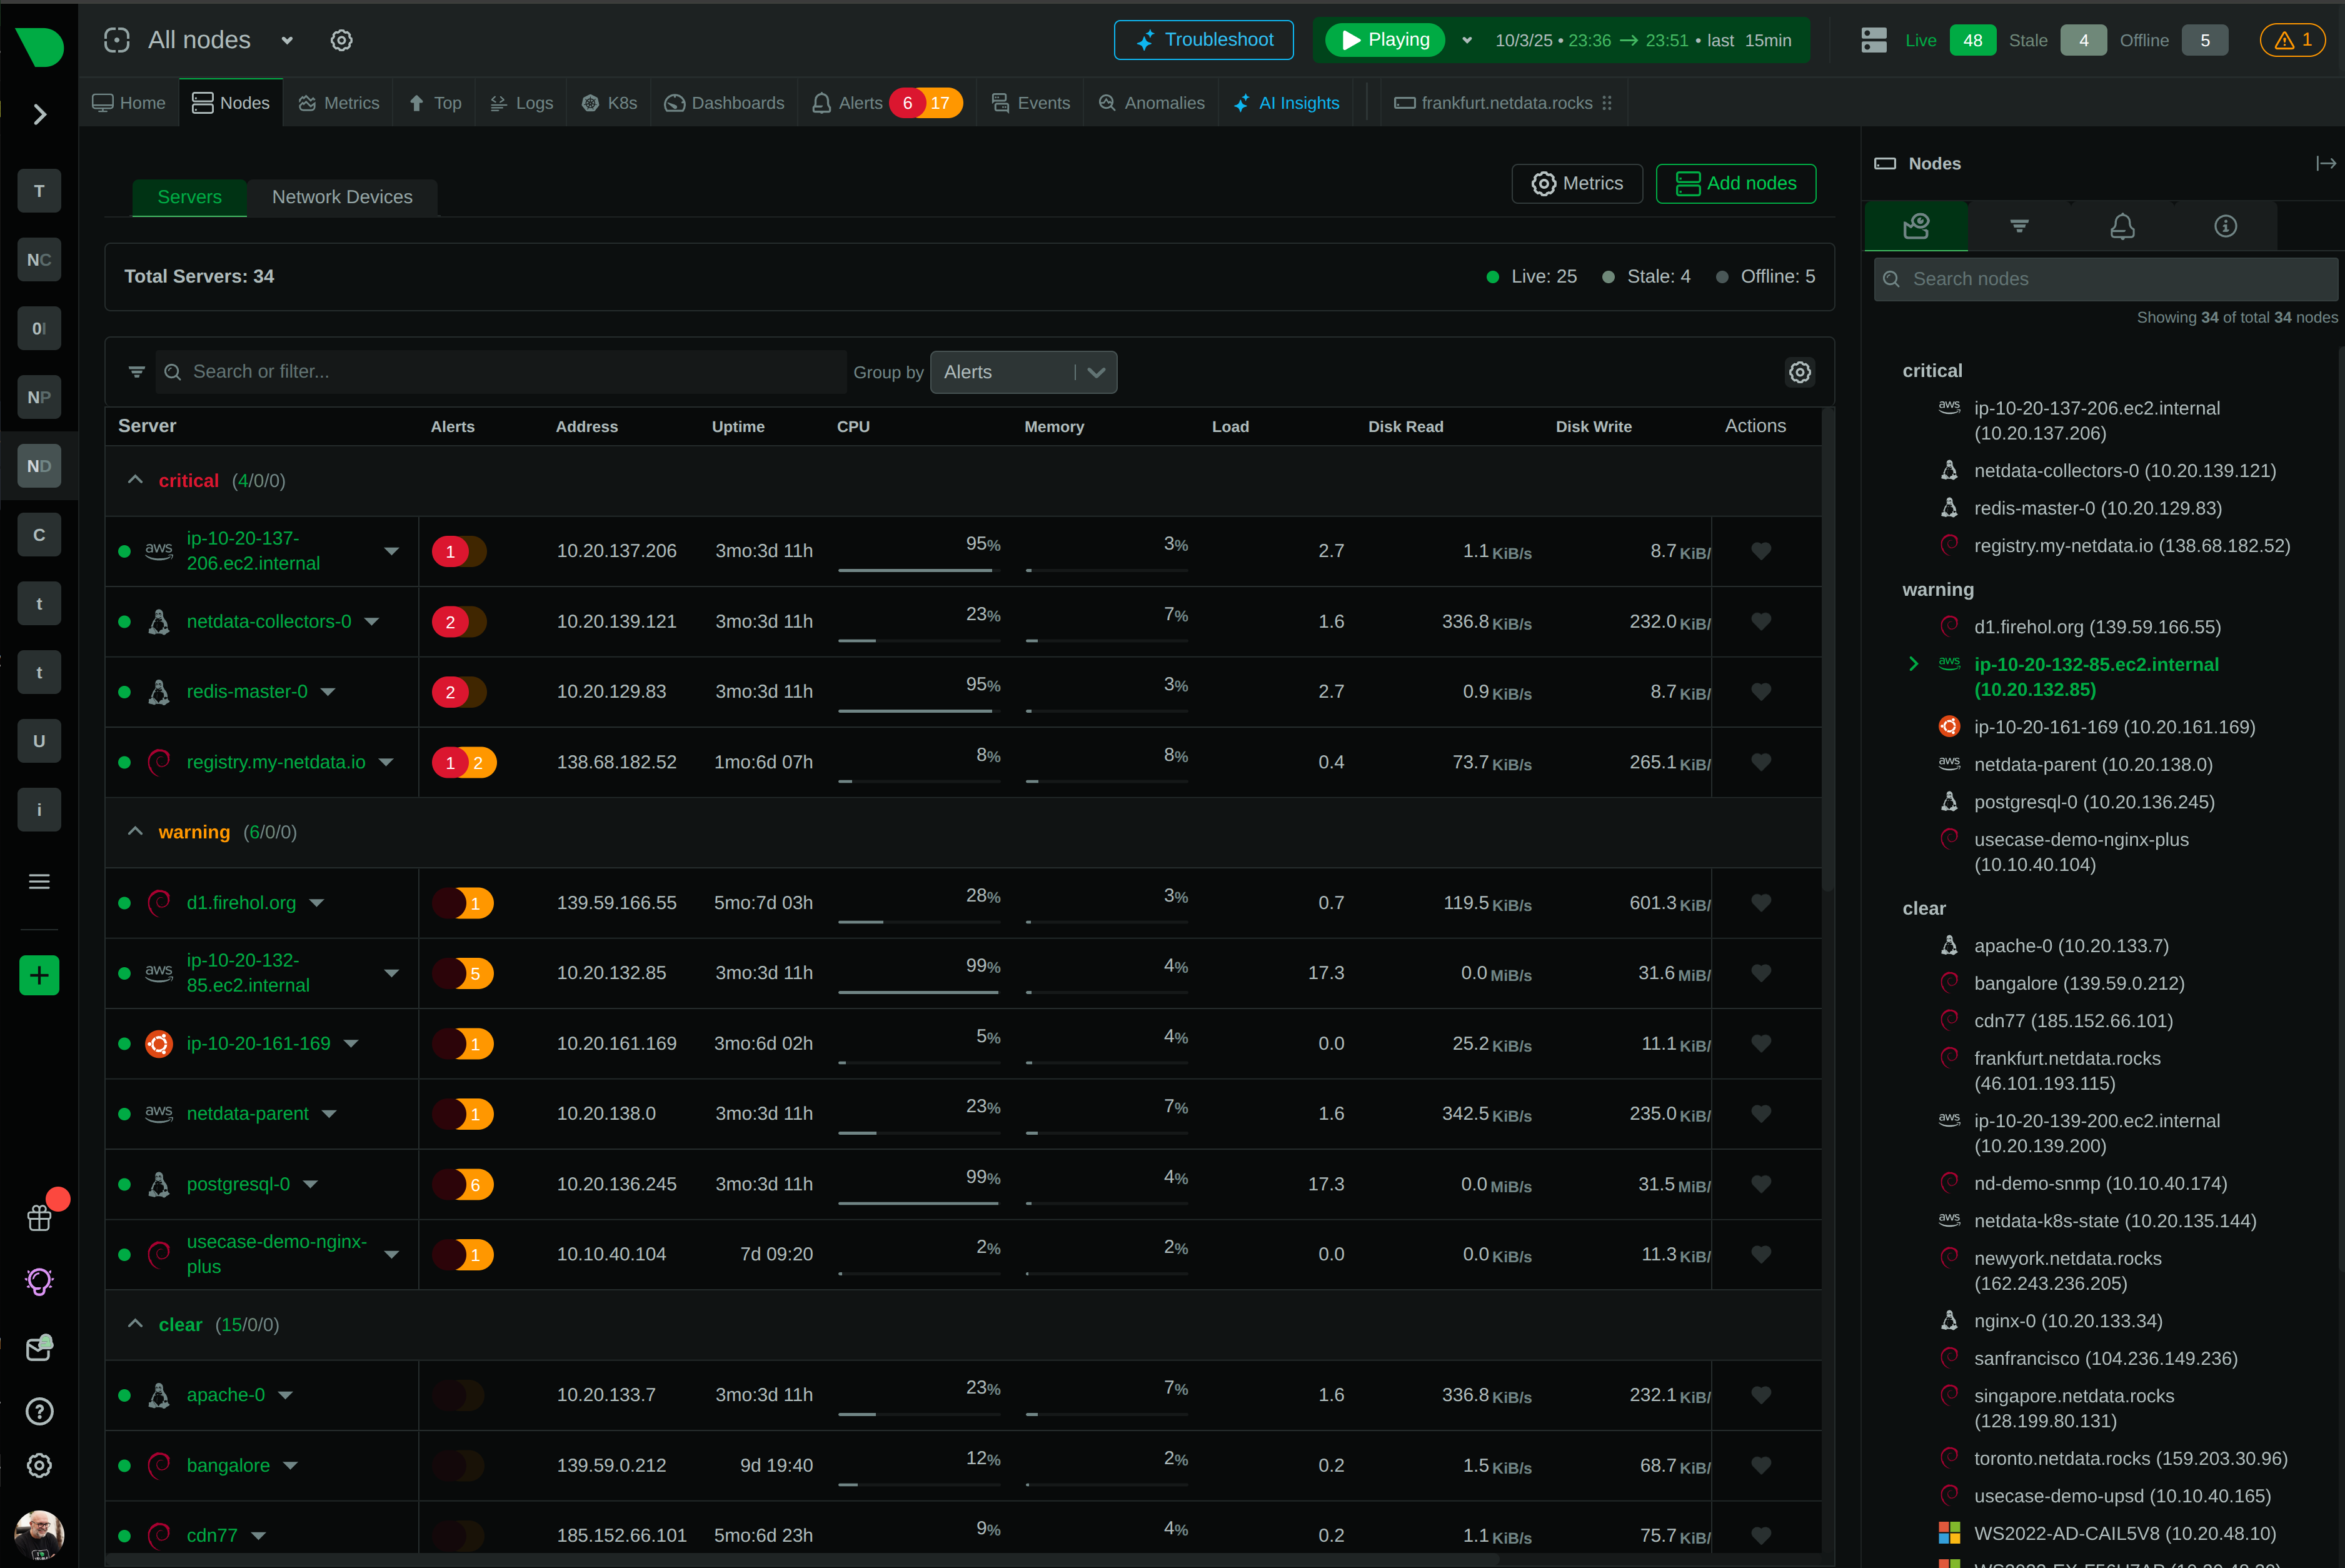
See Every Signal in Your Network Infrastructure
Real-time observability for telecommunications operators transitioning to cloud-native 5G. Monitor infrastructure at per-second precision with predictable per-node pricing and zero configuration.


Real-time observability for telecommunications operators transitioning to cloud-native 5G. Monitor infrastructure at per-second precision with predictable per-node pricing and zero configuration.
Complete infrastructure visibility without the complexity
Catch 2-10 second anomalies invisible to minute-based monitoring. Real-time visibility reveals true network behavior.
Per-node pricing with unlimited metrics and logs. No surprise bills from data volume spikes.
Auto-discovery of infrastructure, containers, and applications. Zero configuration from installation to full dashboards.
18 models per metric detect issues automatically. Edge-based intelligence with consensus-based detection.
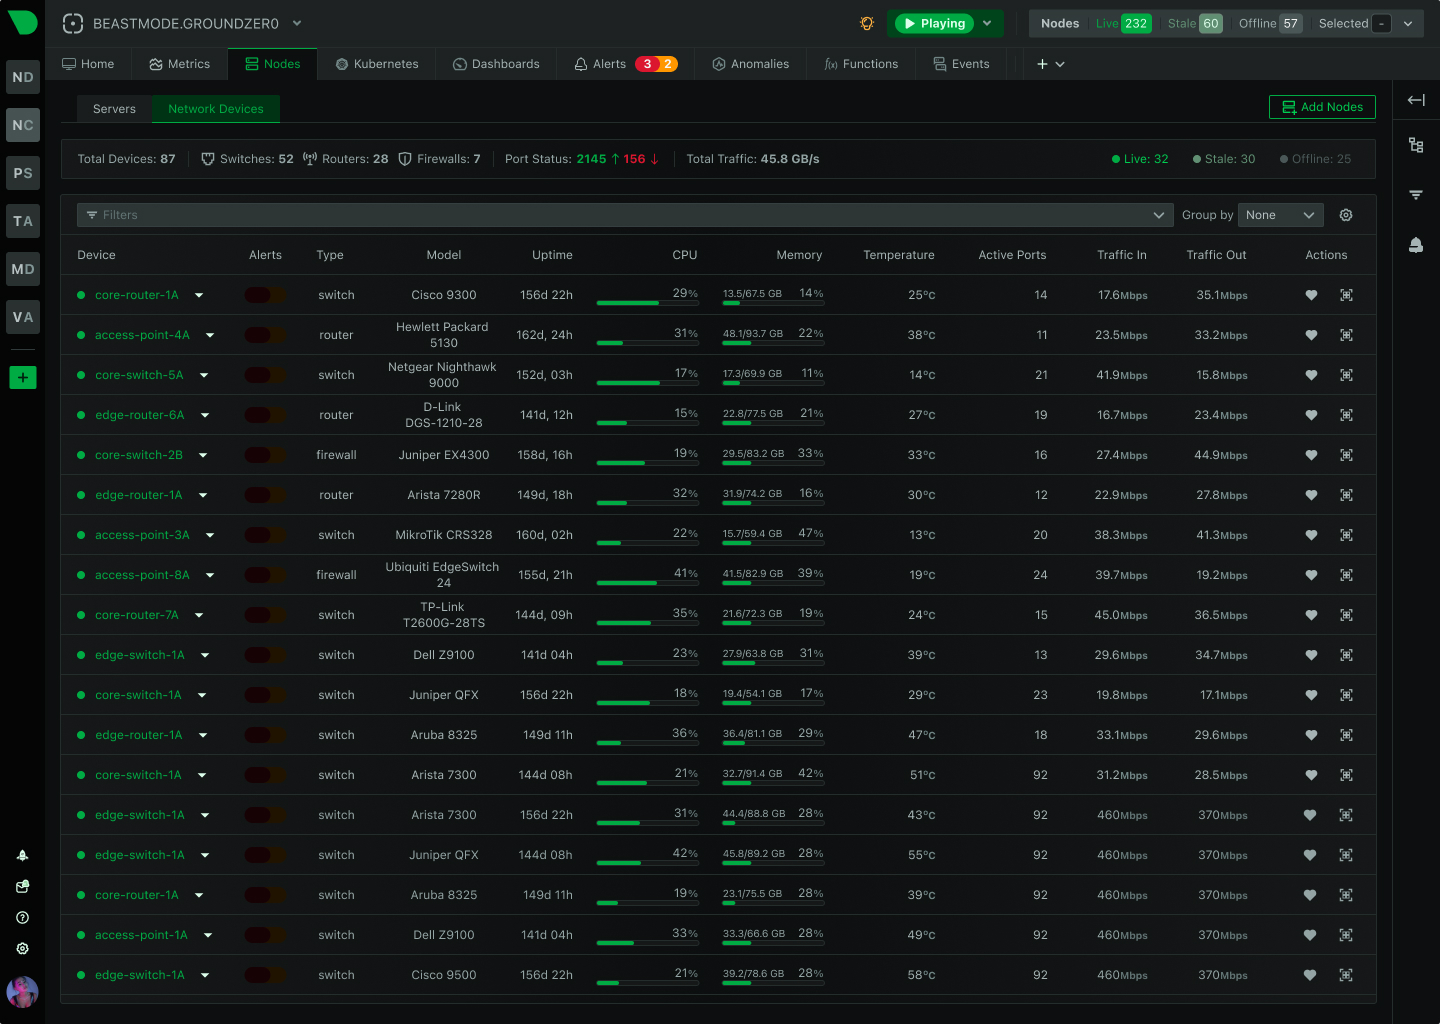
200+ SNMP profiles for Cisco, Juniper, Huawei, Nokia, Arista. Single agent monitors all vendors.
Native Kubernetes monitoring with per-pod visibility. Complete observability for containerized 5G infrastructure.
Trusted by operations teams worldwide
100% visibility in days, not months
See Auto-Discovery
80% MTTR reduction
Explore AI Features

Predictable per-node pricing
View Pricing

One platform for all vendors
See Integrations

Autonomous operation at <5% CPU
Learn Edge Architecture

Zero-config Kubernetes monitoring
Explore Kubernetes


Netdata vs Traditional Telecom Monitoring
Compare Netdata’s distributed edge architecture against traditional centralized monitoring platforms. See how per-second precision, zero-configuration deployment, and predictable costs transform telecom operations.
Capability
Netdata
Traditional Monitoring
Data Granularity
✅ Per-Second
Catches 2-10 second anomalies others miss
⚠️ Per-Minute
Averages hide critical performance patterns
Deployment Time
✅ 60 Seconds
Auto-discovery to full dashboards instantly
⚠️ Weeks to Months
Manual configuration and dashboard building
Pricing Model
✅ Per-Node Pricing
Unlimited metrics and logs included
⚠️ Volume-Based
Unpredictable bills from data growth
ML Anomaly Detection
✅ 18 Models per Metric
Edge-based with consensus detection
⚠️ Cloud-Based Selective
Additional cost and latency
Multi-Vendor Support
✅ 200+ SNMP Profiles
Cisco, Juniper, Huawei, Nokia, Arista
⚠️ Limited Coverage
Vendor-specific agents required
Data Sovereignty
✅ 100% On-Premises
Zero metrics leave infrastructure
⚠️ Cloud-Centric
Data egress charges and compliance risks
Resource Efficiency
✅ <5% CPU, 150MB RAM
Most energy-efficient validated
⚠️ 10-30% CPU Overhead
Significant system impact
MTTR Impact
✅ 80% Reduction
Per-second visibility and AI-powered RCA
❌ Increasing
82% report MTTR over 1 hour in 2024
Storage Efficiency
✅ 0.6 Bytes per Sample
Years of retention in gigabytes
⚠️ 2-16 Bytes per Sample
Months of data in terabytes
Query Language
✅ None Required
Point-and-click NIDL framework
⚠️ PromQL/SQL Required
Weeks of training needed
Native Kubernetes monitoring with auto-discovery of pods, services, and deployments. Per-second visibility into containerized 5G core components, service mesh traffic, and API performance without instrumentation.
Zero-config K8s observability
Explore Kubernetes Monitoring
Essential features that transform telecom infrastructure monitoring
Per-second data collection with sub-2-second latency from event to insight. Catch anomalies traditional minute-based monitoring misses.
18 unsupervised models per metric train locally. Consensus-based detection without cloud dependency.
200+ device profiles for Cisco, Juniper, Huawei, Nokia, Arista. Auto-discovery with SNMPv1/v2c/v3 support across all vendors.
Auto-discovery of pods, services, deployments. Per-container resources, service mesh observability, and API performance monitoring.
60-second installation to full dashboards. Auto-discovers infrastructure, generates dashboards, and activates 400+ pre-configured alerts.
100% on-premises data storage. Zero metrics leave infrastructure. GDPR, HIPAA, PCI DSS compliance by design.
Per-node pricing with unlimited metrics and logs. No surprise bills from data volume spikes or metric cardinality.
Correlates anomalies across all metrics. Surfaces root cause in top 30-50 results. 80% MTTR reduction.
Browser-based access to processes, connections, logs, and systemd units. Same precision as SSH with history and ML.
September 26, 2023
Ensuring Quality of Service with Advanced Network Insights
May 20, 2022
Learn how to monitor Kubernetes workloads without direct cooperation from applications. Gain insights with zero-code changes. Read the full guide now!
May 3, 2022
Solve Kubernetes throttling issues with real-time monitoring and smarter resource management. Learn how to optimize performance—read the guide now!