The only agent that thinks for itself

Autonomous Monitoring with self-learning AI built-in, operating independently across your entire stack.

Unlimited Metrics & Logs
Machine learning & MCP
5% CPU, 150MB RAM
3GB disk, >1 year retention
800+ integrations, zero config
Dashboards, alerts out of the box
> Discover Netdata Agents

Centralized metrics streaming and storage

Aggregate metrics from multiple agents into centralized Parent nodes for unified monitoring across your infrastructure.

Stream from unlimited agents
Long-term data retention
High availability clustering
Data replication & backup
Scalable architecture
Enterprise-grade security
> Learn about Parents

Fully managed cloud platform

Access your monitoring data from anywhere with our SaaS platform. No infrastructure to manage, automatic updates, and global availability.

Zero infrastructure management
99.9% uptime SLA
Global data centers
Automatic updates & patches
Enterprise SSO & RBAC
SOC2 & ISO certified
> Explore Netdata Cloud

Deploy Netdata Cloud in your infrastructure

Run the full Netdata Cloud platform on-premises for complete data sovereignty and compliance with your security policies.

Complete data sovereignty
Air-gapped deployment
Custom compliance controls
Private network integration
Dedicated support team
Kubernetes & Docker support
> Learn about Cloud On-Premises

Powerful, intuitive monitoring interface

Modern, responsive UI built for real-time troubleshooting with customizable dashboards and advanced visualization capabilities.

Real-time chart updates
Customizable dashboards
Dark & light themes
Advanced filtering & search
Responsive on all devices
Collaboration features
> Explore Netdata UI

Monitor on the go

Native iOS and Android apps bring full monitoring capabilities to your mobile device with real-time alerts and notifications.

iOS & Android apps
Push notifications
Touch-optimized interface
Offline data access
Biometric authentication
Widget support
> Download apps

The future of infrastructure observability

See our strategic direction across AI-native observability, full-stack signals, operational intelligence, and enterprise platform maturity.

AI-native observability
Full-stack signal coverage
Operational intelligence
Enterprise platform maturity
Agent releases every 6 weeks
Cloud continuous delivery
> Explore Product Roadmap

Best energy efficiency

True real-time per-second

100% automated zero config

Centralized observability

Multi-year retention

High availability built-in

Zero maintenance

Always up-to-date

Enterprise security

Complete data control

Air-gap ready

Compliance certified

Millisecond responsiveness

Infinite zoom & pan

Works on any device

Native performance

Instant alerts

Monitor anywhere

AI-native observability

Continuous delivery

Open source foundation

80% Faster Incident Resolution

AI-powered troubleshooting from detection, to root cause and blast radius identification, to reporting.

True Real-Time and Simple, even at Scale

Linearly and infinitely scalable full-stack observability, that can be deployed even mid-crisis.

90% Cost Reduction, Full Fidelity

Instead of centralizing the data, Netdata distributes the code, eliminating pipelines and complexity.

Control Without Surrender

SOC 2 Type 2 certified with every metric kept on your infrastructure.

Integrations

800+ collectors and notification channels, auto-discovered and ready out of the box.

800+ data collectors
Auto-discovery & zero config
Cloud, infra, app protocols
Notifications out of the box
> Explore integrations
Real Results
46% Cost Reduction

Reduced monitoring costs by 46% while cutting staff overhead by 67%.

— Leonardo Antunez, Codyas

Zero Pipeline

No data shipping. No central storage costs. Query at the edge.

From Our Users
"Out-of-the-Box"

So many out-of-the-box features! I mostly don't have to develop anything.

— Simon Beginn, LANCOM Systems

No Query Language

Point-and-click troubleshooting. No PromQL, no LogQL, no learning curve.

Enterprise Ready
67% Less Staff, 46% Cost Cut

Enterprise efficiency without enterprise complexity—real ROI from day one.

— Leonardo Antunez, Codyas

SOC 2 Type 2 Certified

Zero data egress. Only metadata reaches the cloud. Your metrics stay on your infrastructure.

Full Coverage
800+ Collectors

Auto-discovered and configured. No manual setup required.

Any Notification Channel

Slack, PagerDuty, Teams, email, webhooks—all built-in.

Built for the People Who Get Paged

Because 3am alerts deserve instant answers, not hour-long hunts.

Every Industry Has Rules. We Master Them.

See how healthcare, finance, and government teams cut monitoring costs 90% while staying audit-ready.

Monitor Any Technology. Configure Nothing.

Install the agent. It already knows your stack.
From Our Users
"A Rare Unicorn"

Netdata gives more than you invest in it. A rare unicorn that obeys the Pareto rule.

— Eduard Porquet Mateu, TMB Barcelona

99% Downtime Reduction

Reduced website downtime by 99% and cloud bill by 30% using Netdata alerts.

— Falkland Islands Government

Real Savings
30% Cloud Cost Reduction

Optimized resource allocation based on Netdata alerts cut cloud spending by 30%.

— Falkland Islands Government

46% Cost Cut

Reduced monitoring staff by 67% while cutting operational costs by 46%.

— Codyas

Real Coverage
"Plugin for Everything"

Netdata has agent capacity or a plugin for everything, including Windows and Kubernetes.

— Eduard Porquet Mateu, TMB Barcelona

"Out-of-the-Box"

So many out-of-the-box features! I mostly don't have to develop anything.

— Simon Beginn, LANCOM Systems

Real Speed
Troubleshooting in 30 Seconds

From 2-3 minutes to 30 seconds—instant visibility into any node issue.

— Matthew Artist, Nodecraft

20% Downtime Reduction

20% less downtime and 40% budget optimization from out-of-the-box monitoring.

— Simon Beginn, LANCOM Systems

Pay per Node. Unlimited Everything Else.

One price per node. Unlimited metrics, logs, users, and retention. No per-GB surprises.

Free tier—forever
No metric limits or caps
Retention you control
Cancel anytime
> See pricing plans

What's Your Monitoring Really Costing You?

Most teams overpay by 40-60%. Let's find out why.

Expose hidden metric charges
Calculate tool consolidation
Customers report 30-67% savings
Results in under 60 seconds
> See what you're really paying

Your Infrastructure Is Unique. Let's Talk.

Because monitoring 10 nodes is different from monitoring 10,000.

On-prem & air-gapped deployment
Volume pricing & agreements
Architecture review for your scale
Compliance & security support
> Start a conversation

Monitoring That Sells Itself

Deploy in minutes. Impress clients in hours. Earn recurring revenue for years.

30-second live demos close deals
Zero config = zero support burden
Competitive margins & deal protection
Response in 48 hours
> Apply to partner

Per-Second Metrics at Homelab Prices

Same engine, same dashboards, same ML. Just priced for tinkerers.

Community: Free forever · 5 nodes · non-commercial
Homelab: $90/yr · unlimited nodes · fair usage
> Get the Homelab Plan

$1,000 Per Referral. Unlimited Referrals.

Your colleagues get 10% off. You get 10% commission. Everyone wins.

10% of subscriptions, up to $1,000 each
Track earnings inside Netdata Cloud
PayPal/Venmo payouts in 3-4 weeks
No caps, no complexity
> Get your referral link
Cost Proof
40% Budget Optimization

"Netdata's significant positive impact" — LANCOM Systems

Calculate Your Savings

Compare vs Datadog, Grafana, Dynatrace

Savings Proof
46% Cost Reduction

"Cut costs by 46%, staff by 67%" — Codyas

30% Cloud Bill Savings

"Reduced cloud bill by 30%" — Falkland Islands Gov

Enterprise Proof
"Better Than Combined Alternatives"

"Better observability with Netdata than combining other tools." — TMB Barcelona

Real Engineers, <24h Response

DPA, SLAs, on-prem, volume pricing

Why Partners Win
Demo Live Infrastructure

One command, 30 seconds, real data—no sandbox needed

Zero Tickets, High Margins

Auto-config + per-node pricing = predictable profit

Homelab Ready
Free Video Course

8-episode Netdata tutorial by LearnLinux.tv

76k+ GitHub Stars

3rd most starred monitoring project

Worth Recommending
Product That Delivers

Customers report 40-67% cost cuts, 99% downtime reduction

Zero Risk to Your Rep

Free tier lets them try before they buy

AI Support Assistant, Available 24/7

Nedi has access to all official documentation, source code, and resources. Ask any question about Netdata—responds in your language.

Deployment & configuration
Troubleshooting & sizing
Alerts & notifications
Evidence-based answers
> Ask Nedi now

Never Fight Fires Alone

Docs, community, and expert help—pick your path to resolution.

Learn.netdata.cloud docs
Discord, Forums, GitHub
Premium support available
> Get answers now

60 Seconds to First Dashboard

One command to install. Zero config. 850+ integrations documented.

Linux, Windows, K8s, Docker
Auto-discovers your stack
> Read our documentation

Level Up Your Monitoring

Real problems. Real solutions. 112+ guides from basic monitoring to AI observability.

76,000+ Engineers Strong

615+ contributors. 1.5M daily downloads. One mission: simplify observability.

Per-Second. 90% Cheaper. Data Stays Home.

Side-by-side comparisons: costs, real-time granularity, and data sovereignty for every major tool.

See why teams switch from Datadog, Prometheus, Grafana, and more.

> Browse all comparisons
Edge-Native Observability, Born Open Source
Per-second visibility, ML on every metric, and data that never leaves your infrastructure.
Founded in 2016
615+ contributors worldwide
Remote-first, engineering-driven
Open source first
> Read our story
Promises We Publish—and Prove
12 principles backed by open code, independent validation, and measurable outcomes.
Open source, peer-reviewed
Zero config, instant value
Data sovereignty by design
Aligned pricing, no surprises
> See all 12 principles
Edge-Native, AI-Ready, 100% Open
76k+ stars. Full ML, AI, and automation—GPLv3+, not premium add-ons.
76,000+ GitHub stars
GPLv3+ licensed forever
ML on every metric, included
Zero vendor lock-in
> Explore our open source
Build Real-Time Observability for the World
Remote-first team shipping per-second monitoring with ML on every metric.
Remote-first, fully distributed
Open source (76k+ stars)
Challenging technical problems
Your code on millions of systems
> See open roles
Meet the Team Behind Netdata
Conferences, meetups, and tradeshows where you can see Netdata in action and talk to the engineers who build it.
Live demos and deep dives
Book 1-on-1 meetings
Talks and panel sessions
Event recaps and photos
> See all events
Talk to a Netdata Human in <24 Hours
Sales, partnerships, press, or professional services—real engineers, fast answers.
Discuss your observability needs
Pricing and volume discounts
Partnership opportunities
Media and press inquiries
> Book a conversation
Your Data. Your Rules.
On-prem data, cloud control plane, transparent terms.
Trust & Scale
76,000+ GitHub Stars

One of the most popular open-source monitoring projects

SOC 2 Type 2 Certified

Enterprise-grade security and compliance

Data Sovereignty

Your metrics stay on your infrastructure

Validated
University of Amsterdam

"Most energy-efficient monitoring solution" — ICSOC 2023, peer-reviewed

ADASTEC (Autonomous Driving)

"Doesn't miss alerts—mission-critical trust for safety software"

Community Stats
615+ Contributors

Global community improving monitoring for everyone

1.5M+ Downloads/Day

Trusted by teams worldwide

GPLv3+ Licensed

Free forever, fully open source agent

Why Join?
Remote-First

Work from anywhere, async-friendly culture

Impact at Scale

Your work helps millions of systems

Azure to Azure Local Migration

One Monitoring Platform for Both Sides of Your Migration

Moving workloads from Azure to Azure Local (formerly Azure Stack HCI)? Netdata gives you unified per-second visibility into your Azure cloud resources and your on-prem Azure Local infrastructure from a single dashboard — before, during, and after migration. No stitching tools together. No blind spots during cutover.

Background Hero

Why Migration Teams Choose Netdata

A single platform that covers Azure cloud services and on-prem Azure Local infrastructure with the same depth and the same timeline.

Azure Monitor Collector

Connects to the Azure Monitor Metrics API and automatically discovers your resources. VMs, SQL databases, load balancers, AKS clusters, storage accounts, and 30+ other Azure services covered out of the box. Multi-subscription support included.

Azure Local Coverage

Lightweight agents on cluster nodes collect OS metrics at per-second granularity, Hyper-V VM performance, Storage Spaces Direct health and capacity, and applications running on guest workloads — under 1% CPU overhead.

Single Pane of Glass

Both environments appear in Netdata Cloud together. Build custom dashboards that show source and destination side by side, with the same alerting and correlation tools across cloud and on-prem.

Anomaly Detection on Day One

Every metric on both sides gets ML-based anomaly detection automatically. Especially useful in the post-migration period when normal baselines are still being established on the new hardware.

800+ Application Collectors

Whatever services you’re migrating from Azure — SQL Server, IIS, Active Directory, containers, custom apps — Netdata likely already has a collector. Monitoring coverage carries over from cloud to on-prem.

No Per-Metric Pricing

Azure Local generates a lot of metrics across cluster nodes, VMs, storage, and applications. Predictable per-node pricing means you monitor everything without cost anxiety as you scale workloads onto the new platform.

Trusted by teams running hybrid Azure infrastructure

Deployment Architecture on Azure Local

How Netdata is deployed

Two agents per node: host and guest, no special access required

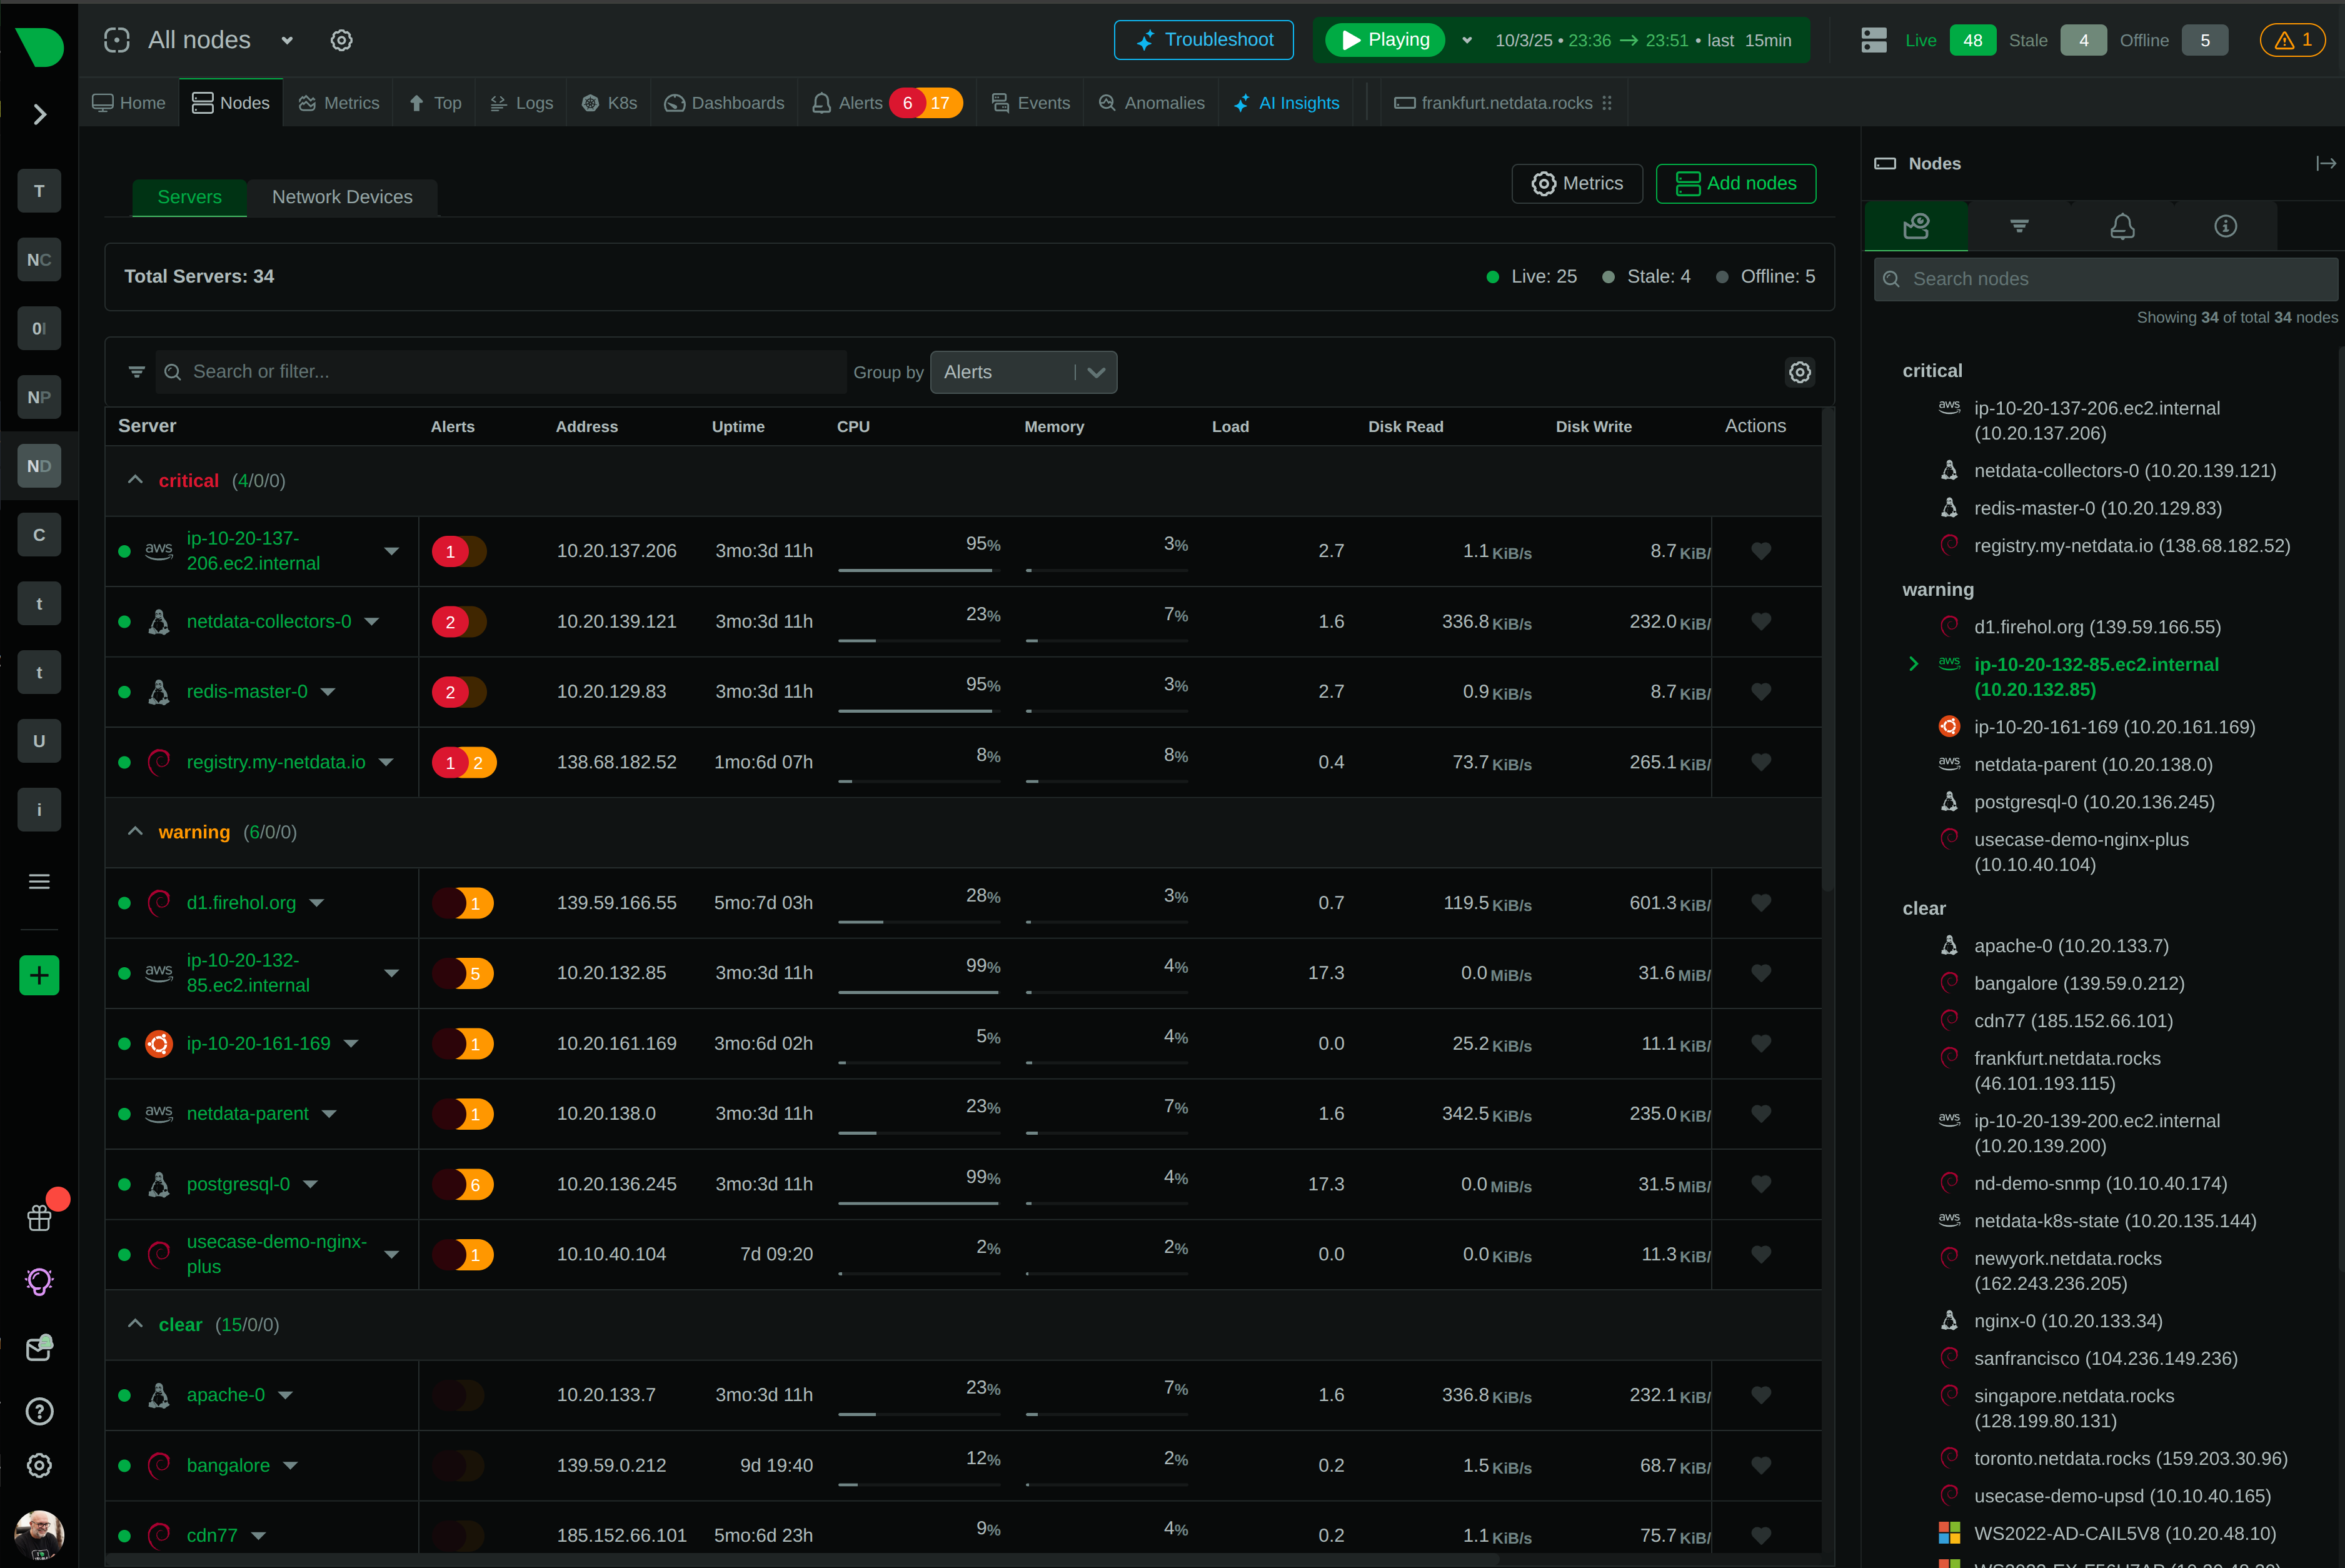
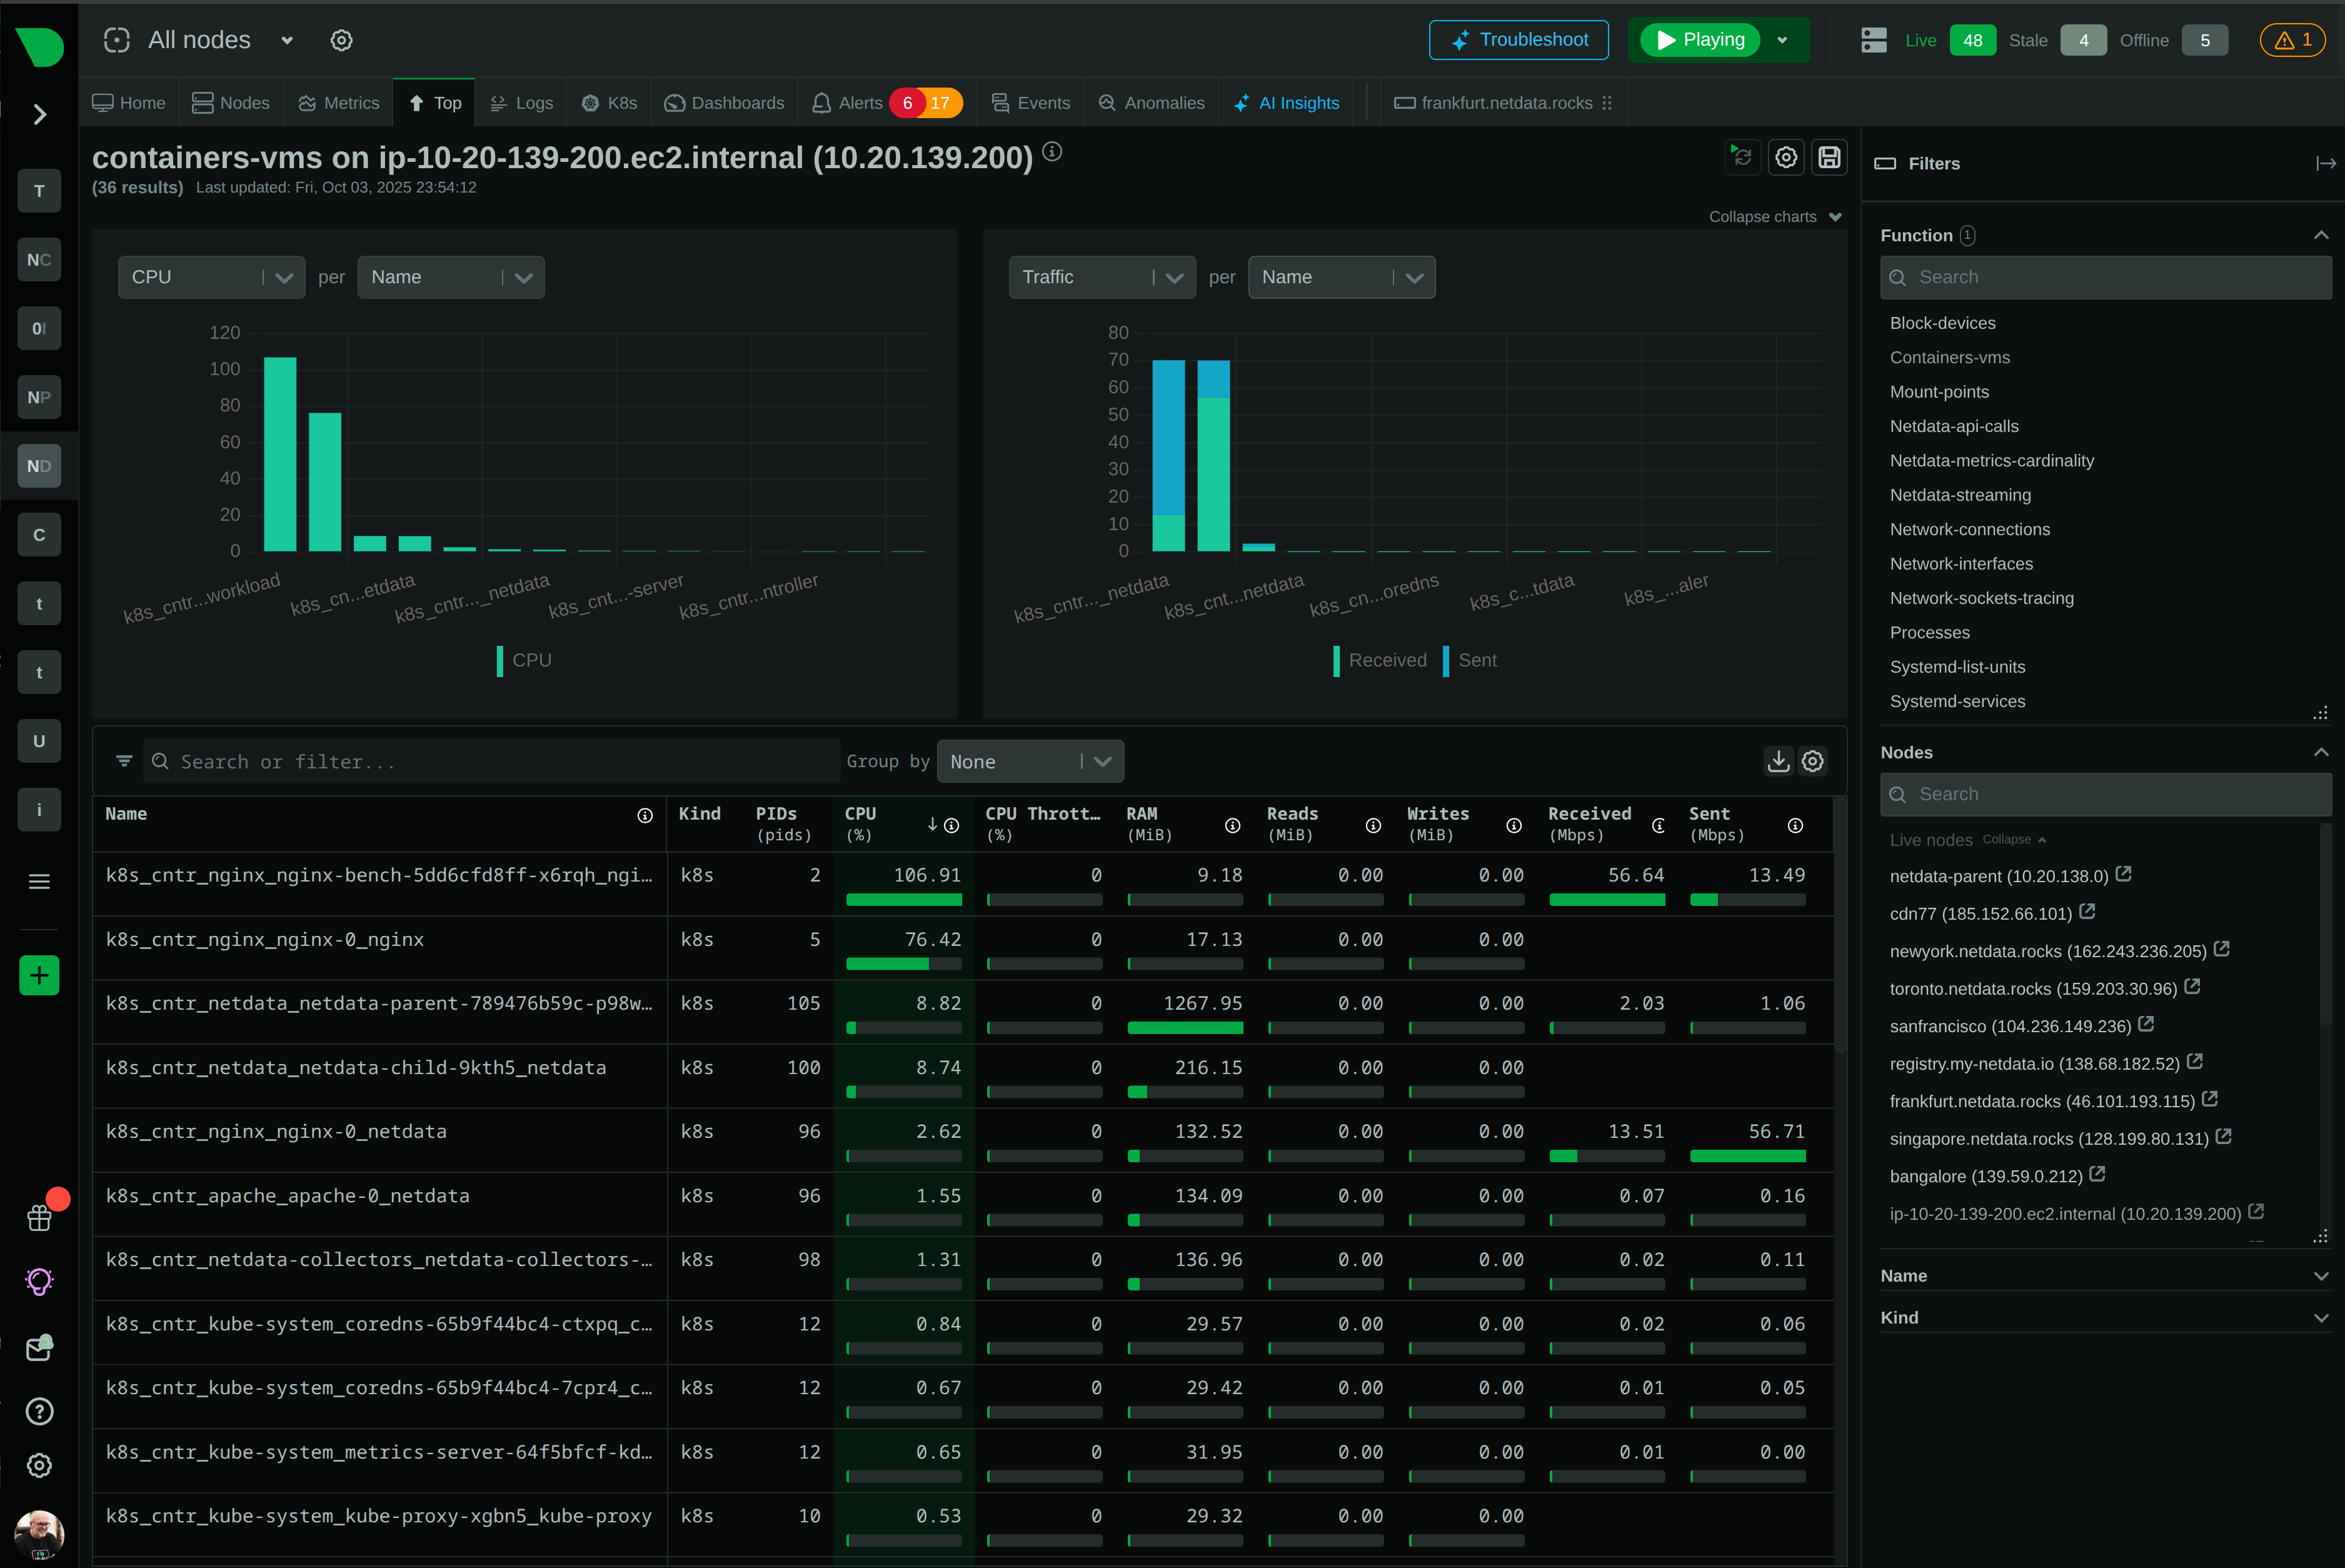
A Netdata Agent is installed on every Azure Local host (Windows Server with Hyper-V role) to collect physical CPU, RAM, and disk I/O, Hyper-V role metrics, physical network adapters, and hardware sensors and events. A second Netdata Agent is installed inside each Azure Local VM to collect guest OS metrics, logs, and application-level metrics through Netdata’s 800+ collectors. The result is complete visibility from the hardware up through every guest workload.

No special access needed. You don’t need to open up any management interface, create dedicated users, or grant domain roles to monitor any of this. The agents run locally on each system and report through Netdata Cloud (or to an optional Parent for centralized storage and aggregation).

Host metrics + VM metrics + apps — from one platform

Try Netdata on Azure Local

Deployment architecture diagram showing Netdata Agents on Azure Local hosts and on each VM, with an optional Parent for central storage

Coverage Through Every Phase of Migration

Before Migration — Baseline and Validate

Before you move a single workload, capture performance baselines on the Azure side: how much CPU and memory each workload consumes, its I/O patterns, its network throughput. These become your post-migration success criteria. On the Azure Local side, validate that the new cluster is healthy before it takes production load — hardware status, Storage Spaces Direct pool state, network configuration, and synthetic-load behavior. Anomaly detection runs from day one, surfacing pre-existing issues on either side before migration adds complexity.

Per-second baselines

See live demo

Before Migration — Baseline and Validate

During Migration — Parallel Visibility

This is where unified monitoring matters most. As workloads migrate in waves, you watch both source (so remaining workloads aren’t impacted) and destination (so migrated workloads perform correctly). Netdata lets you put the same workload on Azure and on Azure Local side by side: SQL throughput, response times, disk I/O. Because both data sources are on the same timeline with the same alerting, comparisons are direct. If cutover misbehaves, you have the data to decide quickly — roll back or push forward.

Same timeline, both sides

Read the blog

During Migration — Parallel Visibility

After Migration — Ongoing Operations

Once migration completes, your Netdata deployment becomes your ongoing monitoring solution for the Azure Local environment. The agents are already installed. The dashboards are already built. The alerts are already configured. For workloads that remain in Azure (or for fully hybrid architectures), the Azure Monitor collector keeps running alongside Azure Local monitoring. You don’t set up a new monitoring stack — the migration tool is the production tool.

Zero re-deployment

Hybrid cloud monitoring

After Migration — Ongoing Operations

The Migration Monitoring Choice

Netdata vs Azure Monitor + a Separate On-Prem Tool

Most teams default to Azure Monitor for the cloud side and a separate tool (or nothing) for the on-prem side. That split is exactly what hurts during migration. Here is what changes when both sides land in one platform.

Capability

Netdata (unified)

Azure Monitor + Separate On-Prem Tool

Source + destination on one timeline

✅ Single dashboard for Azure resources and Azure Local nodes
Direct side-by-side comparison during cutover

❌ Console switching between products
Manual timeline alignment, mental bridges across tools

Granularity for cutover windows

✅ Per-second metrics on both sides
Catch issues during minutes-long cutovers

⚠️ Per-minute Azure Monitor + variable on-prem
Cutover problems hidden in averages

Hyper-V and Storage Spaces Direct

✅ Native collectors for both
Per-VM resource and per-pool S2D health out of the box

⚠️ Depends on second tool’s coverage
Often shallow on cluster internals

Application monitoring carry-over

✅ 800+ collectors that run on both
Same monitoring for SQL Server, IIS, AD, containers — Azure or on-prem

⚠️ Two separate setups
Rebuilding app-level checks on the on-prem side

Anomaly detection on new hardware

✅ ML on every metric, automatic
Surfaces issues even before you know normal looks like

❌ Threshold-only on the on-prem side
No baseline = no signal during stabilization

Cost model for Azure Local volume

✅ Predictable per-node
No per-metric tax on cluster-heavy environments

❌ Volume-based ingest fees
Azure Monitor metric ingestion adds up across nodes/VMs

Agent overhead on cluster nodes

✅ <1% CPU per node
Doesn’t compete with workloads on right-sized hardware

⚠️ Heavier agents common
Especially when adding APM on top

Migration → steady state

✅ Same setup transitions automatically
Dashboards and alerts persist after cutover

⚠️ Tooling reshuffles post-migration
Second project to consolidate on-prem stack

See full feature comparison →

What Gets Monitored on Azure Local

Per-Second Coverage of Every Cluster Node

CPU per core, memory usage and pressure, disk I/O and latency per device, network throughput and errors per interface, filesystem usage — hundreds of OS metrics at per-second granularity across every Azure Local cluster node. The foundation you need to know your new infrastructure is healthy before, during, and after workloads arrive.

The same depth you had in the cloud, on the hardware you now own

Linux monitoring
Host OS Dashboard

Why This Combination Works for Migration

Six capabilities that make Netdata fit the shape of an Azure → Azure Local migration.

Frequently Asked Questions