See Every Second of Your Cloud Infrastructure
Real-time visibility across AWS, Azure, GCP, and hybrid environments with per-second metrics, ML-powered anomaly detection, and 90% cost savings. Zero configuration. Complete data sovereignty.


Real-time visibility across AWS, Azure, GCP, and hybrid environments with per-second metrics, ML-powered anomaly detection, and 90% cost savings. Zero configuration. Complete data sovereignty.
The only monitoring platform built for distributed cloud infrastructure from day one
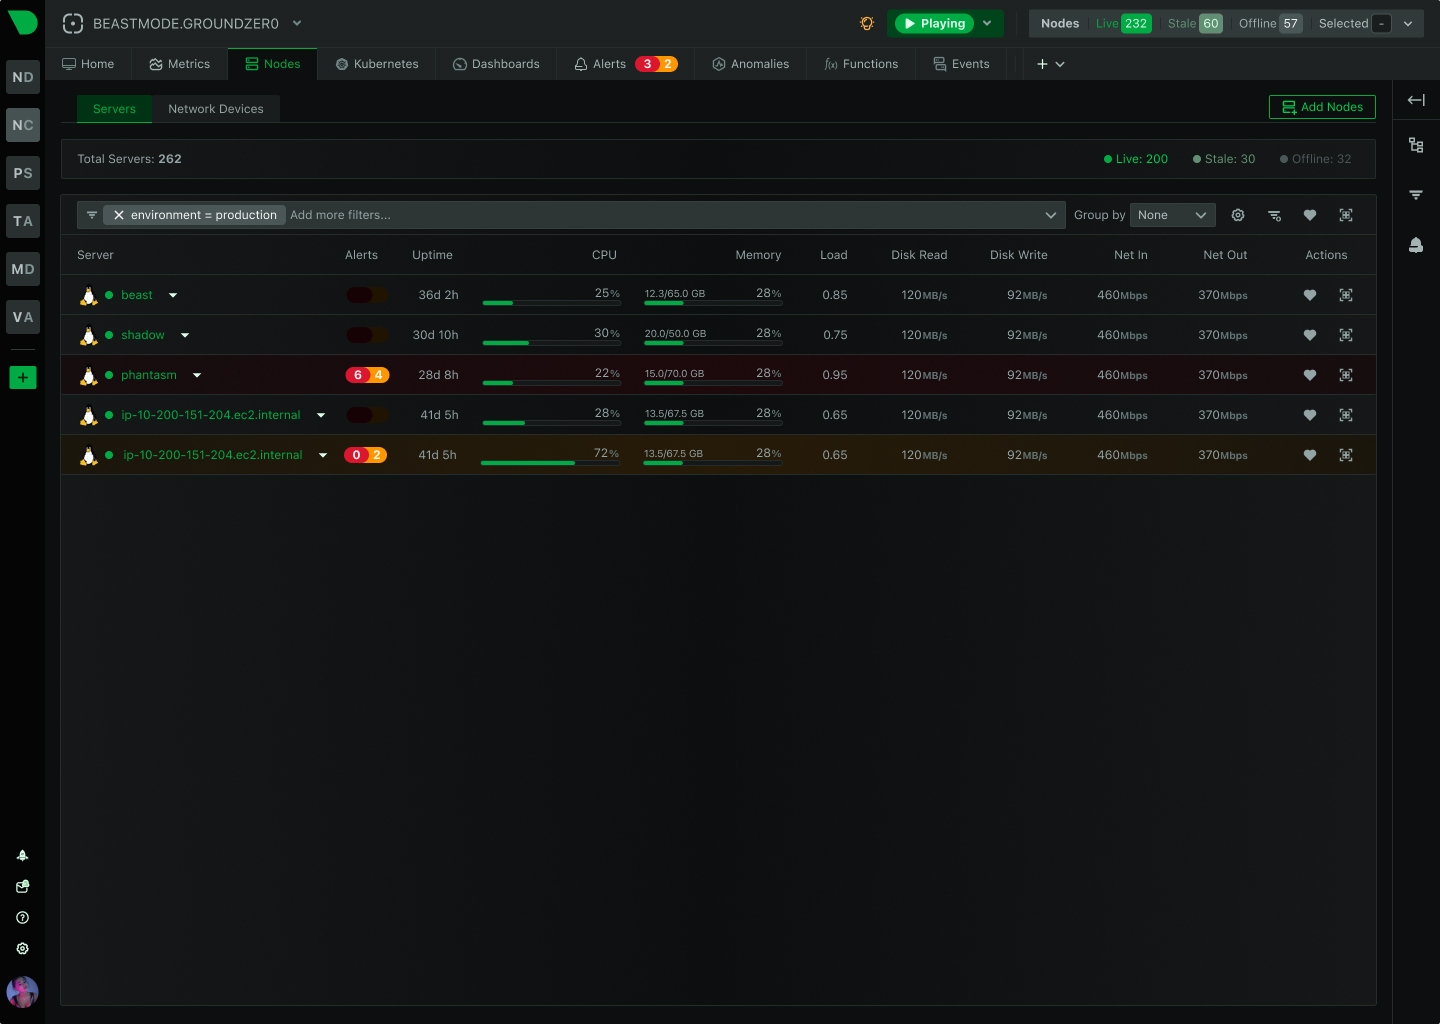
Per-second metrics across all cloud resources with sub-2-second latency. Catch microbursts and transient issues invisible to minute-averaged monitoring.
Predictable per-node pricing with zero data volume charges. No surprise bills from traffic spikes or metric explosions. Unlimited metrics, logs, and users included.
ML detects anomalies on every metric automatically. AI Co-Engineer explains issues in plain language and surfaces root causes in seconds, not hours.
One-line install with automatic discovery of all cloud resources. Pre-configured dashboards and 400+ alerts work instantly. Zero configuration required.
All metrics and logs stay on your infrastructure. SOC 2 Type 2 certified with GDPR, HIPAA, and PCI DSS compliance built-in. No vendor lock-in.
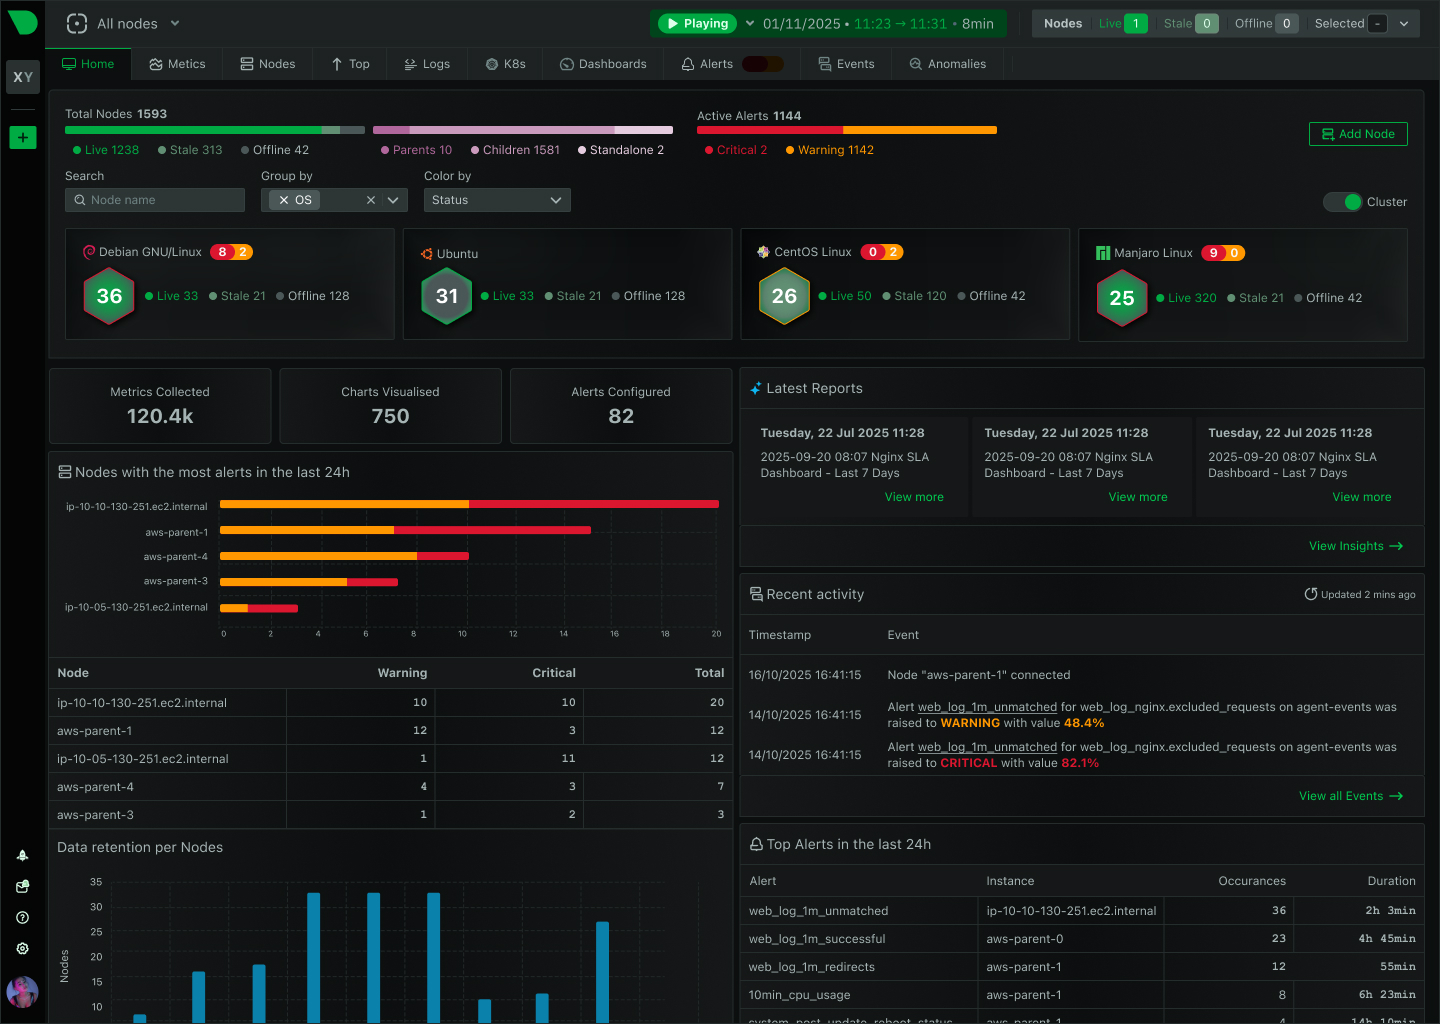
Single dashboard for AWS, Azure, GCP, and on-premises. Automatic correlation across cloud boundaries. No context switching between provider consoles.
Trusted by cloud-native teams worldwide
80% faster MTTR
Learn about AI troubleshooting

Predictable per node
See pricing calculator
Zero SSH required
Explore Netdata Functions

Unlimited scalability
Understand the architecture

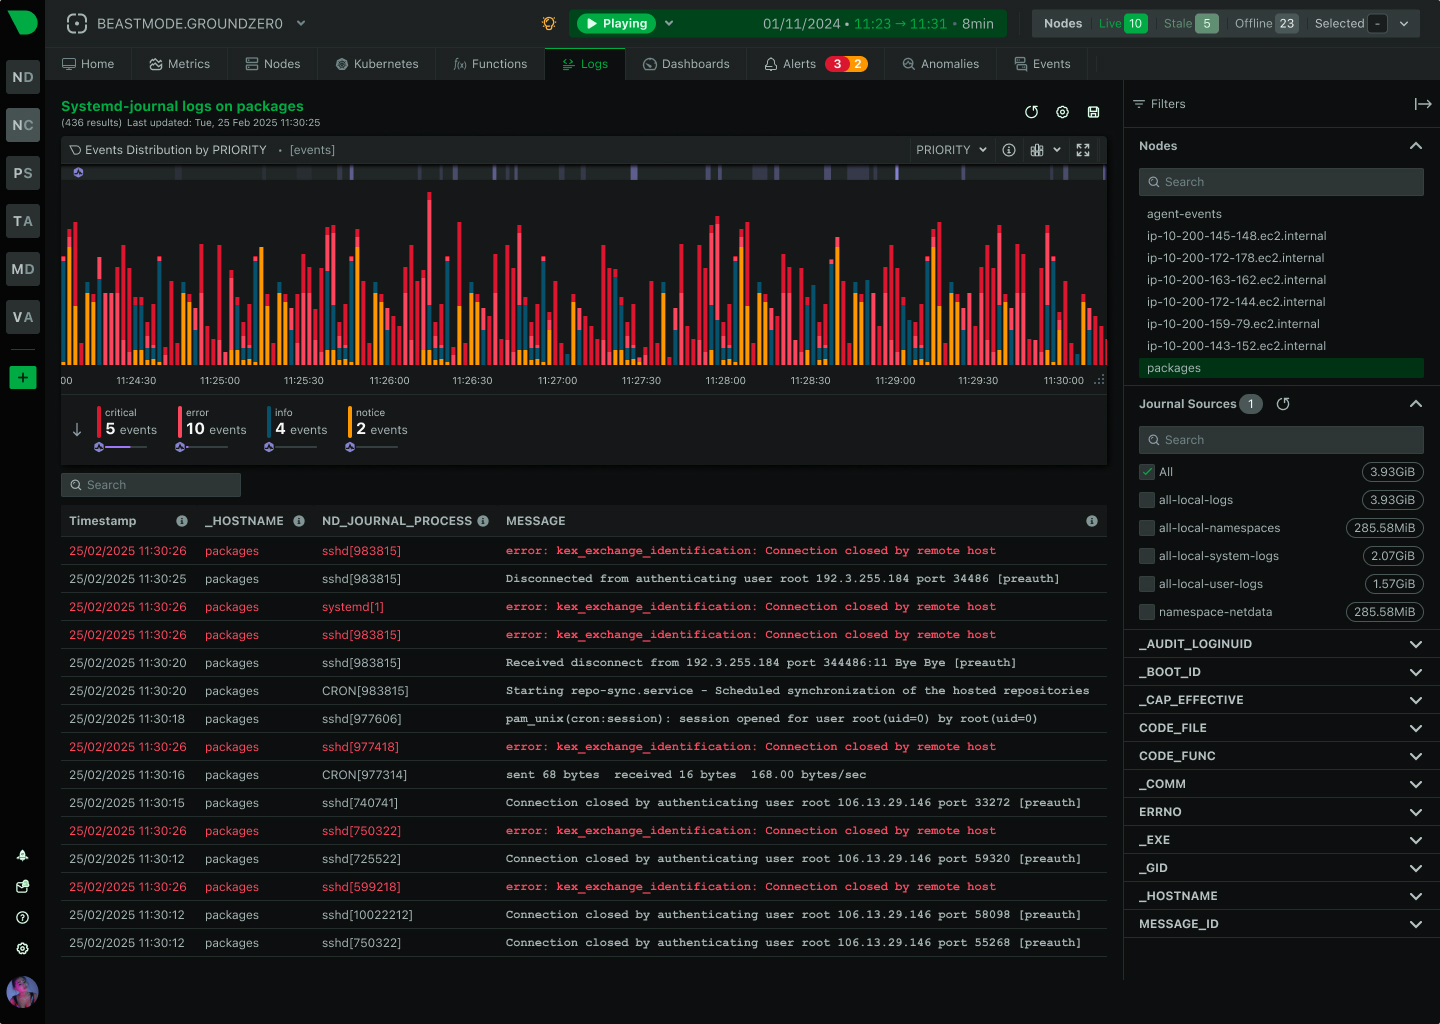
90% log cost savings
Discover zero-pipeline logs
Instant K8s visibility
Deploy on Kubernetes


How Netdata Compares
See why cloud teams choose Netdata over traditional monitoring platforms. Real-time visibility, predictable costs, and zero configuration - without sacrificing capabilities.
Capability
Netdata
Traditional Monitoring
Data Granularity
✅ Per-Second
Catch every anomaly and transient issue
⚠️ Per-Minute
Misses 90% of short-lived problems
Time to Value
✅ 60 Seconds
One-line install, instant dashboards
⚠️ Weeks to Months
Complex setup, manual configuration
Pricing Model
✅ Flat Per-Node
Predictable costs, unlimited metrics/logs/users
⚠️ Variable Pricing
Data volume, user, container charges
Cost Predictability
✅ P90 Billing
Excludes spikes and peak days
⚠️ Peak Usage Billing
Single spike can increase monthly bill
ML Anomaly Detection
✅ Included on All Metrics
18 models per metric, zero config
⚠️ Optional Add-On
Requires manual tuning, extra cost
Data Sovereignty
✅ 100% On-Premises
All metrics and logs stay local
⚠️ Cloud-Dependent
Data egress required for analysis
Query Language
✅ None Required
Point-and-click NIDL framework
⚠️ PromQL/SQL Required
Steep learning curve, expert-dependent
Dashboard Creation
✅ Automatic
Algorithmic generation, zero config
⚠️ Manual
Hours to build, constant maintenance
Alert Configuration
✅ 400+ Pre-Configured
Intelligent thresholds, works instantly
⚠️ Build From Scratch
Manual threshold tuning required
Log Management
✅ Zero Pipeline
Direct journal access, 90% cost savings
⚠️ Complex Pipeline
Shipping, indexing, storage multiplication
Multi-Cloud Support
✅ Unified View
AWS, Azure, GCP in one dashboard
⚠️ Separate Consoles
Context switching between providers
Scalability Model
✅ Linear
10 to 100,000 nodes, same performance
⚠️ Exponential Complexity
Requires architectural rewrites at scale
Auto-discover EC2, ECS, EKS, Lambda, RDS, and 50+ AWS services. Per-second CloudWatch metrics without the CloudWatch bill. Monitor VPCs, load balancers, and S3 buckets with zero configuration.
Deploy in 60 seconds
AWS Monitoring GuideComprehensive monitoring capabilities built for modern cloud infrastructure
Per-second collection across 800+ integrations. CPU, memory, disk, network, and application metrics with sub-2-second latency.
Direct systemd-journal and Windows Event Log access. Query 1M entries before sampling. 90% cost reduction compared to traditional log management.
18 models per metric detect patterns automatically. 99% false positive reduction through consensus. Zero configuration required.
400+ pre-configured alerts with dynamic thresholds. Edge evaluation with local automation. 37 notification integrations.
Correlates thousands of metrics automatically. Surfaces root cause in top 30-50 results. Reveals cascading failures and blast radius.
Natural language troubleshooting. AI Insights reports in 2-3 minutes. Model Context Protocol for IDE integration.
Docker, Podman, LXC, containerd support. Per-container metrics with zero overhead. Automatic discovery and lifecycle tracking.
Interface metrics, SNMP devices, QoS monitoring. Live connection tracking. Network flow analysis.
15+ database collectors. Query performance, connection pools, slow queries. MySQL, PostgreSQL, MongoDB, Redis, and more.
AWS, Azure, GCP in one dashboard. Automatic cloud resource discovery. Native integration with cloud provider APIs.
SOC 2 Type 2 certified. GDPR, HIPAA, PCI DSS support. 100% data sovereignty. RBAC, SSO, MFA included.
Lightweight agents for IoT and edge devices. <100MB RAM on 32-bit systems. Works offline with automatic sync.
May 16, 2023
Discover the challenges & best practices for monitoring multi-cloud & hybrid-cloud environments. Achieve real-time insights & optimal performance with Netdata.

May 14, 2023
Discover smart cloud optimization strategies to cut costs, boost performance, and resource utilization. Monitor everything in real time with Netdata.
May 14, 2023
Strategies and Tools for a Smooth Transition to the Cloud