The only agent that thinks for itself

Autonomous Monitoring with self-learning AI built-in, operating independently across your entire stack.

Unlimited Metrics & Logs
Machine learning & MCP
5% CPU, 150MB RAM
3GB disk, >1 year retention
800+ integrations, zero config
Dashboards, alerts out of the box
> Discover Netdata Agents
Centralized metrics streaming and storage

Aggregate metrics from multiple agents into centralized Parent nodes for unified monitoring across your infrastructure.

Stream from unlimited agents
Long-term data retention
High availability clustering
Data replication & backup
Scalable architecture
Enterprise-grade security
> Learn about Parents
Fully managed cloud platform

Access your monitoring data from anywhere with our SaaS platform. No infrastructure to manage, automatic updates, and global availability.

Zero infrastructure management
99.9% uptime SLA
Global data centers
Automatic updates & patches
Enterprise SSO & RBAC
SOC2 & ISO certified
> Explore Netdata Cloud
Deploy Netdata Cloud in your infrastructure

Run the full Netdata Cloud platform on-premises for complete data sovereignty and compliance with your security policies.

Complete data sovereignty
Air-gapped deployment
Custom compliance controls
Private network integration
Dedicated support team
Kubernetes & Docker support
> Learn about Cloud On-Premises
Powerful, intuitive monitoring interface

Modern, responsive UI built for real-time troubleshooting with customizable dashboards and advanced visualization capabilities.

Real-time chart updates
Customizable dashboards
Dark & light themes
Advanced filtering & search
Responsive on all devices
Collaboration features
> Explore Netdata UI
Monitor on the go

Native iOS and Android apps bring full monitoring capabilities to your mobile device with real-time alerts and notifications.

iOS & Android apps
Push notifications
Touch-optimized interface
Offline data access
Biometric authentication
Widget support
> Download apps

Best energy efficiency

True real-time per-second

100% automated zero config

Centralized observability

Multi-year retention

High availability built-in

Zero maintenance

Always up-to-date

Enterprise security

Complete data control

Air-gap ready

Compliance certified

Millisecond responsiveness

Infinite zoom & pan

Works on any device

Native performance

Instant alerts

Monitor anywhere

80% Faster Incident Resolution
AI-powered troubleshooting from detection, to root cause and blast radius identification, to reporting.
True Real-Time and Simple, even at Scale
Linearly and infinitely scalable full-stack observability, that can be deployed even mid-crisis.
90% Cost Reduction, Full Fidelity
Instead of centralizing the data, Netdata distributes the code, eliminating pipelines and complexity.
Control Without Surrender
SOC 2 Type 2 certified with every metric kept on your infrastructure.
Integrations

800+ collectors and notification channels, auto-discovered and ready out of the box.

800+ data collectors
Auto-discovery & zero config
Cloud, infra, app protocols
Notifications out of the box
> Explore integrations
Real Results
46% Cost Reduction

Reduced monitoring costs by 46% while cutting staff overhead by 67%.

— Leonardo Antunez, Codyas

Zero Pipeline

No data shipping. No central storage costs. Query at the edge.

From Our Users
"Out-of-the-Box"

So many out-of-the-box features! I mostly don't have to develop anything.

— Simon Beginn, LANCOM Systems

No Query Language

Point-and-click troubleshooting. No PromQL, no LogQL, no learning curve.

Enterprise Ready
67% Less Staff, 46% Cost Cut

Enterprise efficiency without enterprise complexity—real ROI from day one.

— Leonardo Antunez, Codyas

SOC 2 Type 2 Certified

Zero data egress. Only metadata reaches the cloud. Your metrics stay on your infrastructure.

Full Coverage
800+ Collectors

Auto-discovered and configured. No manual setup required.

Any Notification Channel

Slack, PagerDuty, Teams, email, webhooks—all built-in.

From Our Users
"A Rare Unicorn"

Netdata gives more than you invest in it. A rare unicorn that obeys the Pareto rule.

— Eduard Porquet Mateu, TMB Barcelona

99% Downtime Reduction

Reduced website downtime by 99% and cloud bill by 30% using Netdata alerts.

— Falkland Islands Government

Real Savings
30% Cloud Cost Reduction

Optimized resource allocation based on Netdata alerts cut cloud spending by 30%.

— Falkland Islands Government

46% Cost Cut

Reduced monitoring staff by 67% while cutting operational costs by 46%.

— Codyas

Real Coverage
"Plugin for Everything"

Netdata has agent capacity or a plugin for everything, including Windows and Kubernetes.

— Eduard Porquet Mateu, TMB Barcelona

"Out-of-the-Box"

So many out-of-the-box features! I mostly don't have to develop anything.

— Simon Beginn, LANCOM Systems

Real Speed
Troubleshooting in 30 Seconds

From 2-3 minutes to 30 seconds—instant visibility into any node issue.

— Matthew Artist, Nodecraft

20% Downtime Reduction

20% less downtime and 40% budget optimization from out-of-the-box monitoring.

— Simon Beginn, LANCOM Systems

Pay per Node. Unlimited Everything Else.

One price per node. Unlimited metrics, logs, users, and retention. No per-GB surprises.

Free tier—forever
No metric limits or caps
Retention you control
Cancel anytime
> See pricing plans
What's Your Monitoring Really Costing You?

Most teams overpay by 40-60%. Let's find out why.

Expose hidden metric charges
Calculate tool consolidation
Customers report 30-67% savings
Results in under 60 seconds
> See what you're really paying
Your Infrastructure Is Unique. Let's Talk.

Because monitoring 10 nodes is different from monitoring 10,000.

On-prem & air-gapped deployment
Volume pricing & agreements
Architecture review for your scale
Compliance & security support
> Start a conversation
Monitoring That Sells Itself

Deploy in minutes. Impress clients in hours. Earn recurring revenue for years.

30-second live demos close deals
Zero config = zero support burden
Competitive margins & deal protection
Response in 48 hours
> Apply to partner
Per-Second Metrics at Homelab Prices

Same engine, same dashboards, same ML. Just priced for tinkerers.

Community: Free forever · 5 nodes · non-commercial
Homelab: $90/yr · unlimited nodes · fair usage
> Start monitoring your lab—free
$1,000 Per Referral. Unlimited Referrals.

Your colleagues get 10% off. You get 10% commission. Everyone wins.

10% of subscriptions, up to $1,000 each
Track earnings inside Netdata Cloud
PayPal/Venmo payouts in 3-4 weeks
No caps, no complexity
> Get your referral link
Cost Proof
40% Budget Optimization

"Netdata's significant positive impact" — LANCOM Systems

Calculate Your Savings

Compare vs Datadog, Grafana, Dynatrace

Savings Proof
46% Cost Reduction

"Cut costs by 46%, staff by 67%" — Codyas

30% Cloud Bill Savings

"Reduced cloud bill by 30%" — Falkland Islands Gov

Enterprise Proof
"Better Than Combined Alternatives"

"Better observability with Netdata than combining other tools." — TMB Barcelona

Real Engineers, <24h Response

DPA, SLAs, on-prem, volume pricing

Why Partners Win
Demo Live Infrastructure

One command, 30 seconds, real data—no sandbox needed

Zero Tickets, High Margins

Auto-config + per-node pricing = predictable profit

Homelab Ready
"Absolutely Incredible"

"We tested every monitoring system under the sun." — Benjamin Gabler, CEO Rocket.Net

76k+ GitHub Stars

3rd most starred monitoring project

Worth Recommending
Product That Delivers

Customers report 40-67% cost cuts, 99% downtime reduction

Zero Risk to Your Rep

Free tier lets them try before they buy

Never Fight Fires Alone

Docs, community, and expert help—pick your path to resolution.

Learn.netdata.cloud docs
Discord, Forums, GitHub
Premium support available
> Get answers now
60 Seconds to First Dashboard

One command to install. Zero config. 850+ integrations documented.

Linux, Windows, K8s, Docker
Auto-discovers your stack
> Start monitoring now
See Netdata in Action

Watch real-time monitoring in action—demos, tutorials, and engineering deep dives.

Product demos and walkthroughs
Real infrastructure, not staged
> Start with the 3-minute tour
Level Up Your Monitoring
Real problems. Real solutions. 112+ guides from basic monitoring to AI observability.
76,000+ Engineers Strong
615+ contributors. 1.5M daily downloads. One mission: simplify observability.
Per-Second. 90% Cheaper. Data Stays Home.
Side-by-side comparisons: costs, real-time granularity, and data sovereignty for every major tool.

See why teams switch from Datadog, Prometheus, Grafana, and more.

> Browse all comparisons
Edge-Native Observability, Born Open Source
Per-second visibility, ML on every metric, and data that never leaves your infrastructure.
Founded in 2016
615+ contributors worldwide
Remote-first, engineering-driven
Open source first
> Read our story
Promises We Publish—and Prove
12 principles backed by open code, independent validation, and measurable outcomes.
Open source, peer-reviewed
Zero config, instant value
Data sovereignty by design
Aligned pricing, no surprises
> See all 12 principles
Edge-Native, AI-Ready, 100% Open
76k+ stars. Full ML, AI, and automation—GPLv3+, not premium add-ons.
76,000+ GitHub stars
GPLv3+ licensed forever
ML on every metric, included
Zero vendor lock-in
> Explore our open source
Build Real-Time Observability for the World
Remote-first team shipping per-second monitoring with ML on every metric.
Remote-first, fully distributed
Open source (76k+ stars)
Challenging technical problems
Your code on millions of systems
> See open roles
Talk to a Netdata Human in <24 Hours
Sales, partnerships, press, or professional services—real engineers, fast answers.
Discuss your observability needs
Pricing and volume discounts
Partnership opportunities
Media and press inquiries
> Book a conversation
Your Data. Your Rules.
On-prem data, cloud control plane, transparent terms.
Trust & Scale
76,000+ GitHub Stars

One of the most popular open-source monitoring projects

SOC 2 Type 2 Certified

Enterprise-grade security and compliance

Data Sovereignty

Your metrics stay on your infrastructure

Validated
University of Amsterdam

"Most energy-efficient monitoring solution" — ICSOC 2023, peer-reviewed

ADASTEC (Autonomous Driving)

"Doesn't miss alerts—mission-critical trust for safety software"

Community Stats
615+ Contributors

Global community improving monitoring for everyone

1.5M+ Downloads/Day

Trusted by teams worldwide

GPLv3+ Licensed

Free forever, fully open source agent

Why Join?
Remote-First

Work from anywhere, async-friendly culture

Impact at Scale

Your work helps millions of systems

Compliance
SOC 2 Type 2

Audited security controls

GDPR Ready

Data stays on your infrastructure

Docker & Container Monitoring

See Every Container Heartbeat in Real Time

Monitor Docker containers, Kubernetes pods, and microservices with per-second precision. Zero configuration, instant insights, and 90% lower costs than traditional monitoring.

Background Hero

Monitor Containers Without the Complexity

Everything you need for Docker and Kubernetes observability

Per-Second Precision

Catch microbursts and transient spikes invisible to 30-second monitoring. See what’s actually happening, not averaged approximations.

Zero Configuration

Auto-discovers containers, generates dashboards, and configures alerts in under 60 seconds. No YAML, no PromQL, no manual setup.

ML Anomaly Detection

18 models per metric detect issues automatically with 99% false positive reduction. Unsupervised learning requires no configuration.

Predictable Costs

Pay per node, not per container or metric. Unlimited containers, unlimited metrics, unlimited logs - 90% cost reduction validated.

Root Cause Analysis

Anomaly Advisor correlates thousands of metrics to surface the top 30-50 causing issues. Find problems in seconds, not hours.

Console Replacement

Debug containers without SSH. Get top, iostat, netstat equivalents in your browser - with history and ML insights included.

Trusted by DevOps teams worldwide

Built for Modern Container Environments

Instant Container Visibility

Netdata auto-discovers Docker containers, Kubernetes pods, and microservices the moment they start. Per-second metrics for CPU, memory, network, and disk I/O reveal the true behavior of your workloads - no sampling, no averaging, no blind spots. See transient spikes that 30-second monitoring misses completely.

Per-second granularity

Learn about real-time monitoring

Instant Container Visibility

Troubleshoot Without SSH Access

Replace dozens of console tools with browser-based debugging. Get real-time process monitoring, network connections, systemd services, and container logs - all with history and ML anomaly detection. No more jumping between servers during incidents. Debug production containers safely without infrastructure access.

Console replacement

Explore Netdata Functions

Troubleshoot Without SSH Access

Unified Metrics and Logs

Eliminate expensive log pipelines with zero-infrastructure log management. Netdata queries systemd-journal and Windows Event Logs directly - no shipping, no indexing, no central clusters. Correlate logs with metrics instantly, analyze 1 million entries before sampling (200× more accurate than traditional tools), and reduce log costs by 90%.

90% cost reduction

Discover zero-pipeline logs

Unified Metrics and Logs

Edge-Based ML Anomaly Detection

Edge-based machine learning trains 18 models per metric, requiring unanimous agreement before flagging anomalies. This achieves 99% false positive reduction while catching real issues instantly. Anomaly Advisor correlates findings across thousands of metrics, surfacing root causes in the top 30-50 results. No cloud dependency, no data egress, no configuration required.

99% false positive reduction

Learn about ML anomaly detection

Edge-Based ML Anomaly Detection

Scale Without Limits

Netdata’s distributed architecture eliminates cardinality bottlenecks. Each agent stores its own metrics - no central aggregation, no memory explosions, no query degradation. Proven at 100,000+ nodes processing 4.5+ billion metrics per second globally. Add containers freely without worrying about cost multiplication or performance impact.

100,000+ nodes

Understand distributed architecture

Scale Without Limits

Kubernetes Native Integration

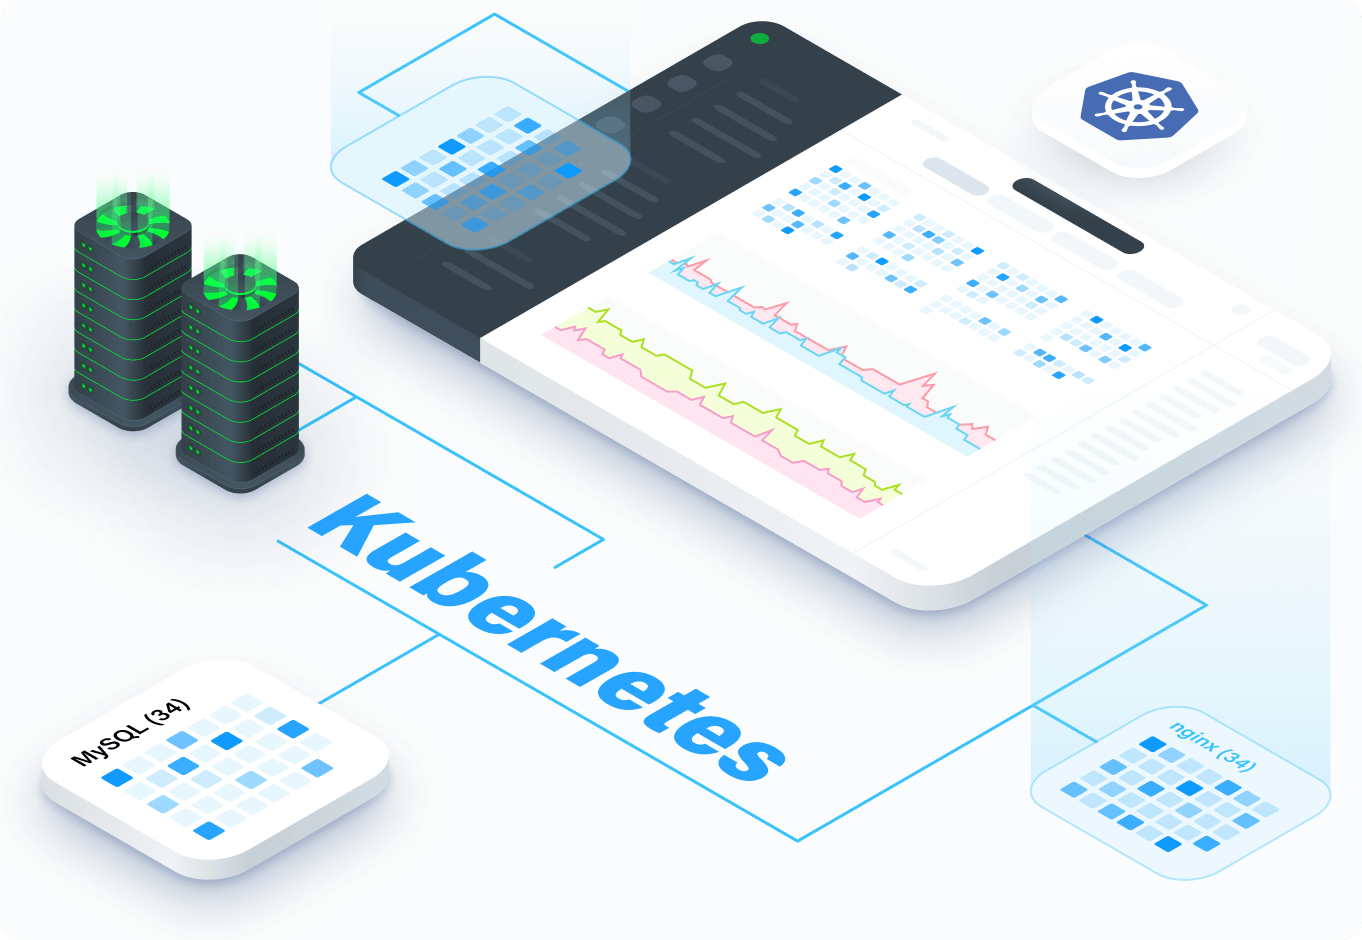
Deploy via Helm chart with automatic DaemonSet and Parent architecture. Monitor nodes, pods, containers, services, and cluster resources with zero configuration. Track HPA scaling, deployment health, and resource quotas. Label-based filtering and namespace isolation work out of the box. Get complete Kubernetes observability in minutes, not weeks.

60-second deployment

Deploy on Kubernetes

Kubernetes Native Integration

Why Teams Choose Netdata

Docker Monitoring That Actually Works

Traditional monitoring tools weren’t built for containers. Netdata was designed from day one for ephemeral, high-cardinality, dynamic environments.

Capability

Netdata

Traditional Monitoring

Data Granularity

✅ Per-second
Catch transient spikes and microbursts

⚠️ 10-60 seconds
Miss 90% of short-lived issues

Setup Time

✅ Under 60 seconds
Auto-discovery, auto-dashboards, auto-alerts

⚠️ Days to weeks
Manual configuration, dashboard building

Container Discovery

✅ Automatic
Docker, Kubernetes, Podman, containerd

⚠️ Manual registration
Requires configuration per container

Pricing Model

✅ Predictable per-node
Unlimited containers, metrics, logs

❌ Per-container or per-metric
Costs multiply with scale

Cardinality Handling

✅ Unlimited
Distributed storage, no bottlenecks

❌ Limited
Central aggregation causes explosions

ML Anomaly Detection

✅ Every metric, edge-based
99% false positive reduction

⚠️ Selected metrics, cloud-based
High false positive rates

Log Management

✅ Zero-pipeline
Direct journal access, 90% cost reduction

❌ Expensive pipelines
ELK/Splunk infrastructure required

Query Language

✅ None required
Point-and-click NIDL framework

⚠️ PromQL/SQL required
Steep learning curve

Resource Overhead

✅ <5% CPU, 150-200 MB RAM
Most energy-efficient (validated)

⚠️ 10-30% CPU overhead
Significant performance impact

Troubleshooting

✅ Browser-based console
SSH replacement with history

⚠️ SSH required
Manual console tool usage

See Full Comparison →

Complete Container Observability

Every Container Metric That Matters

CPU usage, throttling, memory consumption, OOM events, network bandwidth, packet errors, disk I/O, and container lifecycle - all per-second with zero configuration.

Per-second precision

Explore container metrics
Docker Metrics Dashboard

Why DevOps Teams Choose Netdata

Real results from organizations monitoring containers at scale

Frequently Asked Questions