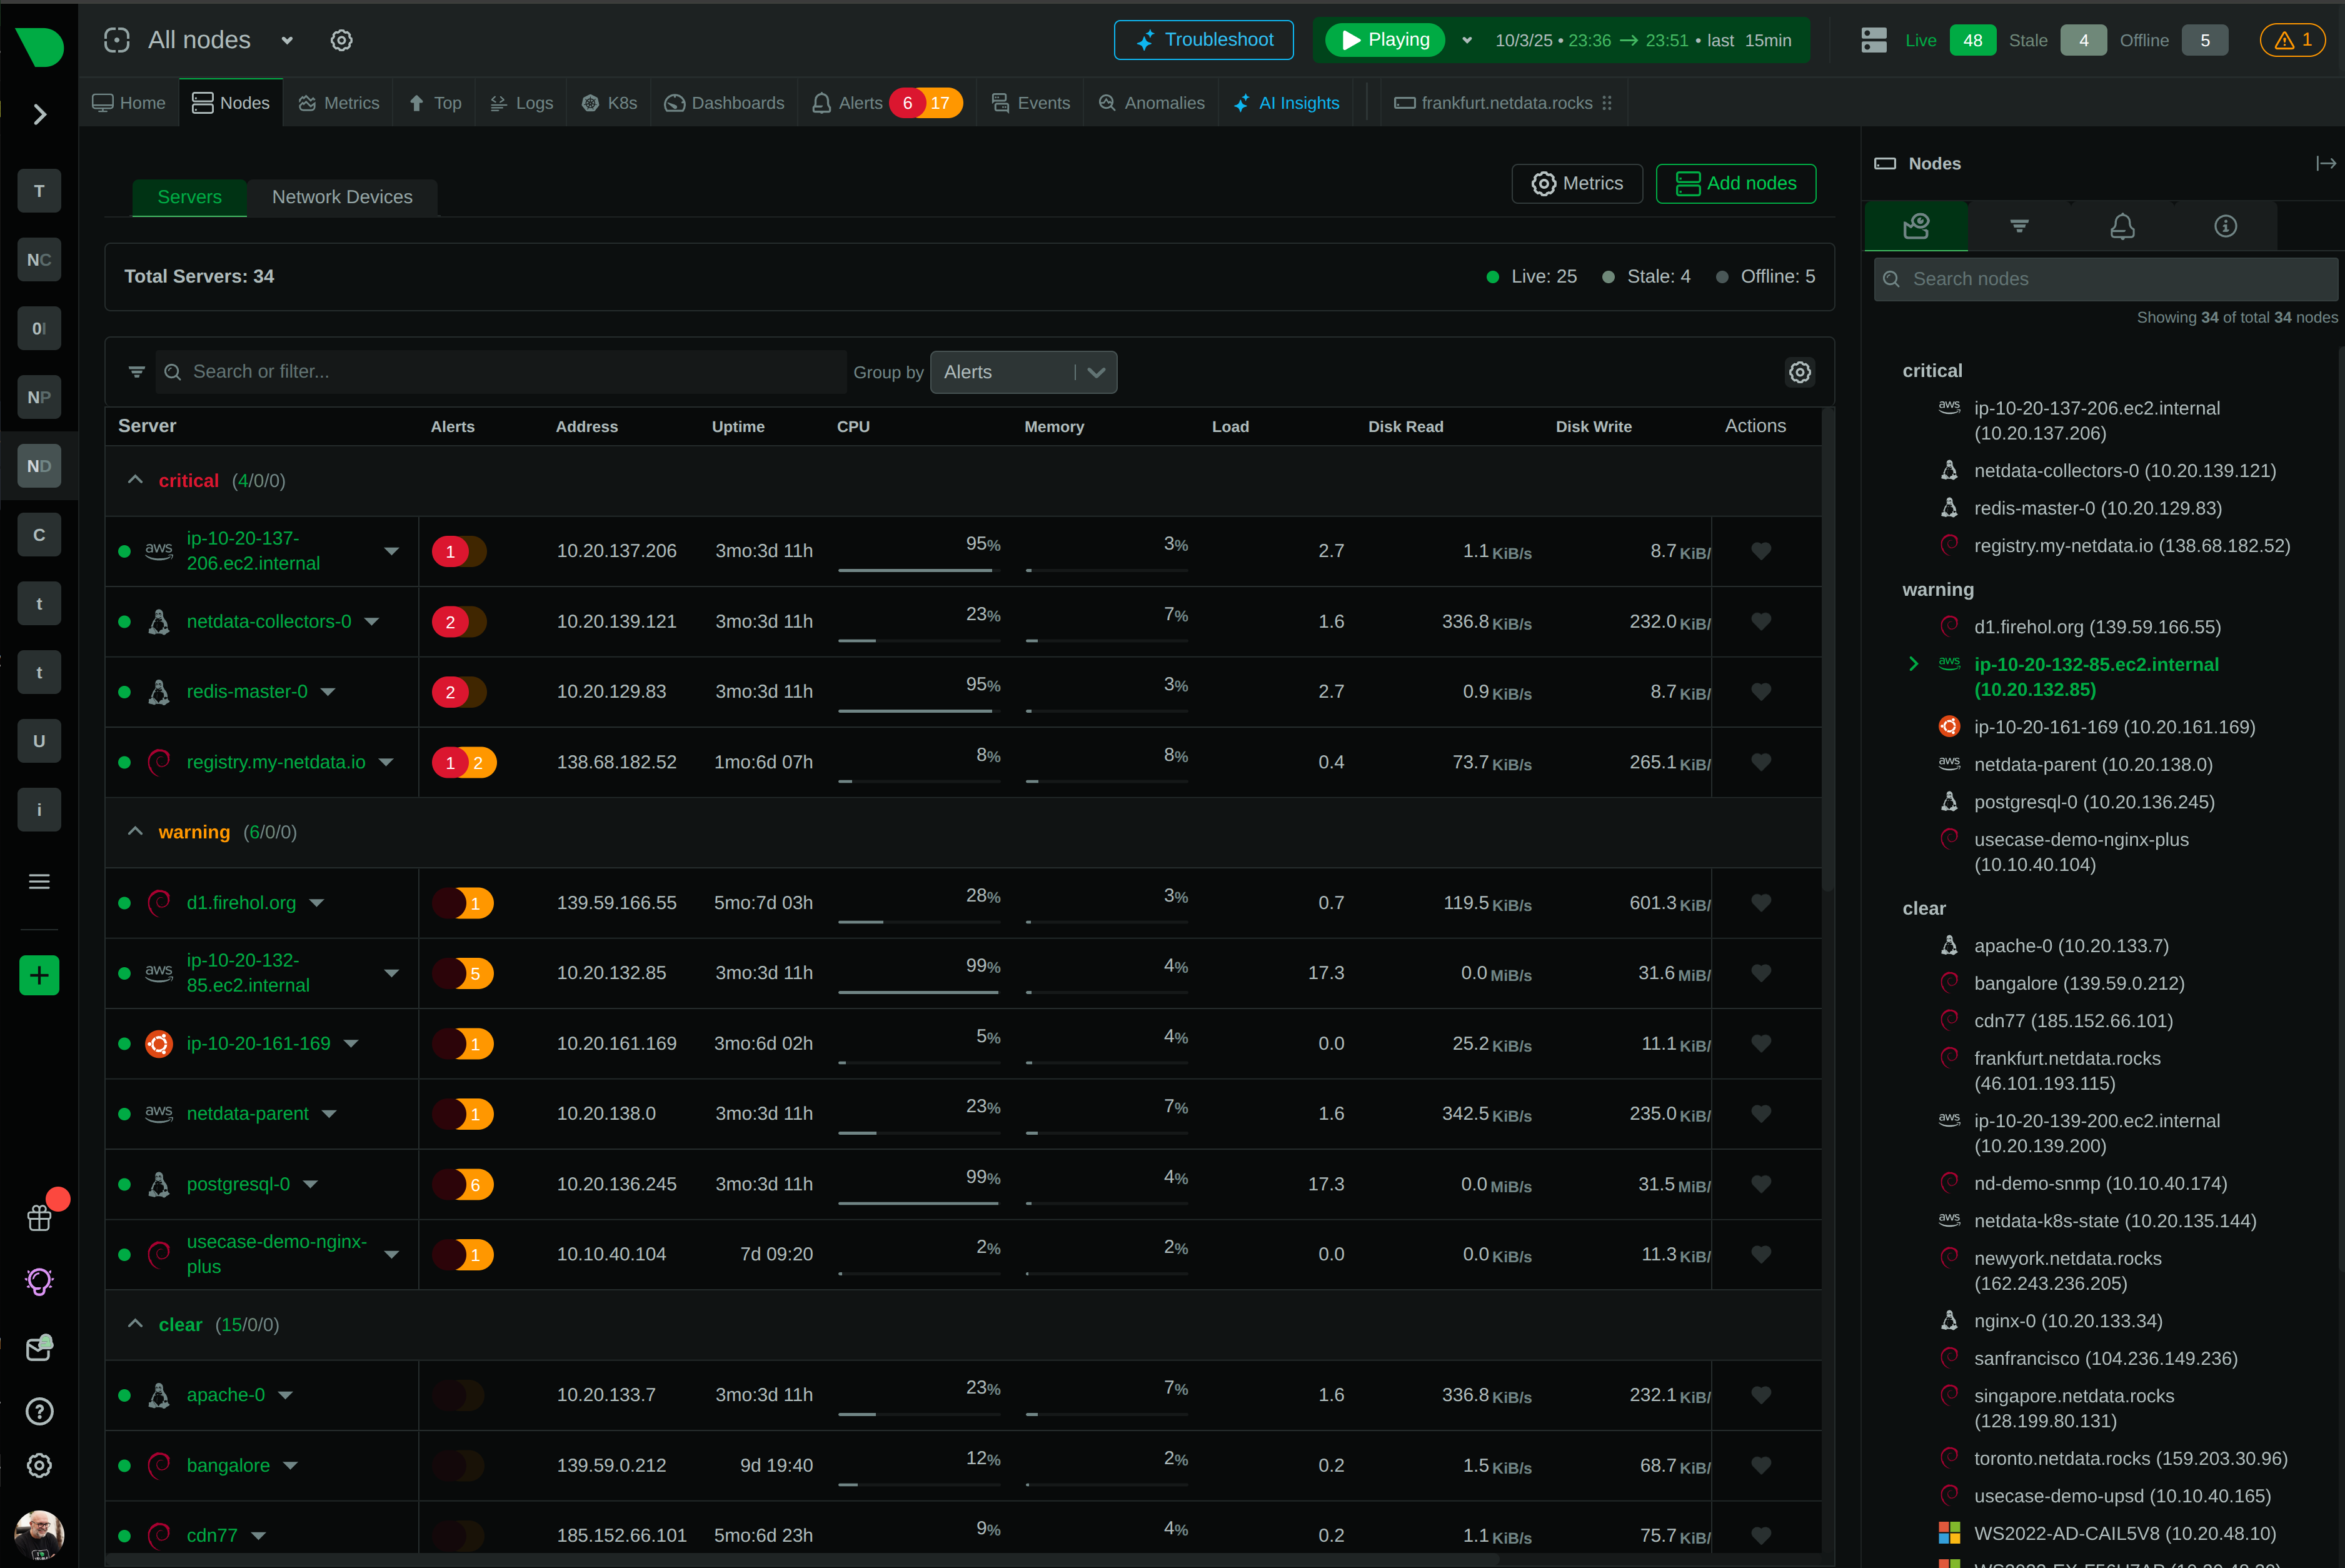
Unify Visibility Across Fragmented Infrastructure
Managing separate tools for metrics, logs, and different cloud providers creates context-switching nightmares and blind spots. Netdata provides single-pane-of-glass visibility with unified timeline synchronizing metrics, logs, events, and alerts. Same interface works on standalone Agents, Parents, and Cloud. Global filters apply across entire infrastructure instantly. Auto-discovery spans on-premises, AWS, Azure, GCP, and Kubernetes without manual configuration. Eliminate tool sprawl - consolidate 3-10 monitoring tools into one platform.
Single Unified Platform
View Architecture