The only agent that thinks for itself

Autonomous Monitoring with self-learning AI built-in, operating independently across your entire stack.

Unlimited Metrics & Logs
Machine learning & MCP
5% CPU, 150MB RAM
3GB disk, >1 year retention
800+ integrations, zero config
Dashboards, alerts out of the box
> Discover Netdata Agents
Centralized metrics streaming and storage

Aggregate metrics from multiple agents into centralized Parent nodes for unified monitoring across your infrastructure.

Stream from unlimited agents
Long-term data retention
High availability clustering
Data replication & backup
Scalable architecture
Enterprise-grade security
> Learn about Parents
Fully managed cloud platform

Access your monitoring data from anywhere with our SaaS platform. No infrastructure to manage, automatic updates, and global availability.

Zero infrastructure management
99.9% uptime SLA
Global data centers
Automatic updates & patches
Enterprise SSO & RBAC
SOC2 & ISO certified
> Explore Netdata Cloud
Deploy Netdata Cloud in your infrastructure

Run the full Netdata Cloud platform on-premises for complete data sovereignty and compliance with your security policies.

Complete data sovereignty
Air-gapped deployment
Custom compliance controls
Private network integration
Dedicated support team
Kubernetes & Docker support
> Learn about Cloud On-Premises
Powerful, intuitive monitoring interface

Modern, responsive UI built for real-time troubleshooting with customizable dashboards and advanced visualization capabilities.

Real-time chart updates
Customizable dashboards
Dark & light themes
Advanced filtering & search
Responsive on all devices
Collaboration features
> Explore Netdata UI
Monitor on the go

Native iOS and Android apps bring full monitoring capabilities to your mobile device with real-time alerts and notifications.

iOS & Android apps
Push notifications
Touch-optimized interface
Offline data access
Biometric authentication
Widget support
> Download apps

Best energy efficiency

True real-time per-second

100% automated zero config

Centralized observability

Multi-year retention

High availability built-in

Zero maintenance

Always up-to-date

Enterprise security

Complete data control

Air-gap ready

Compliance certified

Millisecond responsiveness

Infinite zoom & pan

Works on any device

Native performance

Instant alerts

Monitor anywhere

80% Faster Incident Resolution
AI-powered troubleshooting from detection, to root cause and blast radius identification, to reporting.
True Real-Time and Simple, even at Scale
Linearly and infinitely scalable full-stack observability, that can be deployed even mid-crisis.
90% Cost Reduction, Full Fidelity
Instead of centralizing the data, Netdata distributes the code, eliminating pipelines and complexity.
Control Without Surrender
SOC 2 Type 2 certified with every metric kept on your infrastructure.
Integrations

800+ collectors and notification channels, auto-discovered and ready out of the box.

800+ data collectors
Auto-discovery & zero config
Cloud, infra, app protocols
Notifications out of the box
> Explore integrations
Real Results
46% Cost Reduction

Reduced monitoring costs by 46% while cutting staff overhead by 67%.

— Leonardo Antunez, Codyas

Zero Pipeline

No data shipping. No central storage costs. Query at the edge.

From Our Users
"Out-of-the-Box"

So many out-of-the-box features! I mostly don't have to develop anything.

— Simon Beginn, LANCOM Systems

No Query Language

Point-and-click troubleshooting. No PromQL, no LogQL, no learning curve.

Enterprise Ready
67% Less Staff, 46% Cost Cut

Enterprise efficiency without enterprise complexity—real ROI from day one.

— Leonardo Antunez, Codyas

SOC 2 Type 2 Certified

Zero data egress. Only metadata reaches the cloud. Your metrics stay on your infrastructure.

Full Coverage
800+ Collectors

Auto-discovered and configured. No manual setup required.

Any Notification Channel

Slack, PagerDuty, Teams, email, webhooks—all built-in.

From Our Users
"A Rare Unicorn"

Netdata gives more than you invest in it. A rare unicorn that obeys the Pareto rule.

— Eduard Porquet Mateu, TMB Barcelona

99% Downtime Reduction

Reduced website downtime by 99% and cloud bill by 30% using Netdata alerts.

— Falkland Islands Government

Real Savings
30% Cloud Cost Reduction

Optimized resource allocation based on Netdata alerts cut cloud spending by 30%.

— Falkland Islands Government

46% Cost Cut

Reduced monitoring staff by 67% while cutting operational costs by 46%.

— Codyas

Real Coverage
"Plugin for Everything"

Netdata has agent capacity or a plugin for everything, including Windows and Kubernetes.

— Eduard Porquet Mateu, TMB Barcelona

"Out-of-the-Box"

So many out-of-the-box features! I mostly don't have to develop anything.

— Simon Beginn, LANCOM Systems

Real Speed
Troubleshooting in 30 Seconds

From 2-3 minutes to 30 seconds—instant visibility into any node issue.

— Matthew Artist, Nodecraft

20% Downtime Reduction

20% less downtime and 40% budget optimization from out-of-the-box monitoring.

— Simon Beginn, LANCOM Systems

Pay per Node. Unlimited Everything Else.

One price per node. Unlimited metrics, logs, users, and retention. No per-GB surprises.

Free tier—forever
No metric limits or caps
Retention you control
Cancel anytime
> See pricing plans
What's Your Monitoring Really Costing You?

Most teams overpay by 40-60%. Let's find out why.

Expose hidden metric charges
Calculate tool consolidation
Customers report 30-67% savings
Results in under 60 seconds
> See what you're really paying
Your Infrastructure Is Unique. Let's Talk.

Because monitoring 10 nodes is different from monitoring 10,000.

On-prem & air-gapped deployment
Volume pricing & agreements
Architecture review for your scale
Compliance & security support
> Start a conversation
Monitoring That Sells Itself

Deploy in minutes. Impress clients in hours. Earn recurring revenue for years.

30-second live demos close deals
Zero config = zero support burden
Competitive margins & deal protection
Response in 48 hours
> Apply to partner
Per-Second Metrics at Homelab Prices

Same engine, same dashboards, same ML. Just priced for tinkerers.

Community: Free forever · 5 nodes · non-commercial
Homelab: $90/yr · unlimited nodes · fair usage
> Start monitoring your lab—free
$1,000 Per Referral. Unlimited Referrals.

Your colleagues get 10% off. You get 10% commission. Everyone wins.

10% of subscriptions, up to $1,000 each
Track earnings inside Netdata Cloud
PayPal/Venmo payouts in 3-4 weeks
No caps, no complexity
> Get your referral link
Cost Proof
40% Budget Optimization

"Netdata's significant positive impact" — LANCOM Systems

Calculate Your Savings

Compare vs Datadog, Grafana, Dynatrace

Savings Proof
46% Cost Reduction

"Cut costs by 46%, staff by 67%" — Codyas

30% Cloud Bill Savings

"Reduced cloud bill by 30%" — Falkland Islands Gov

Enterprise Proof
"Better Than Combined Alternatives"

"Better observability with Netdata than combining other tools." — TMB Barcelona

Real Engineers, <24h Response

DPA, SLAs, on-prem, volume pricing

Why Partners Win
Demo Live Infrastructure

One command, 30 seconds, real data—no sandbox needed

Zero Tickets, High Margins

Auto-config + per-node pricing = predictable profit

Homelab Ready
"Absolutely Incredible"

"We tested every monitoring system under the sun." — Benjamin Gabler, CEO Rocket.Net

76k+ GitHub Stars

3rd most starred monitoring project

Worth Recommending
Product That Delivers

Customers report 40-67% cost cuts, 99% downtime reduction

Zero Risk to Your Rep

Free tier lets them try before they buy

Never Fight Fires Alone

Docs, community, and expert help—pick your path to resolution.

Learn.netdata.cloud docs
Discord, Forums, GitHub
Premium support available
> Get answers now
60 Seconds to First Dashboard

One command to install. Zero config. 850+ integrations documented.

Linux, Windows, K8s, Docker
Auto-discovers your stack
> Start monitoring now
See Netdata in Action

Watch real-time monitoring in action—demos, tutorials, and engineering deep dives.

Product demos and walkthroughs
Real infrastructure, not staged
> Start with the 3-minute tour
Level Up Your Monitoring
Real problems. Real solutions. 112+ guides from basic monitoring to AI observability.
76,000+ Engineers Strong
615+ contributors. 1.5M daily downloads. One mission: simplify observability.
Per-Second. 90% Cheaper. Data Stays Home.
Side-by-side comparisons: costs, real-time granularity, and data sovereignty for every major tool.

See why teams switch from Datadog, Prometheus, Grafana, and more.

> Browse all comparisons
Edge-Native Observability, Born Open Source
Per-second visibility, ML on every metric, and data that never leaves your infrastructure.
Founded in 2016
615+ contributors worldwide
Remote-first, engineering-driven
Open source first
> Read our story
Promises We Publish—and Prove
12 principles backed by open code, independent validation, and measurable outcomes.
Open source, peer-reviewed
Zero config, instant value
Data sovereignty by design
Aligned pricing, no surprises
> See all 12 principles
Edge-Native, AI-Ready, 100% Open
76k+ stars. Full ML, AI, and automation—GPLv3+, not premium add-ons.
76,000+ GitHub stars
GPLv3+ licensed forever
ML on every metric, included
Zero vendor lock-in
> Explore our open source
Build Real-Time Observability for the World
Remote-first team shipping per-second monitoring with ML on every metric.
Remote-first, fully distributed
Open source (76k+ stars)
Challenging technical problems
Your code on millions of systems
> See open roles
Talk to a Netdata Human in <24 Hours
Sales, partnerships, press, or professional services—real engineers, fast answers.
Discuss your observability needs
Pricing and volume discounts
Partnership opportunities
Media and press inquiries
> Book a conversation
Your Data. Your Rules.
On-prem data, cloud control plane, transparent terms.
Trust & Scale
76,000+ GitHub Stars

One of the most popular open-source monitoring projects

SOC 2 Type 2 Certified

Enterprise-grade security and compliance

Data Sovereignty

Your metrics stay on your infrastructure

Validated
University of Amsterdam

"Most energy-efficient monitoring solution" — ICSOC 2023, peer-reviewed

ADASTEC (Autonomous Driving)

"Doesn't miss alerts—mission-critical trust for safety software"

Community Stats
615+ Contributors

Global community improving monitoring for everyone

1.5M+ Downloads/Day

Trusted by teams worldwide

GPLv3+ Licensed

Free forever, fully open source agent

Why Join?
Remote-First

Work from anywhere, async-friendly culture

Impact at Scale

Your work helps millions of systems

Compliance
SOC 2 Type 2

Audited security controls

GDPR Ready

Data stays on your infrastructure

IoT Monitoring & Observability

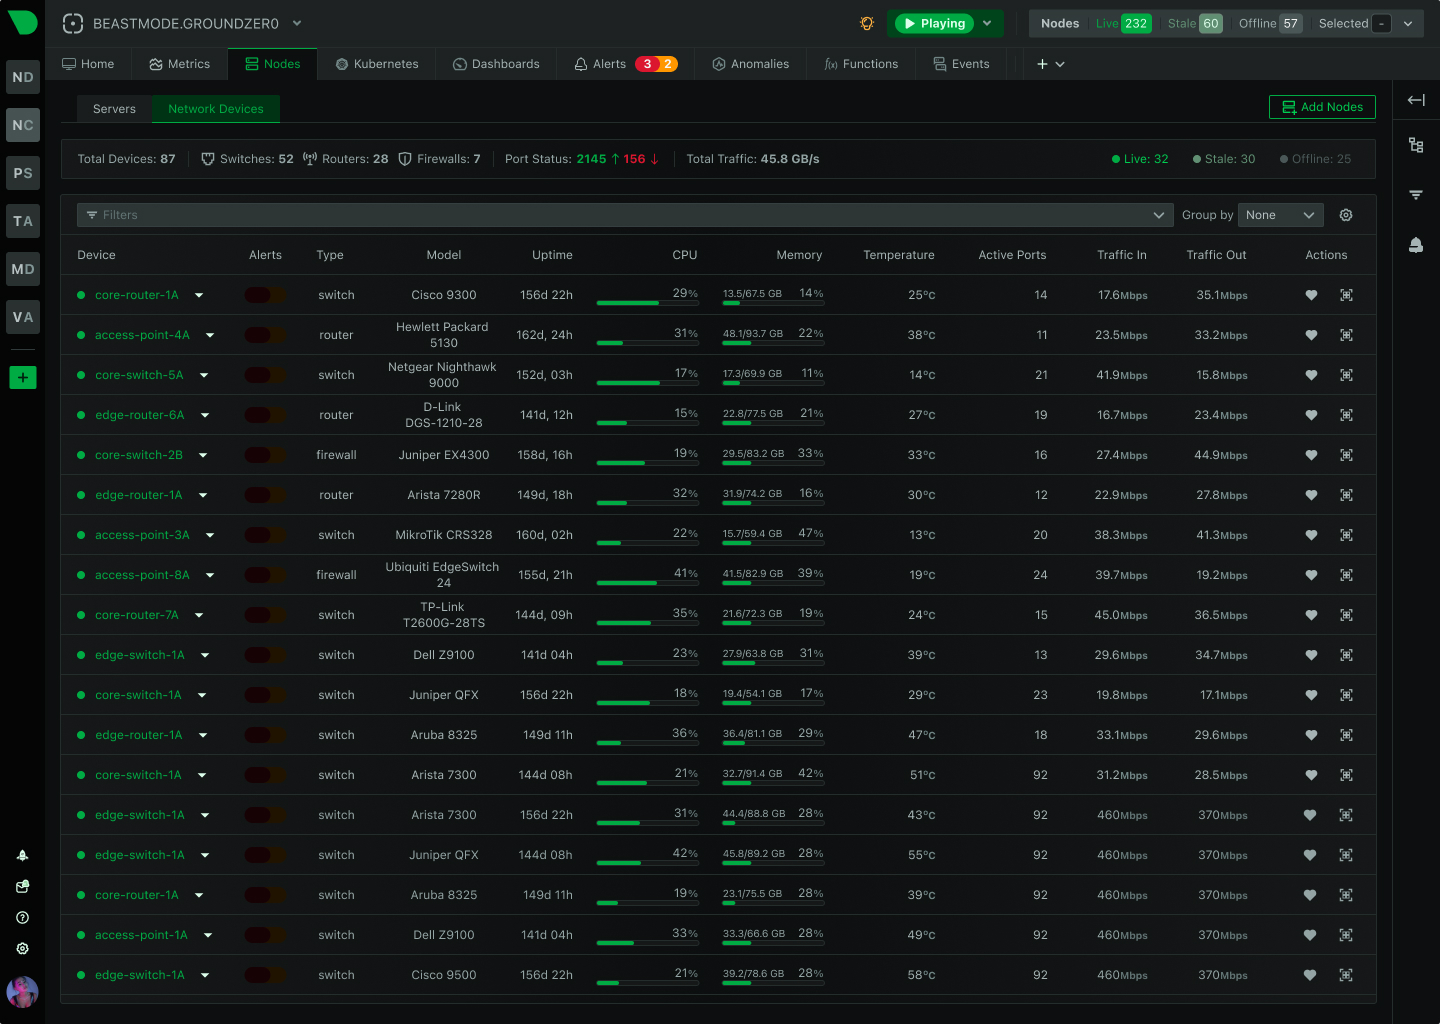
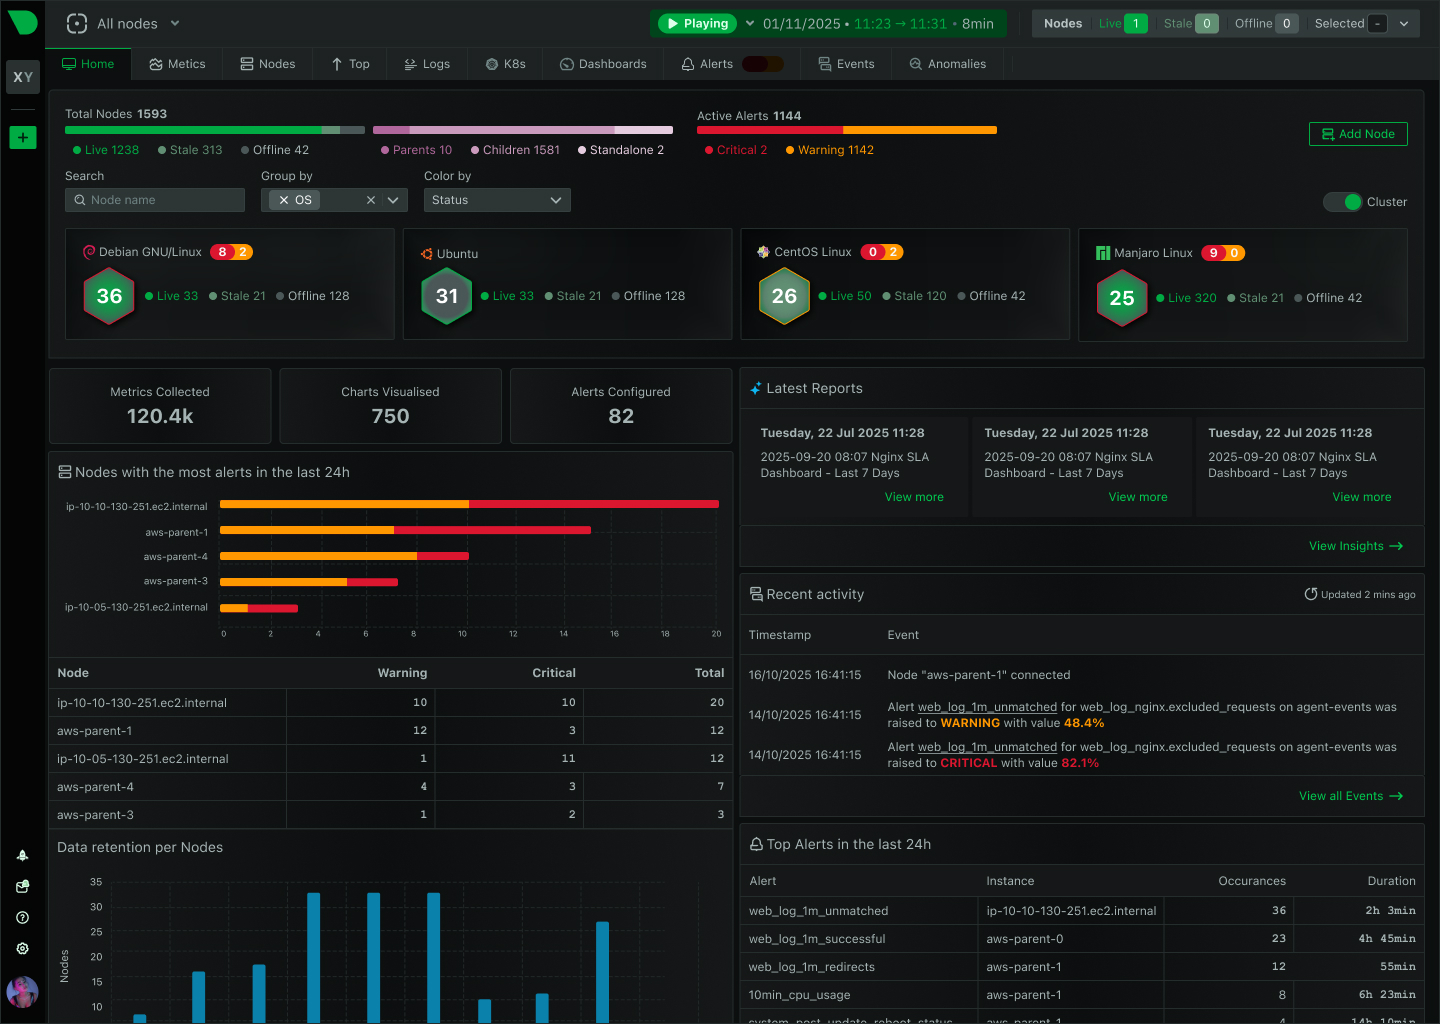
See Every Sensor, Gateway, and Edge Device in Real Time

Monitor thousands of IoT devices with per-second visibility, ML-powered anomaly detection, and 90% cost reduction. Netdata’s edge-native architecture delivers complete observability from sensors to cloud - without the complexity or unpredictable bills.

Background Hero

Transform IoT Operations with Intelligence at the Edge

Six capabilities that eliminate the complexity, cost, and blind spots of traditional IoT monitoring

Instant Device Visibility

Auto-discover sensors, gateways, and edge devices across your network. Per-second metrics from every device without manual configuration or complex setup.

ML Anomaly Detection

18-model consensus anomaly detection achieves 99% false positive reduction. Spot sensor drift, connectivity issues, and performance degradation instantly.

Predictable IoT Economics

Fixed per-node pricing with unlimited metrics and logs. No surprise bills from data volume spikes. 90% cost reduction versus cloud platforms.

Multi-Vendor Harmony

Unified monitoring across all device types and protocols. SNMP, HTTP, OpenTelemetry, and custom sensors - all in one platform with consistent dashboards.

Edge Intelligence

Process and analyze data where it’s generated. Minimal bandwidth usage, instant insights, and operation during network disruptions.

Complete Data Control

All observability data stays on your infrastructure. Zero metric egress to cloud. Satisfies GDPR, HIPAA, and regional data residency by design.

Trusted by organizations monitoring millions of IoT devices worldwide

Solve the Hardest IoT Monitoring Challenges

Track Every Device Without Breaking the Budget

Traditional platforms charge per metric or data volume, making IoT monitoring prohibitively expensive. Netdata’s per-node pricing means you can monitor unlimited sensors, gateways, and edge devices for a fixed, predictable cost. Deploy comprehensive observability across your entire IoT fleet without financial anxiety.

90% cost reduction vs. cloud platforms

See Pricing

Track Every Device Without Breaking the Budget

Detect Problems Before They Cascade

IoT failures compound rapidly - one faulty sensor can trigger production line shutdowns or service disruptions. Netdata’s per-second monitoring with ML anomaly detection catches issues in under 2 seconds, giving you time to respond before problems escalate. See exactly which device is failing and why, with complete historical context.

80% faster MTTR

Explore AI Features

Detect Problems Before They Cascade

Monitor Thousands of Devices Without Complexity

Managing diverse IoT devices from multiple vendors creates operational chaos. Netdata auto-discovers sensors, gateways, and edge devices across your network, generating unified dashboards automatically. No manual configuration, no vendor-specific tools, no dashboard building - just instant visibility across your entire fleet.

100K+ device deployments

View Architecture

Monitor Thousands of Devices Without Complexity

Operate Reliably at the Edge

Network disruptions shouldn’t mean data loss or blind spots. Netdata agents buffer data locally during connectivity issues and automatically replay when connections restore. Each edge device operates independently with full monitoring capabilities, ensuring continuous visibility even in challenging network conditions.

Zero data loss during outages

Learn About Edge Architecture

Operate Reliably at the Edge

Platform Comparison

Netdata vs. Traditional IoT Monitoring

See how Netdata’s edge-native architecture solves the fundamental limitations of centralized IoT platforms

Capability

Netdata

Traditional Platforms

Data Granularity

✅ Per-Second
Catch transient issues and microbursts

⚠️ 15-60 Seconds
Miss transient IoT anomalies

Per-Device Metrics

✅ Native Support
Track individual sensor performance

⚠️ Limited
Often requires custom implementation

ML Anomaly Detection

✅ 99% FP Reduction
18-model consensus significantly reduces noise

⚠️ Basic
Static thresholds or limited ML

Cost Model

✅ Per-Node Pricing
Unlimited metrics, predictable bills

⚠️ Per-Metric/Volume
Unpredictable, exponential costs

Data Sovereignty

✅ Edge Storage
All data stays on-premises

⚠️ Cloud Dependent
Data egress to vendor infrastructure

Setup Time

✅ 60 Seconds
Auto-discovery, zero configuration

⚠️ Days to Weeks
Manual setup, complex tuning

Scalability

✅ Linear Scaling
100K+ devices proven

⚠️ Challenging
Complexity increases at scale

Network Resilience

✅ Offline Operation
Local buffering, automatic replay

❌ Cloud Dependent
Blind during connectivity loss

Resource Usage

✅ <5% CPU, 150MB RAM
Minimal mode: <1% CPU, <100MB

⚠️ Higher Overhead
Heavier agent requirements

See Full Feature Comparison

Comprehensive IoT Observability Across Your Stack

Monitor Every Sensor Type

Temperature, humidity, motion, pressure - Netdata auto-discovers and monitors all sensor types. Native support for 1-Wire, lm-sensors, IPMI, and custom protocols. Per-second readings with ML anomaly detection catch sensor drift and failures instantly.

Native sensor support with zero configuration

View Sensor Integrations
Smart Sensors Dashboard

IoT Monitoring Excellence

Key capabilities that make Netdata the superior choice for IoT observability

Frequently Asked Questions