The honest microservices observability stack in 2026 is three layers:
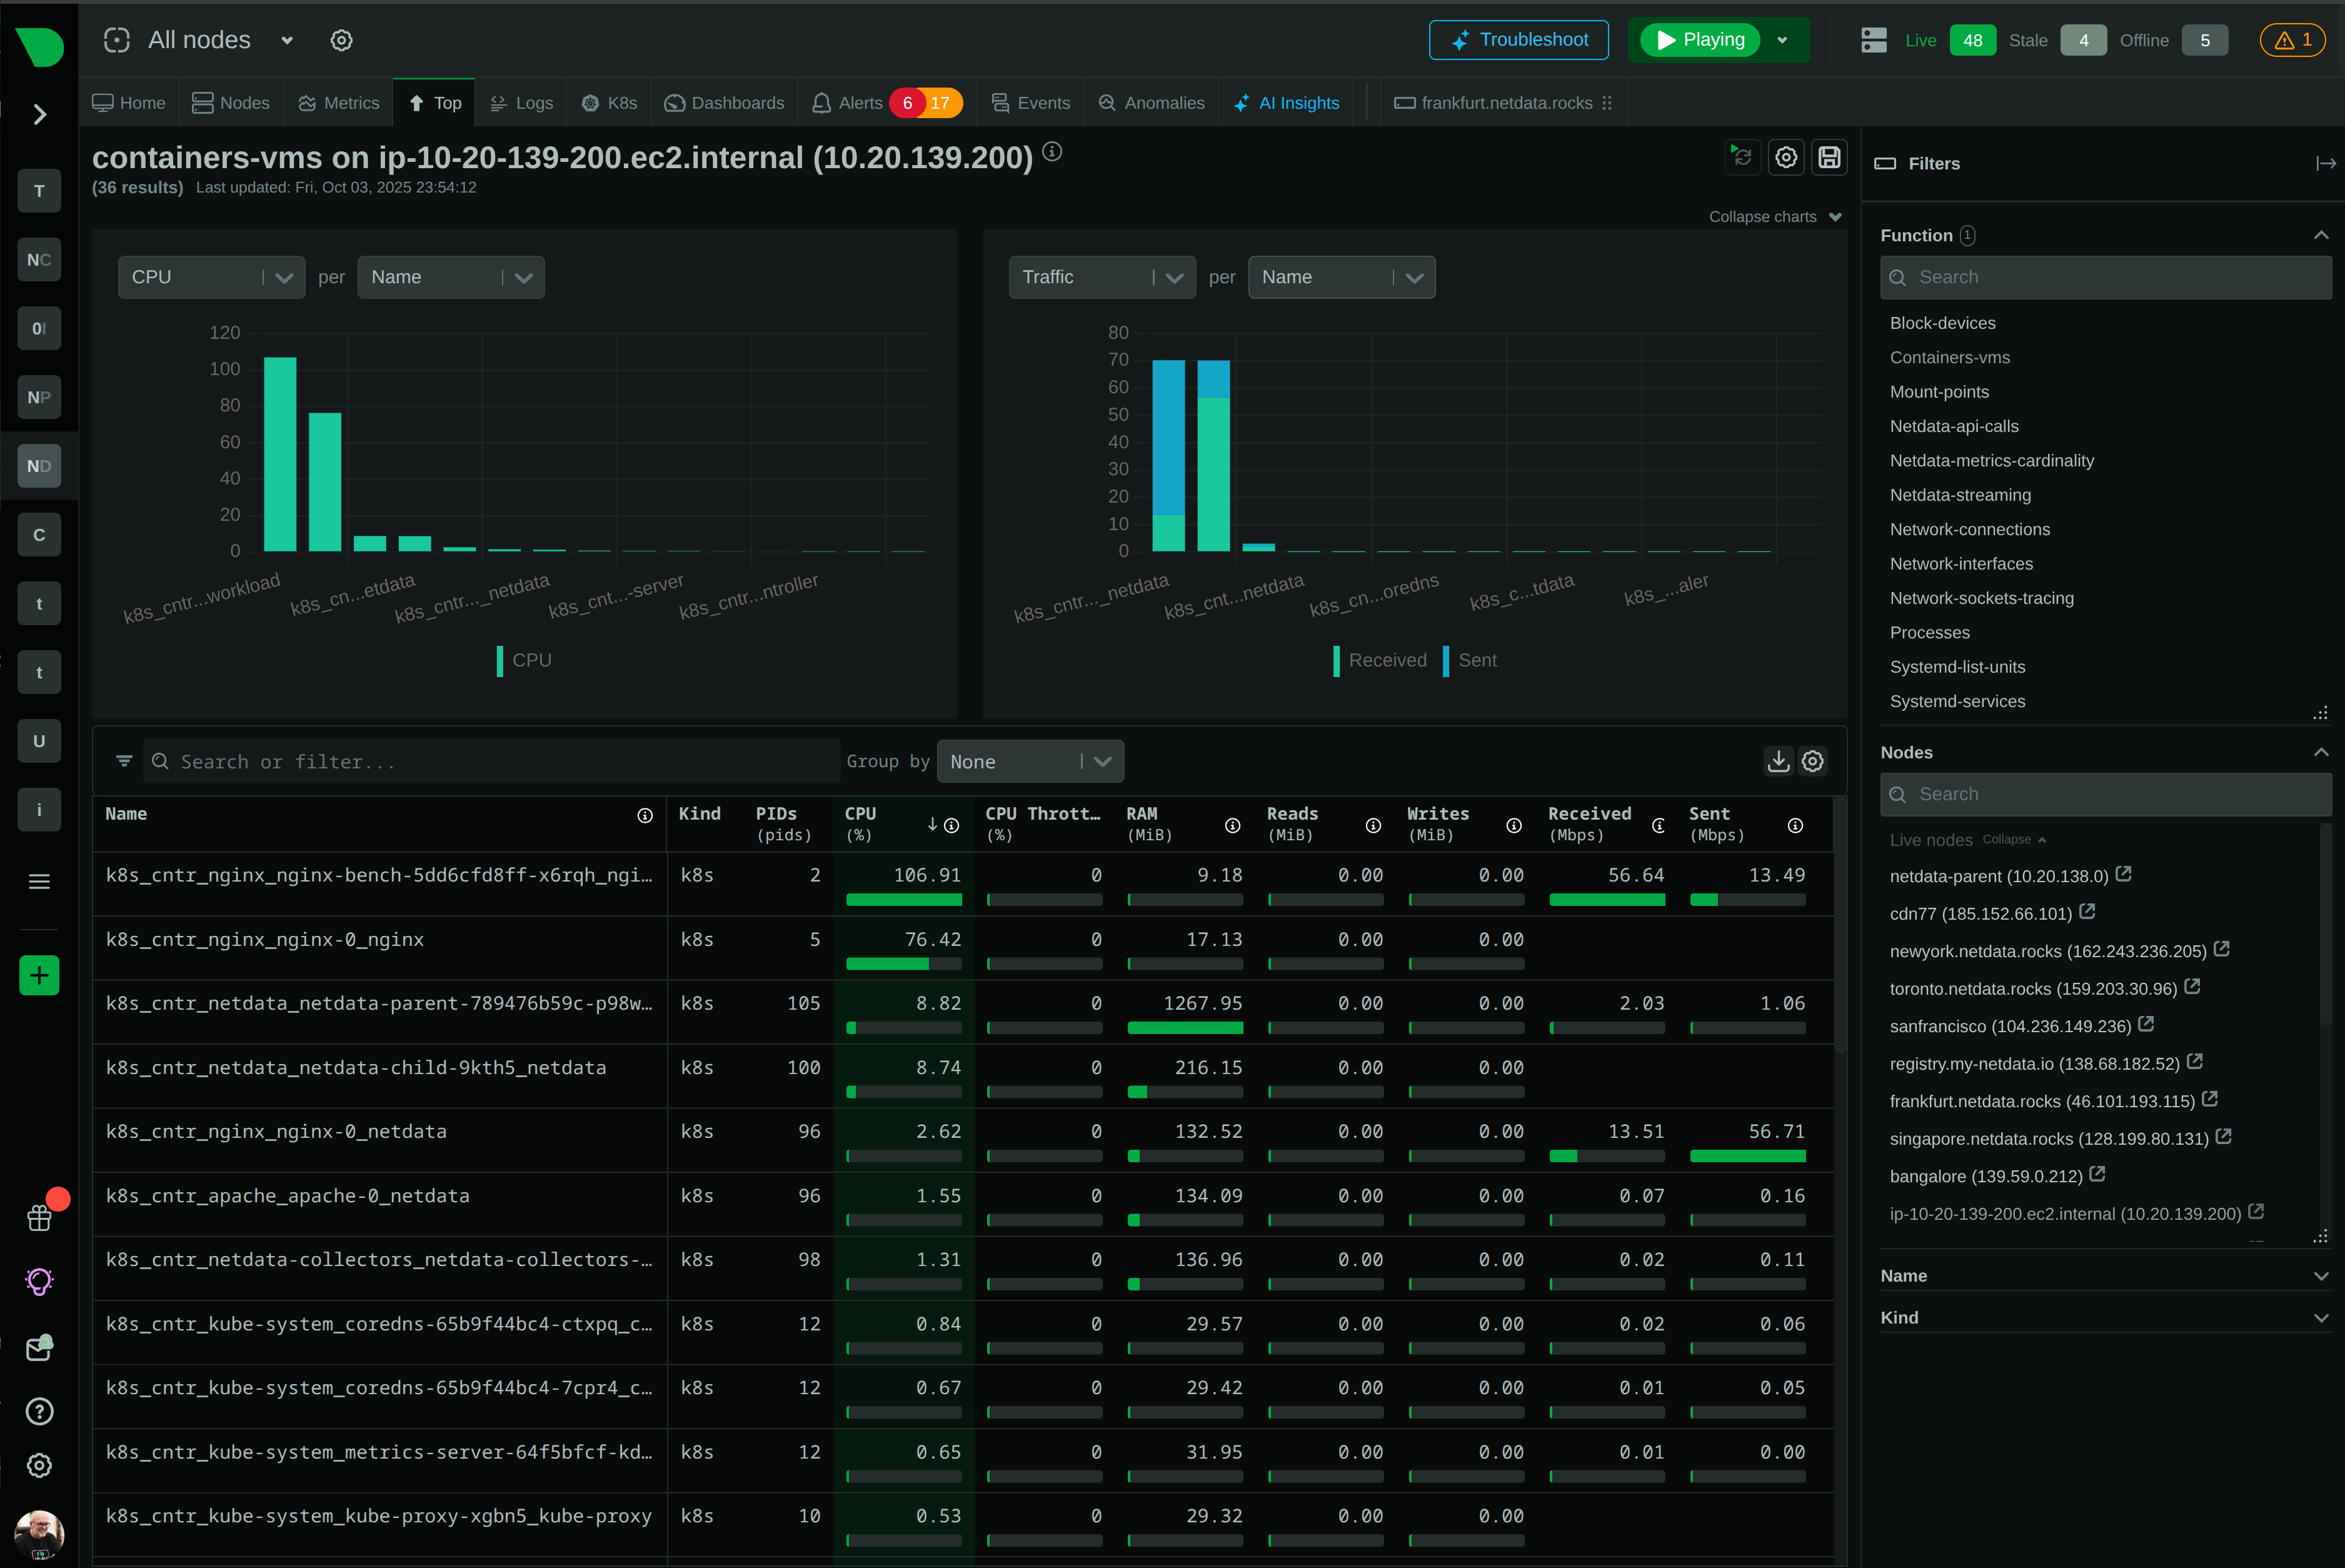
- Per-second metrics at every pod — agent-level collection that catches OOMs, restarts, and transient saturation that polling misses.
- Service-to-service latency tracking — either via OpenTelemetry traces (when you can afford full-fidelity) or via service-mesh sidecar metrics.
- Log correlation across services — structured logs with consistent trace IDs so an incident can be reconstructed without grepping.
Netdata’s role in this stack is the first layer: per-pod metrics at one-second resolution, auto-discovered, with ML on every collected metric. It does not replace the OpenTelemetry tracing layer — distributed tracing is on Netdata’s roadmap but not shipping yet. The recommended pairing is Netdata for metrics and logs + Jaeger or Tempo for traces, all instrumented via OpenTelemetry, all routed to wherever your team prefers to query.