The only agent that thinks for itself

Autonomous Monitoring with self-learning AI built-in, operating independently across your entire stack.

Unlimited Metrics & Logs
Machine learning & MCP
5% CPU, 150MB RAM
3GB disk, >1 year retention
800+ integrations, zero config
Dashboards, alerts out of the box
> Discover Netdata Agents
Centralized metrics streaming and storage

Aggregate metrics from multiple agents into centralized Parent nodes for unified monitoring across your infrastructure.

Stream from unlimited agents
Long-term data retention
High availability clustering
Data replication & backup
Scalable architecture
Enterprise-grade security
> Learn about Parents
Fully managed cloud platform

Access your monitoring data from anywhere with our SaaS platform. No infrastructure to manage, automatic updates, and global availability.

Zero infrastructure management
99.9% uptime SLA
Global data centers
Automatic updates & patches
Enterprise SSO & RBAC
SOC2 & ISO certified
> Explore Netdata Cloud
Deploy Netdata Cloud in your infrastructure

Run the full Netdata Cloud platform on-premises for complete data sovereignty and compliance with your security policies.

Complete data sovereignty
Air-gapped deployment
Custom compliance controls
Private network integration
Dedicated support team
Kubernetes & Docker support
> Learn about Cloud On-Premises
Powerful, intuitive monitoring interface

Modern, responsive UI built for real-time troubleshooting with customizable dashboards and advanced visualization capabilities.

Real-time chart updates
Customizable dashboards
Dark & light themes
Advanced filtering & search
Responsive on all devices
Collaboration features
> Explore Netdata UI
Monitor on the go

Native iOS and Android apps bring full monitoring capabilities to your mobile device with real-time alerts and notifications.

iOS & Android apps
Push notifications
Touch-optimized interface
Offline data access
Biometric authentication
Widget support
> Download apps

Best energy efficiency

True real-time per-second

100% automated zero config

Centralized observability

Multi-year retention

High availability built-in

Zero maintenance

Always up-to-date

Enterprise security

Complete data control

Air-gap ready

Compliance certified

Millisecond responsiveness

Infinite zoom & pan

Works on any device

Native performance

Instant alerts

Monitor anywhere

80% Faster Incident Resolution
AI-powered troubleshooting from detection, to root cause and blast radius identification, to reporting.
True Real-Time and Simple, even at Scale
Linearly and infinitely scalable full-stack observability, that can be deployed even mid-crisis.
90% Cost Reduction, Full Fidelity
Instead of centralizing the data, Netdata distributes the code, eliminating pipelines and complexity.
Control Without Surrender
SOC 2 Type 2 certified with every metric kept on your infrastructure.
Integrations

800+ collectors and notification channels, auto-discovered and ready out of the box.

800+ data collectors
Auto-discovery & zero config
Cloud, infra, app protocols
Notifications out of the box
> Explore integrations
Real Results
46% Cost Reduction

Reduced monitoring costs by 46% while cutting staff overhead by 67%.

— Leonardo Antunez, Codyas

Zero Pipeline

No data shipping. No central storage costs. Query at the edge.

From Our Users
"Out-of-the-Box"

So many out-of-the-box features! I mostly don't have to develop anything.

— Simon Beginn, LANCOM Systems

No Query Language

Point-and-click troubleshooting. No PromQL, no LogQL, no learning curve.

Enterprise Ready
67% Less Staff, 46% Cost Cut

Enterprise efficiency without enterprise complexity—real ROI from day one.

— Leonardo Antunez, Codyas

SOC 2 Type 2 Certified

Zero data egress. Only metadata reaches the cloud. Your metrics stay on your infrastructure.

Full Coverage
800+ Collectors

Auto-discovered and configured. No manual setup required.

Any Notification Channel

Slack, PagerDuty, Teams, email, webhooks—all built-in.

From Our Users
"A Rare Unicorn"

Netdata gives more than you invest in it. A rare unicorn that obeys the Pareto rule.

— Eduard Porquet Mateu, TMB Barcelona

99% Downtime Reduction

Reduced website downtime by 99% and cloud bill by 30% using Netdata alerts.

— Falkland Islands Government

Real Savings
30% Cloud Cost Reduction

Optimized resource allocation based on Netdata alerts cut cloud spending by 30%.

— Falkland Islands Government

46% Cost Cut

Reduced monitoring staff by 67% while cutting operational costs by 46%.

— Codyas

Real Coverage
"Plugin for Everything"

Netdata has agent capacity or a plugin for everything, including Windows and Kubernetes.

— Eduard Porquet Mateu, TMB Barcelona

"Out-of-the-Box"

So many out-of-the-box features! I mostly don't have to develop anything.

— Simon Beginn, LANCOM Systems

Real Speed
Troubleshooting in 30 Seconds

From 2-3 minutes to 30 seconds—instant visibility into any node issue.

— Matthew Artist, Nodecraft

20% Downtime Reduction

20% less downtime and 40% budget optimization from out-of-the-box monitoring.

— Simon Beginn, LANCOM Systems

Pay per Node. Unlimited Everything Else.

One price per node. Unlimited metrics, logs, users, and retention. No per-GB surprises.

Free tier—forever
No metric limits or caps
Retention you control
Cancel anytime
> See pricing plans
What's Your Monitoring Really Costing You?

Most teams overpay by 40-60%. Let's find out why.

Expose hidden metric charges
Calculate tool consolidation
Customers report 30-67% savings
Results in under 60 seconds
> See what you're really paying
Your Infrastructure Is Unique. Let's Talk.

Because monitoring 10 nodes is different from monitoring 10,000.

On-prem & air-gapped deployment
Volume pricing & agreements
Architecture review for your scale
Compliance & security support
> Start a conversation
Monitoring That Sells Itself

Deploy in minutes. Impress clients in hours. Earn recurring revenue for years.

30-second live demos close deals
Zero config = zero support burden
Competitive margins & deal protection
Response in 48 hours
> Apply to partner
Per-Second Metrics at Homelab Prices

Same engine, same dashboards, same ML. Just priced for tinkerers.

Community: Free forever · 5 nodes · non-commercial
Homelab: $90/yr · unlimited nodes · fair usage
> Start monitoring your lab—free
$1,000 Per Referral. Unlimited Referrals.

Your colleagues get 10% off. You get 10% commission. Everyone wins.

10% of subscriptions, up to $1,000 each
Track earnings inside Netdata Cloud
PayPal/Venmo payouts in 3-4 weeks
No caps, no complexity
> Get your referral link
Cost Proof
40% Budget Optimization

"Netdata's significant positive impact" — LANCOM Systems

Calculate Your Savings

Compare vs Datadog, Grafana, Dynatrace

Savings Proof
46% Cost Reduction

"Cut costs by 46%, staff by 67%" — Codyas

30% Cloud Bill Savings

"Reduced cloud bill by 30%" — Falkland Islands Gov

Enterprise Proof
"Better Than Combined Alternatives"

"Better observability with Netdata than combining other tools." — TMB Barcelona

Real Engineers, <24h Response

DPA, SLAs, on-prem, volume pricing

Why Partners Win
Demo Live Infrastructure

One command, 30 seconds, real data—no sandbox needed

Zero Tickets, High Margins

Auto-config + per-node pricing = predictable profit

Homelab Ready
"Absolutely Incredible"

"We tested every monitoring system under the sun." — Benjamin Gabler, CEO Rocket.Net

76k+ GitHub Stars

3rd most starred monitoring project

Worth Recommending
Product That Delivers

Customers report 40-67% cost cuts, 99% downtime reduction

Zero Risk to Your Rep

Free tier lets them try before they buy

Never Fight Fires Alone

Docs, community, and expert help—pick your path to resolution.

Learn.netdata.cloud docs
Discord, Forums, GitHub
Premium support available
> Get answers now
60 Seconds to First Dashboard

One command to install. Zero config. 850+ integrations documented.

Linux, Windows, K8s, Docker
Auto-discovers your stack
> Start monitoring now
See Netdata in Action

Watch real-time monitoring in action—demos, tutorials, and engineering deep dives.

Product demos and walkthroughs
Real infrastructure, not staged
> Start with the 3-minute tour
Level Up Your Monitoring
Real problems. Real solutions. 112+ guides from basic monitoring to AI observability.
76,000+ Engineers Strong
615+ contributors. 1.5M daily downloads. One mission: simplify observability.
Per-Second. 90% Cheaper. Data Stays Home.
Side-by-side comparisons: costs, real-time granularity, and data sovereignty for every major tool.

See why teams switch from Datadog, Prometheus, Grafana, and more.

> Browse all comparisons
Edge-Native Observability, Born Open Source
Per-second visibility, ML on every metric, and data that never leaves your infrastructure.
Founded in 2016
615+ contributors worldwide
Remote-first, engineering-driven
Open source first
> Read our story
Promises We Publish—and Prove
12 principles backed by open code, independent validation, and measurable outcomes.
Open source, peer-reviewed
Zero config, instant value
Data sovereignty by design
Aligned pricing, no surprises
> See all 12 principles
Edge-Native, AI-Ready, 100% Open
76k+ stars. Full ML, AI, and automation—GPLv3+, not premium add-ons.
76,000+ GitHub stars
GPLv3+ licensed forever
ML on every metric, included
Zero vendor lock-in
> Explore our open source
Build Real-Time Observability for the World
Remote-first team shipping per-second monitoring with ML on every metric.
Remote-first, fully distributed
Open source (76k+ stars)
Challenging technical problems
Your code on millions of systems
> See open roles
Talk to a Netdata Human in <24 Hours
Sales, partnerships, press, or professional services—real engineers, fast answers.
Discuss your observability needs
Pricing and volume discounts
Partnership opportunities
Media and press inquiries
> Book a conversation
Your Data. Your Rules.
On-prem data, cloud control plane, transparent terms.
Trust & Scale
76,000+ GitHub Stars

One of the most popular open-source monitoring projects

SOC 2 Type 2 Certified

Enterprise-grade security and compliance

Data Sovereignty

Your metrics stay on your infrastructure

Validated
University of Amsterdam

"Most energy-efficient monitoring solution" — ICSOC 2023, peer-reviewed

ADASTEC (Autonomous Driving)

"Doesn't miss alerts—mission-critical trust for safety software"

Community Stats
615+ Contributors

Global community improving monitoring for everyone

1.5M+ Downloads/Day

Trusted by teams worldwide

GPLv3+ Licensed

Free forever, fully open source agent

Why Join?
Remote-First

Work from anywhere, async-friendly culture

Impact at Scale

Your work helps millions of systems

Compliance
SOC 2 Type 2

Audited security controls

GDPR Ready

Data stays on your infrastructure

Multi-Cloud Monitoring

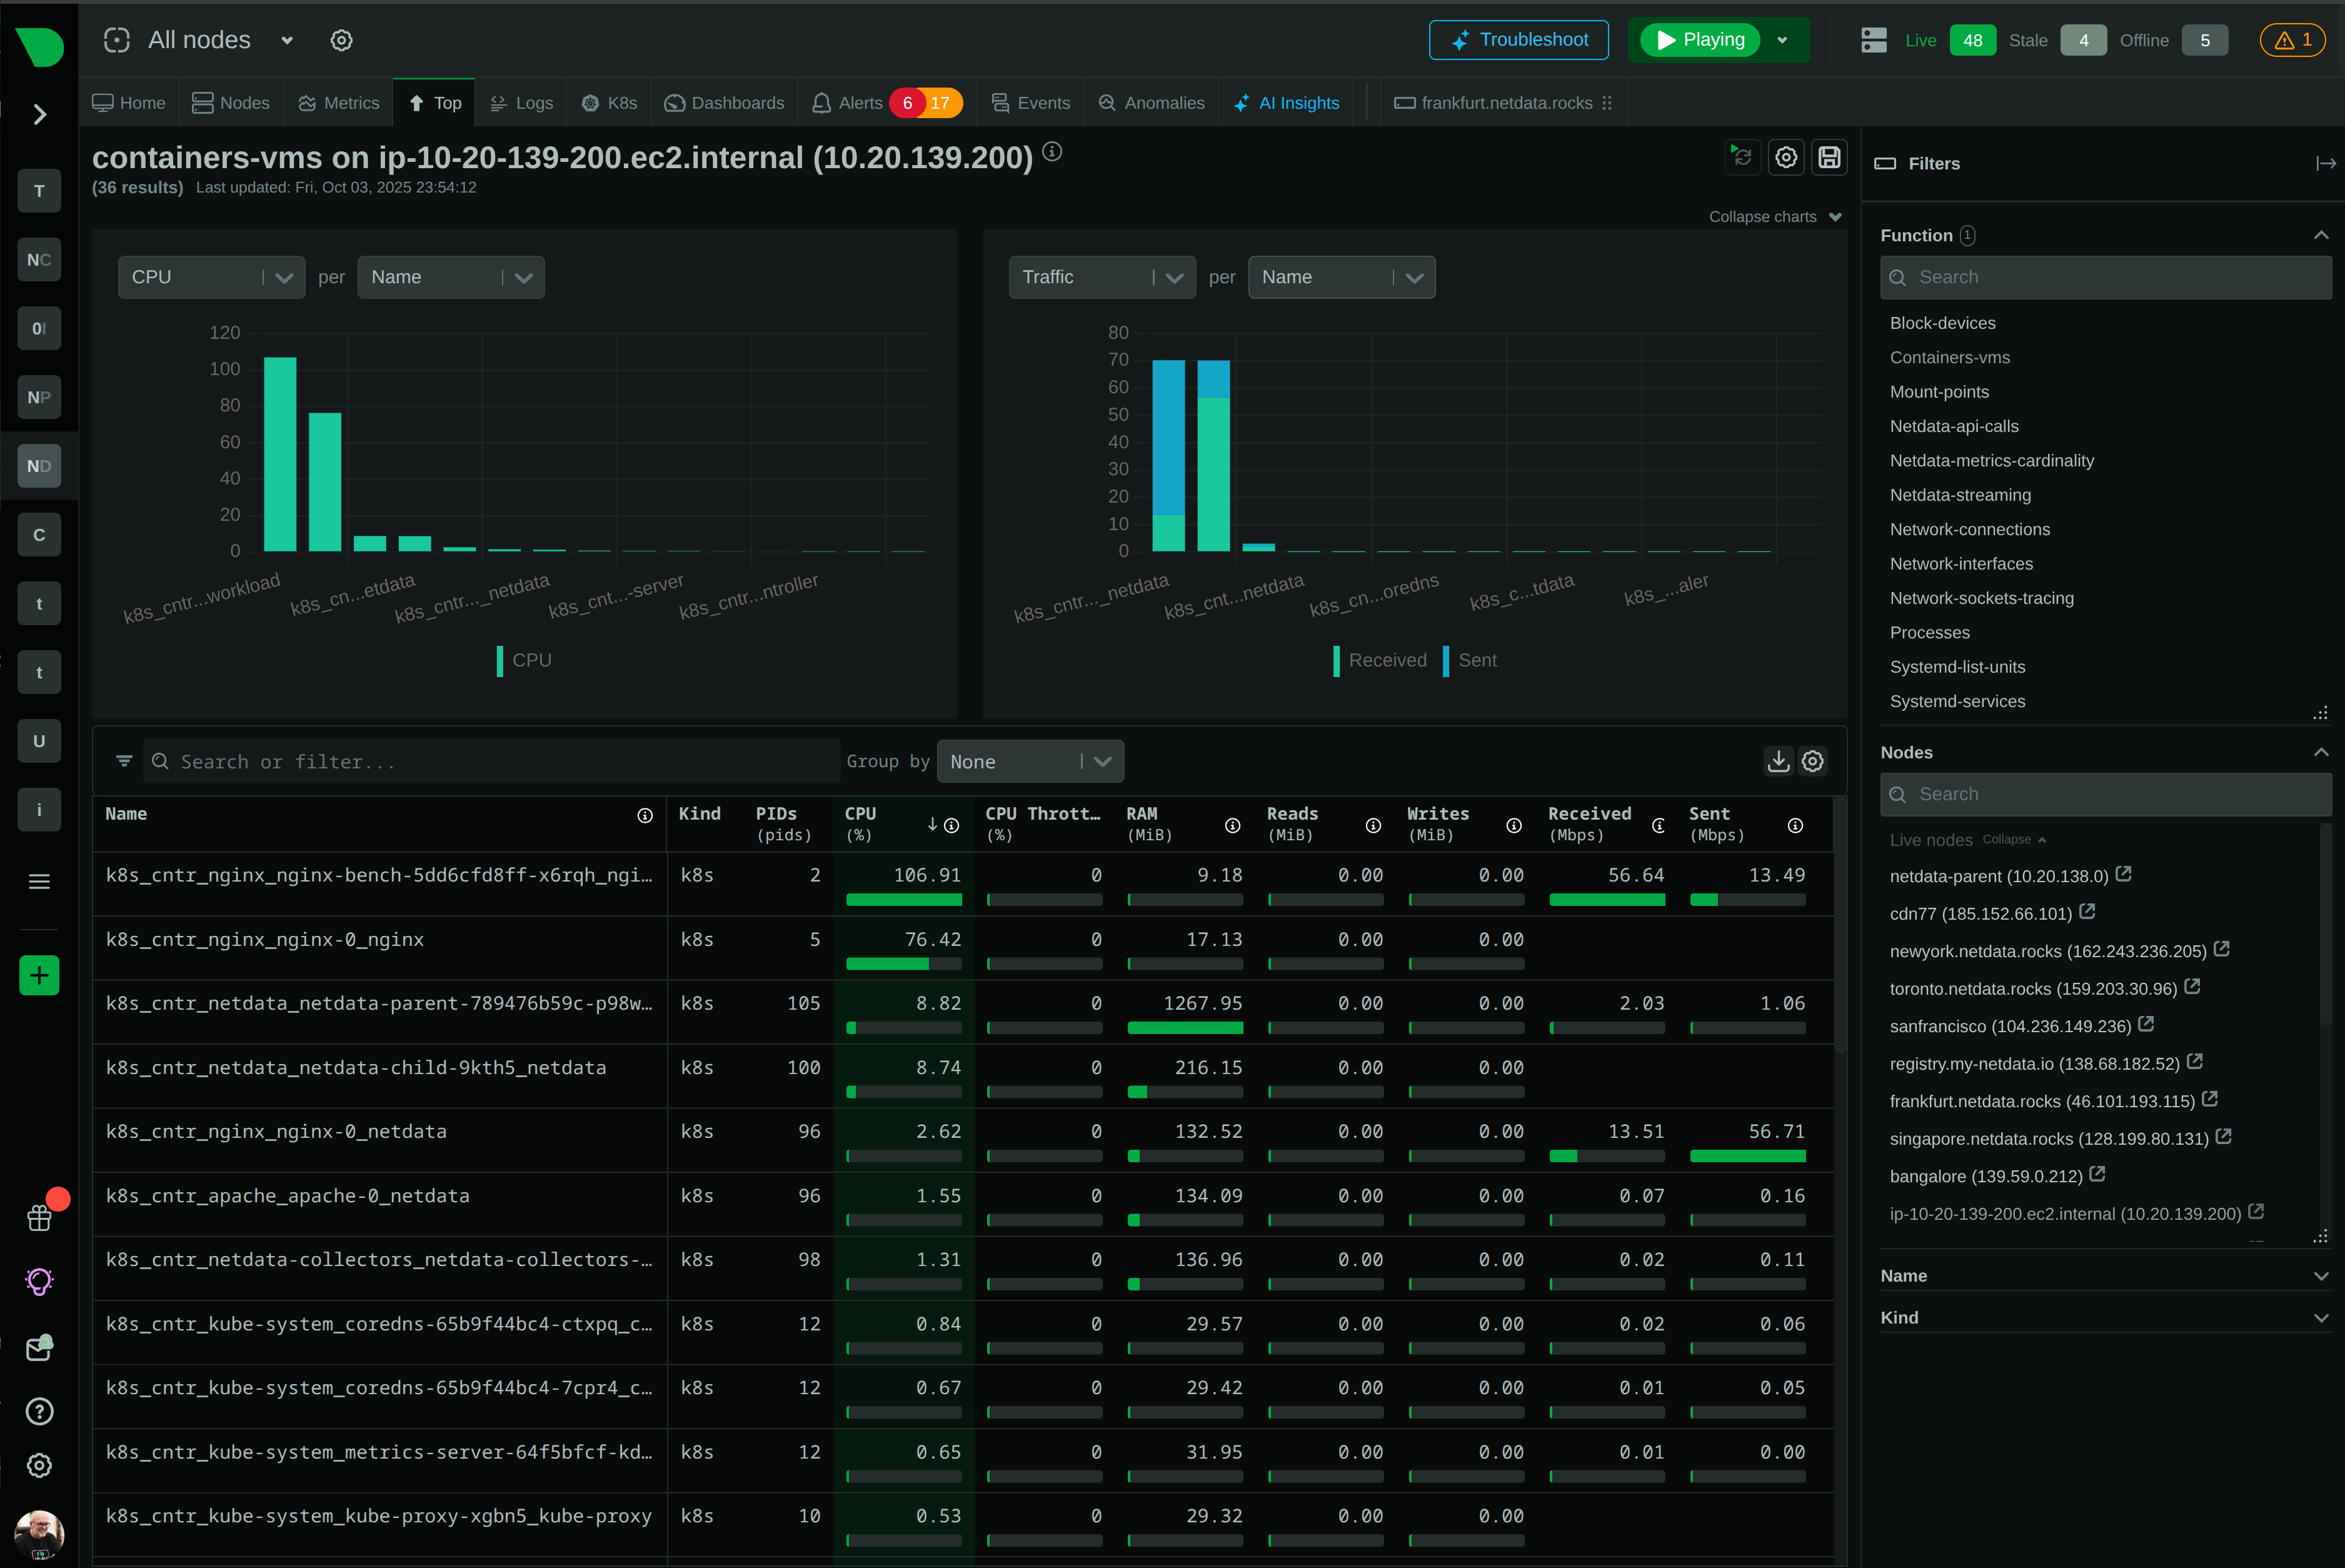
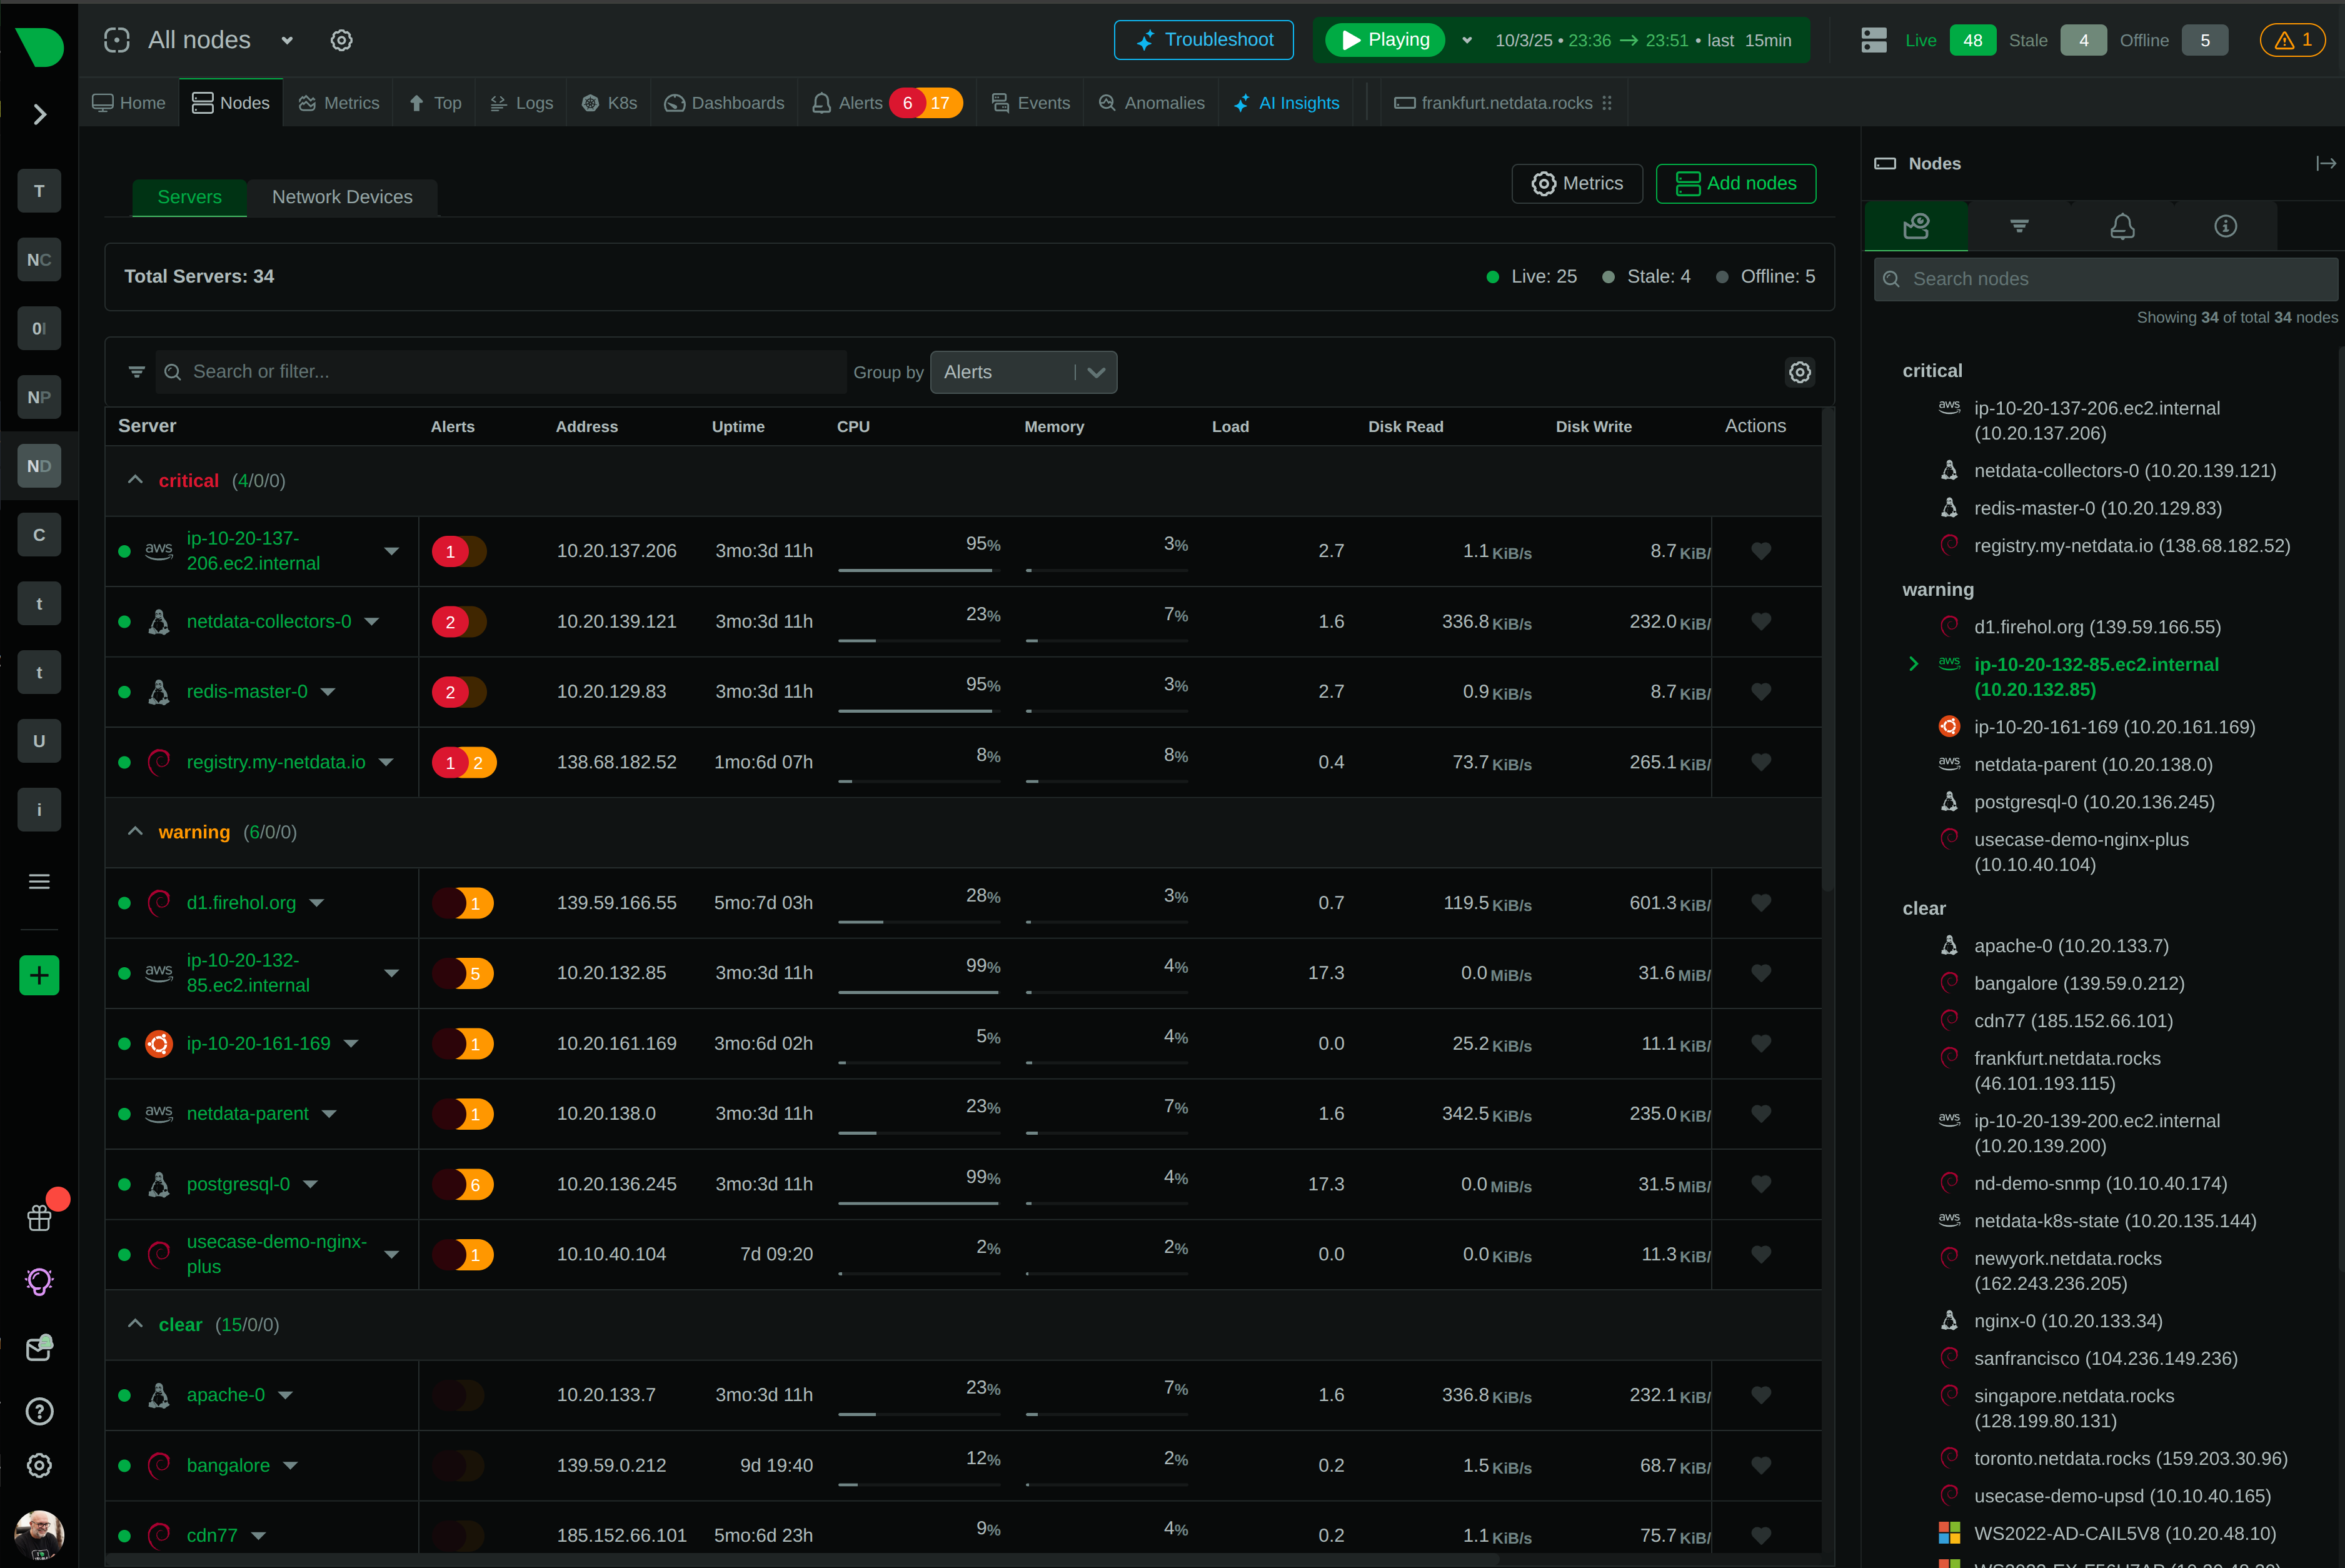
Unified Visibility Across Every Cloud, Every Second

Monitor AWS, Azure, GCP, and on-premises infrastructure through a single platform with per-second granularity, edge-native ML, and transparent pricing. Eliminate tool sprawl, surprise bills, and blind spots - while maintaining complete data sovereignty.

Background Hero

Why Teams Choose Netdata for Multi-Cloud

The only platform that unifies visibility without centralizing your data

True Real-Time Everywhere

Per-second metrics across all clouds with sub-2-second latency. Catch transient issues and microbursts invisible to minute-based monitoring.

Predictable Per-Node Pricing

Transparent per-node pricing with unlimited metrics, logs, and users. No surprise bills from data volume spikes or custom metrics taxation.

Same Agent, Every Cloud

Single binary works identically on AWS, Azure, GCP, VMware, and bare metal. No cloud-specific agents or fragmented tooling.

Edge-Native ML Intelligence

18 unsupervised models per metric train locally with 10^-36 false positive rate. Automatic anomaly detection without cloud dependencies.

Complete Data Sovereignty

All metrics and logs stay on your infrastructure. Netdata Cloud stores zero observability data - only metadata for unified dashboards.

Zero Configuration Setup

Install once, monitor everything. 800+ integrations auto-discover services across all clouds with dashboards appearing in 60 seconds.

Trusted by teams managing complex multi-cloud environments

Solve Multi-Cloud Monitoring Challenges

Eliminate Tool Sprawl and Context Switching

Stop juggling CloudWatch, Azure Monitor, GCP Stackdriver, Prometheus, and Grafana. Netdata provides unified metrics, logs, and alerts across all clouds through a single interface - reducing 10+ tools to one platform while maintaining per-second visibility everywhere.

10+ tools → 1 platform

See unified dashboards

Eliminate Tool Sprawl and Context Switching

Escape Unpredictable Costs and Billing Surprises

Traditional monitoring charges by data volume, creating 10-100× surprise bills when traffic spikes. Netdata’s per-node pricing with P90 billing excludes brief spikes and your top 3 days each month - delivering 90% cost reduction with complete predictability as you scale.

90% cost reduction

Compare pricing models

Escape Unpredictable Costs and Billing Surprises

Catch Issues Before They Cascade

Most operational anomalies last 2-10 seconds - invisible to 30-60 second monitoring. Netdata’s per-second collection with edge-native ML detects problems immediately, correlates them across clouds automatically, and surfaces root cause in the top 30-50 metrics - reducing MTTR by 80%.

80% faster MTTR

Explore AI troubleshooting

Catch Issues Before They Cascade

Simplify Kubernetes Across Clouds

Monitor EKS, AKS, GKE, and OpenShift with zero configuration. Netdata’s per-node billing means unlimited pods per node - no billing traps. Auto-discover all pods, containers, and services with <5% CPU overhead while maintaining per-second visibility into every resource.

Per-node, not per-pod

Learn about K8s monitoring

Simplify Kubernetes Across Clouds

How Netdata Compares

Multi-Cloud Monitoring: Netdata vs Traditional Solutions

See how Netdata’s edge-native architecture solves the fundamental challenges of multi-cloud observability

Capability

Netdata

Traditional Monitoring

Data Collection Granularity

✅ Per-Second
Catch 90% of incidents others miss

⚠️ 30-60 Seconds
Transient issues invisible in averages

Pricing Model

✅ Predictable Per-Node
Unlimited metrics, logs, and users included

❌ Per-Data Volume
Surprise bills from traffic spikes

Setup Complexity

✅ Zero Configuration
800+ integrations auto-discover in 60 seconds

⚠️ Manual Configuration
Weeks to configure collectors and dashboards

Tool Consolidation

✅ Single Platform
Metrics, logs, alerts unified interface

❌ 5-10 Tools
CloudWatch, Azure Monitor, Stackdriver, Prometheus, Grafana

Data Sovereignty

✅ 100% On-Premises
All data stays in your infrastructure

❌ Cloud Storage
Vendor custody of observability data

ML Anomaly Detection

✅ Edge-Native
18 models per metric, 10^-36 false positive rate

⚠️ Cloud-Based
Requires data egress and cloud processing

Kubernetes Billing

✅ Per-Node
Unlimited pods included per node

❌ Per-Pod
Misconfiguration increases bill 10×

Query Language

✅ Point-and-Click
NIDL framework, no PromQL required

⚠️ PromQL/SQL Required
Steep learning curve for analysis

Resource Efficiency

✅ <5% CPU, 150MB RAM
Independently validated most efficient

⚠️ 10-15% CPU, 500MB+ RAM
Higher overhead per monitored node

Storage Efficiency

✅ 0.6 Bytes/Sample
Years of data in gigabytes

⚠️ 4-8 Bytes/Sample
Terabytes required for same retention

Alert Accuracy

✅ Component-Level
400+ templates with intelligent thresholds

⚠️ Generic Thresholds
High false positive rates

Vendor Lock-In

✅ Open Source
GPLv3+, standard protocols, data portability

⚠️ Proprietary
Custom formats, migration barriers

See detailed comparison →

Multi-Cloud Capabilities

Native AWS Monitoring

Monitor EC2, ECS, EKS, Lambda, RDS, and CloudWatch metrics with auto-discovery. Same agent across all AWS services with per-second visibility and zero configuration.

Unified visibility across all AWS services

Explore AWS monitoring
AWS Dashboard

Key Multi-Cloud Features

Everything you need for unified observability across clouds

The Multi-Cloud Monitoring Challenge

Traditional monitoring creates complexity and cost spirals in multi-cloud environments

Tool Sprawl

CloudWatch + Azure Monitor + Stackdriver + Prometheus + Grafana

Context Switching Nightmare

Engineers juggle 5+ dashboards to debug single request

Volume-Based Pricing

Charged per metric, per log, per custom dimension

10-100× Surprise Bills

Traffic spikes create unpredictable costs

Minute-Level Granularity

30-60 second collection intervals hide problems

90% Incidents Invisible

Transient issues averaged away in aggregation

Centralized Architecture

All data shipped to cloud backends for processing

Exponential Scaling Costs

Infrastructure and egress charges multiply with scale

Manual Configuration

Weeks to configure collectors, dashboards, alerts

Delayed Time to Value

Blind spots during critical deployment phases

Frequently Asked Questions