The only agent that thinks for itself
Autonomous Monitoring with self-learning AI built-in, operating independently across your entire stack.

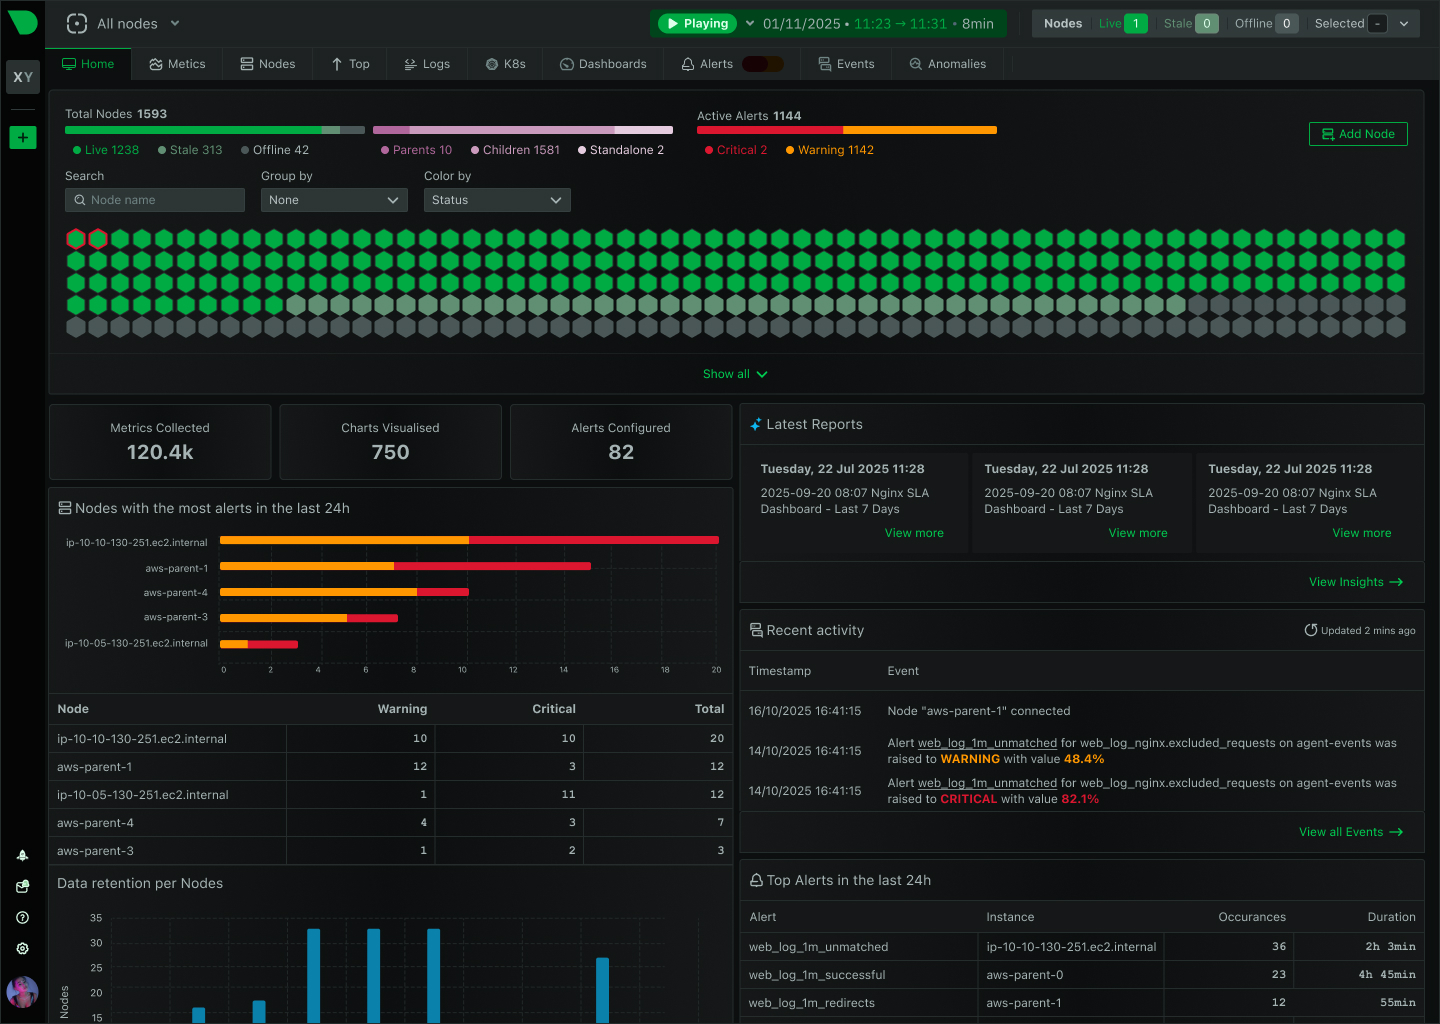
Centralized metrics streaming and storage
Aggregate metrics from multiple agents into centralized Parent nodes for unified monitoring across your infrastructure.
Fully managed cloud platform
Access your monitoring data from anywhere with our SaaS platform. No infrastructure to manage, automatic updates, and global availability.
Deploy Netdata Cloud in your infrastructure
Run the full Netdata Cloud platform on-premises for complete data sovereignty and compliance with your security policies.
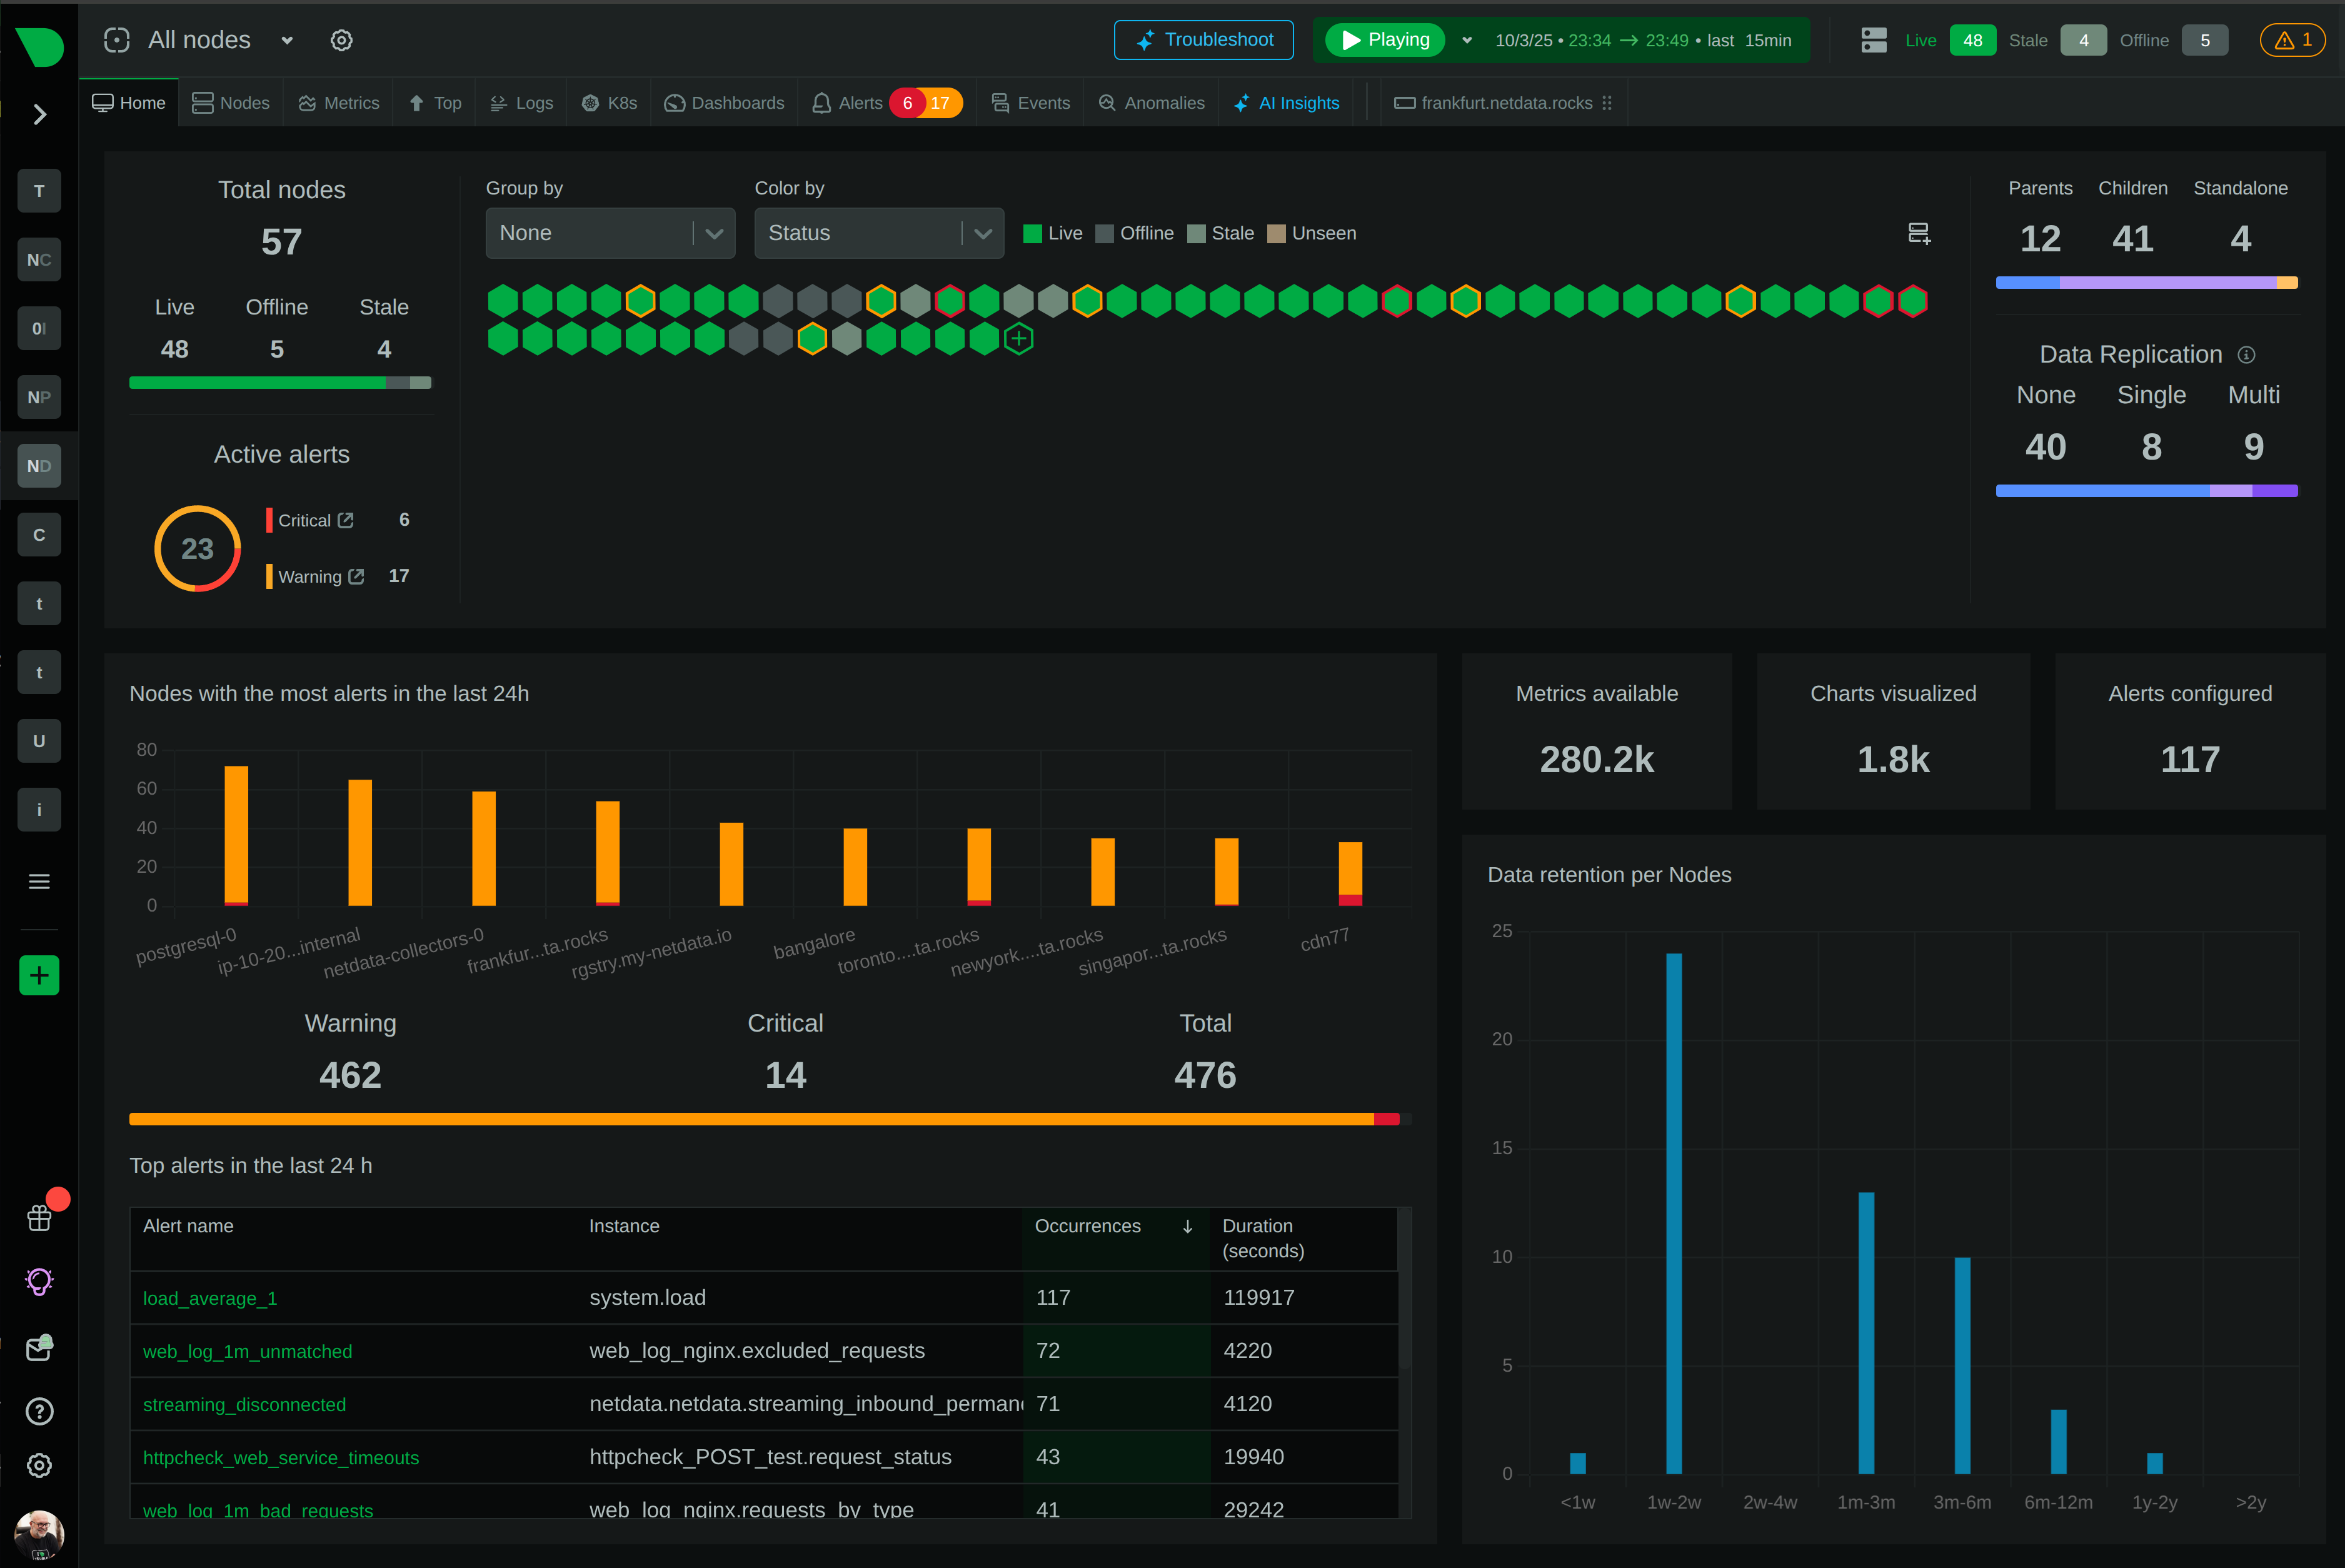
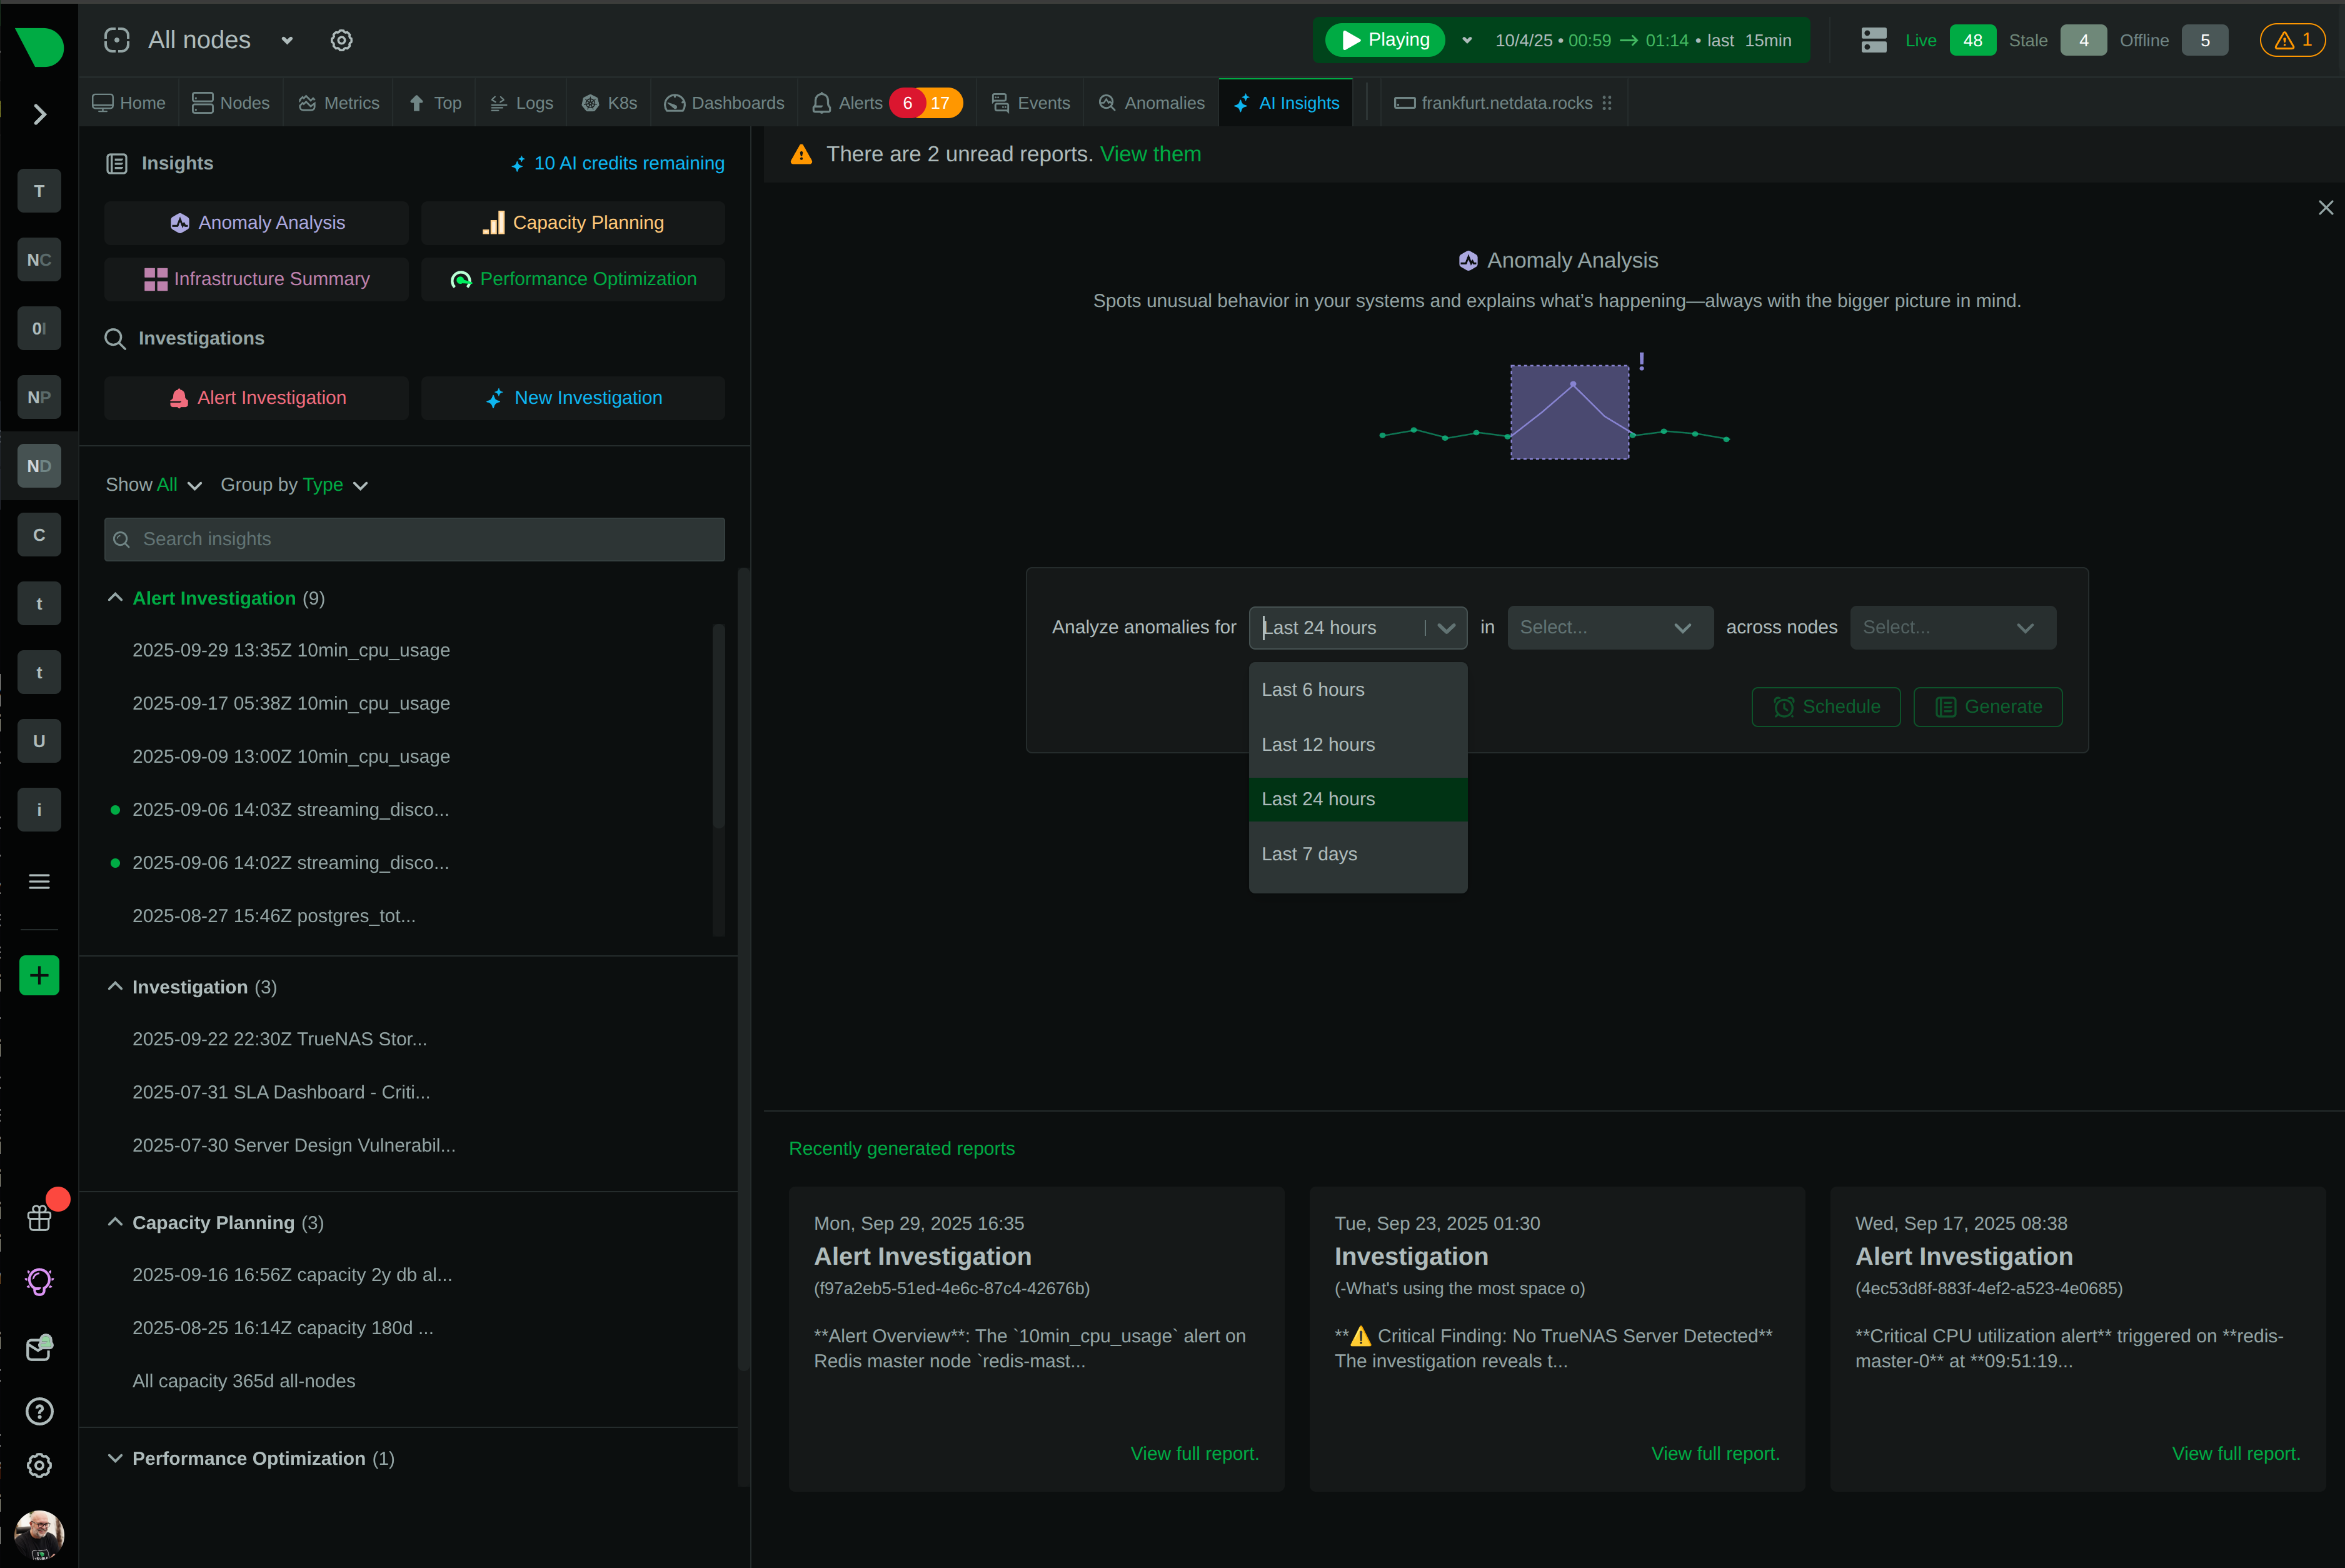
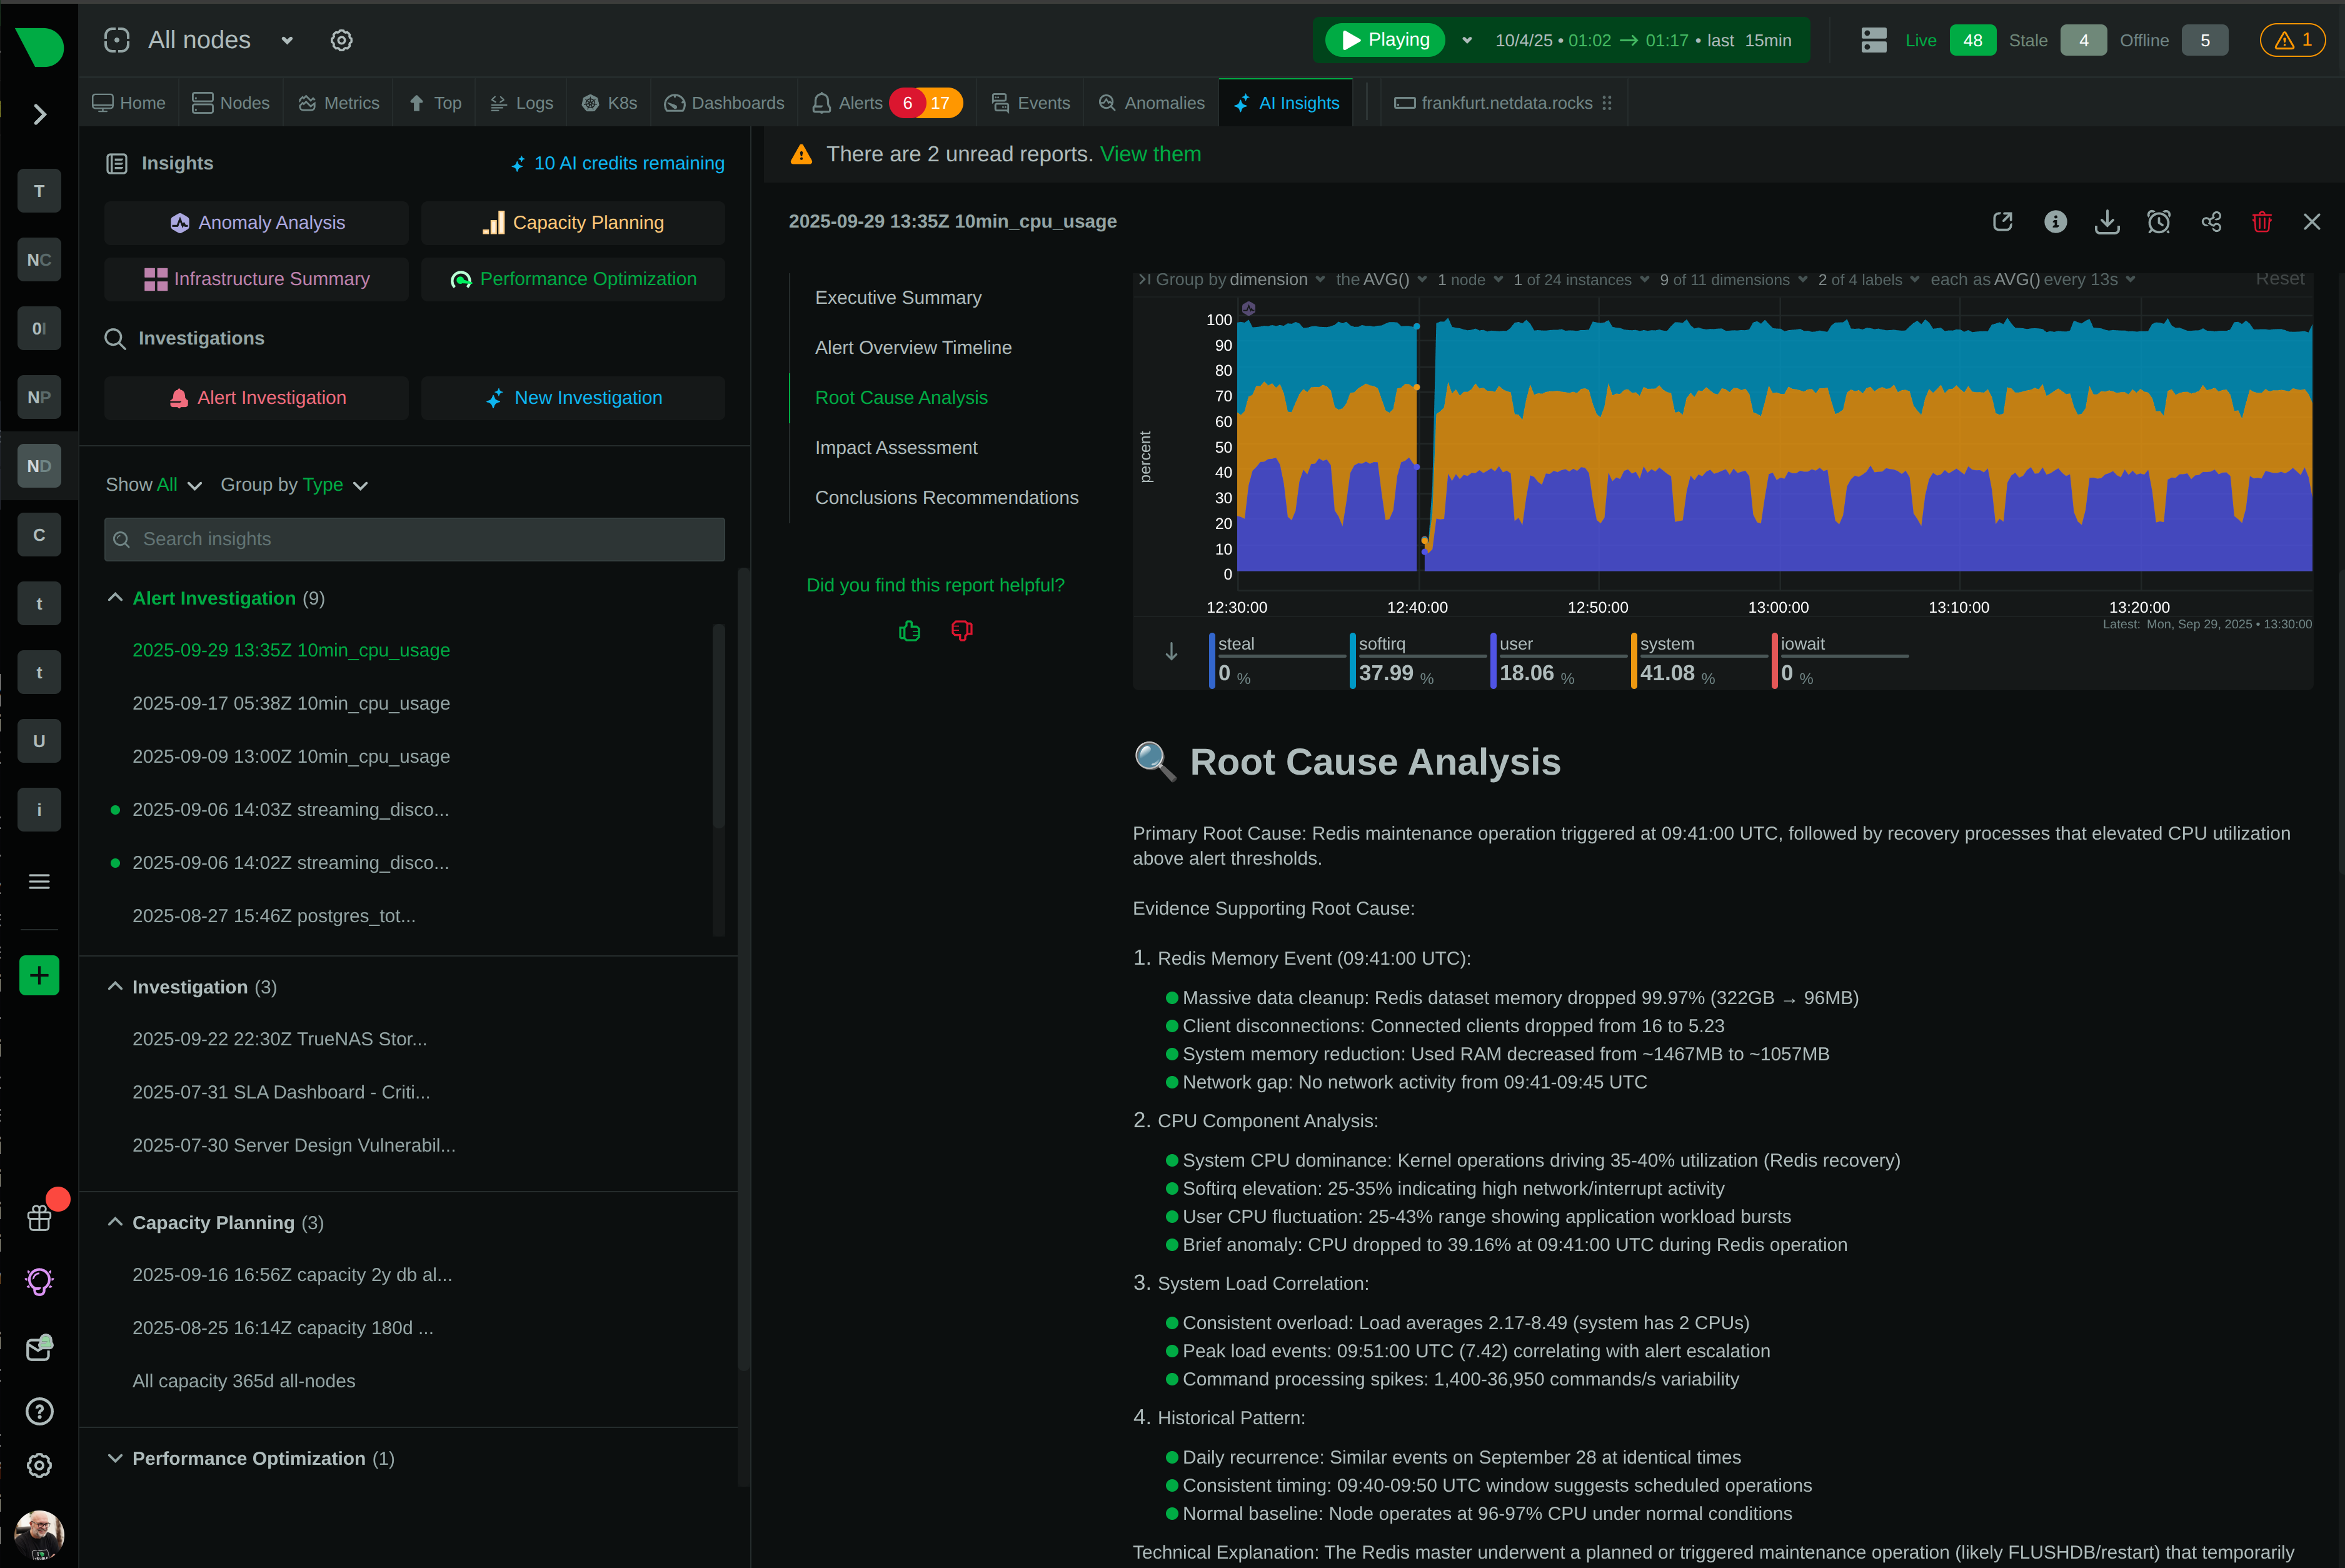
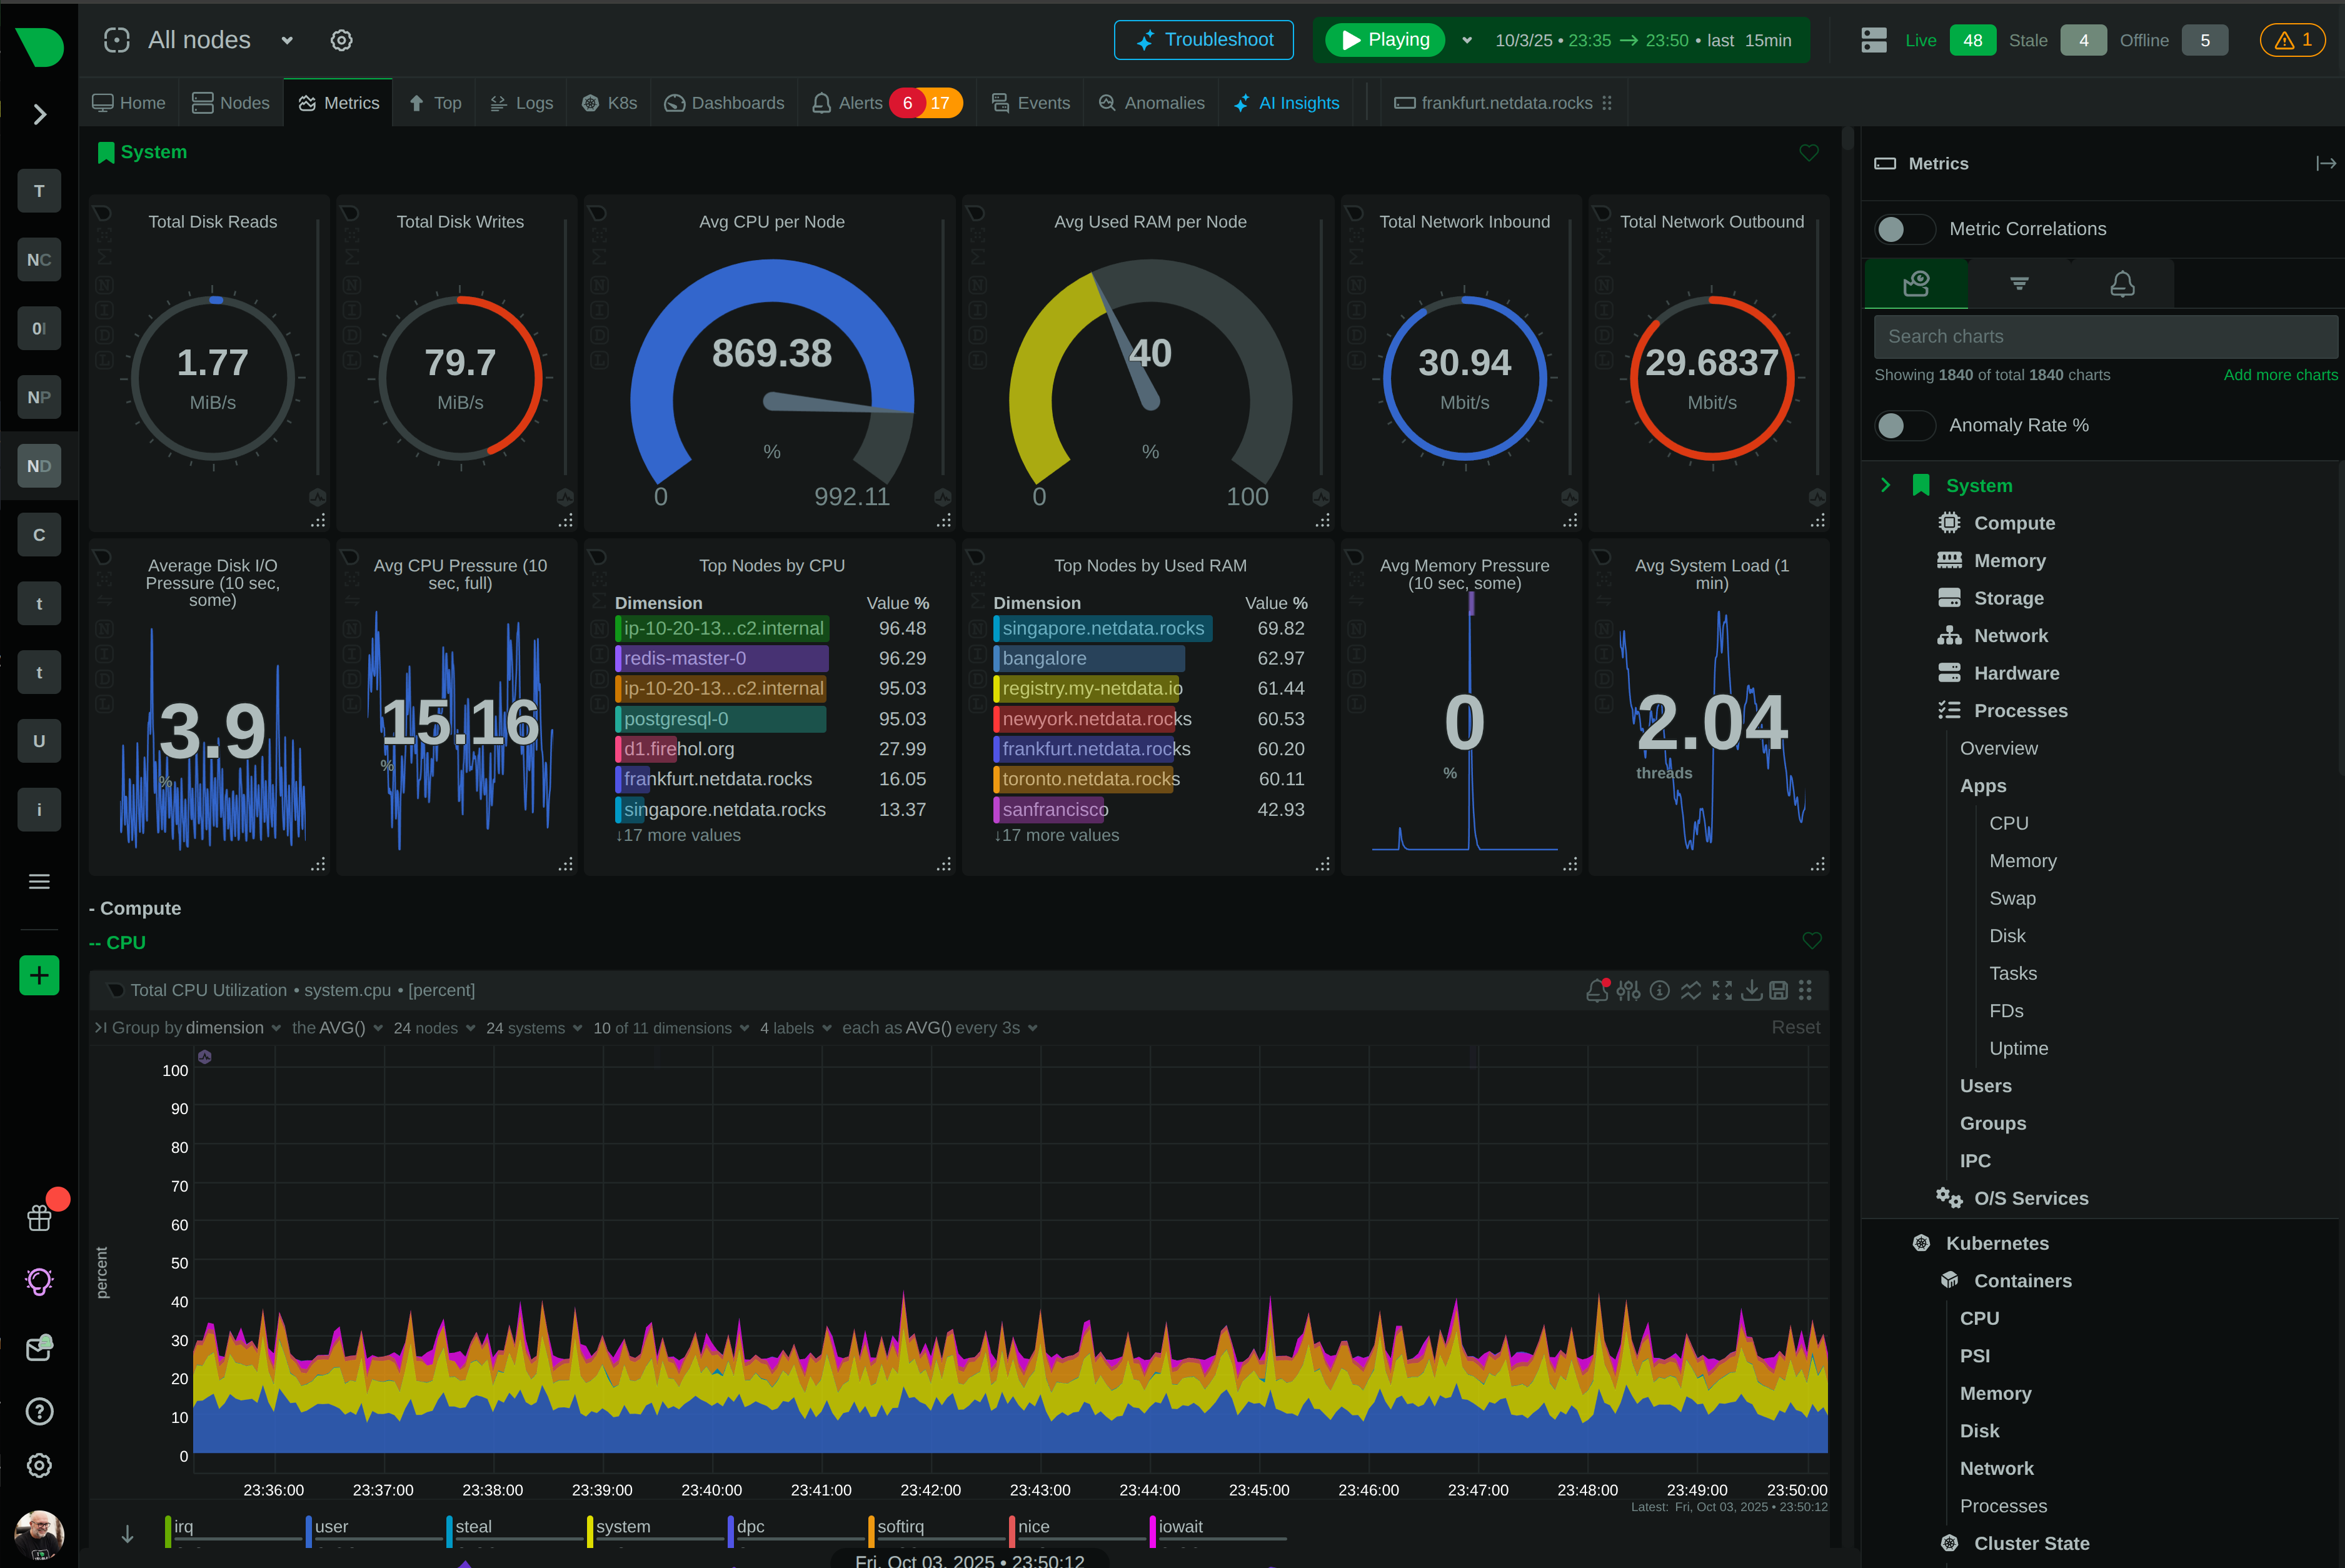
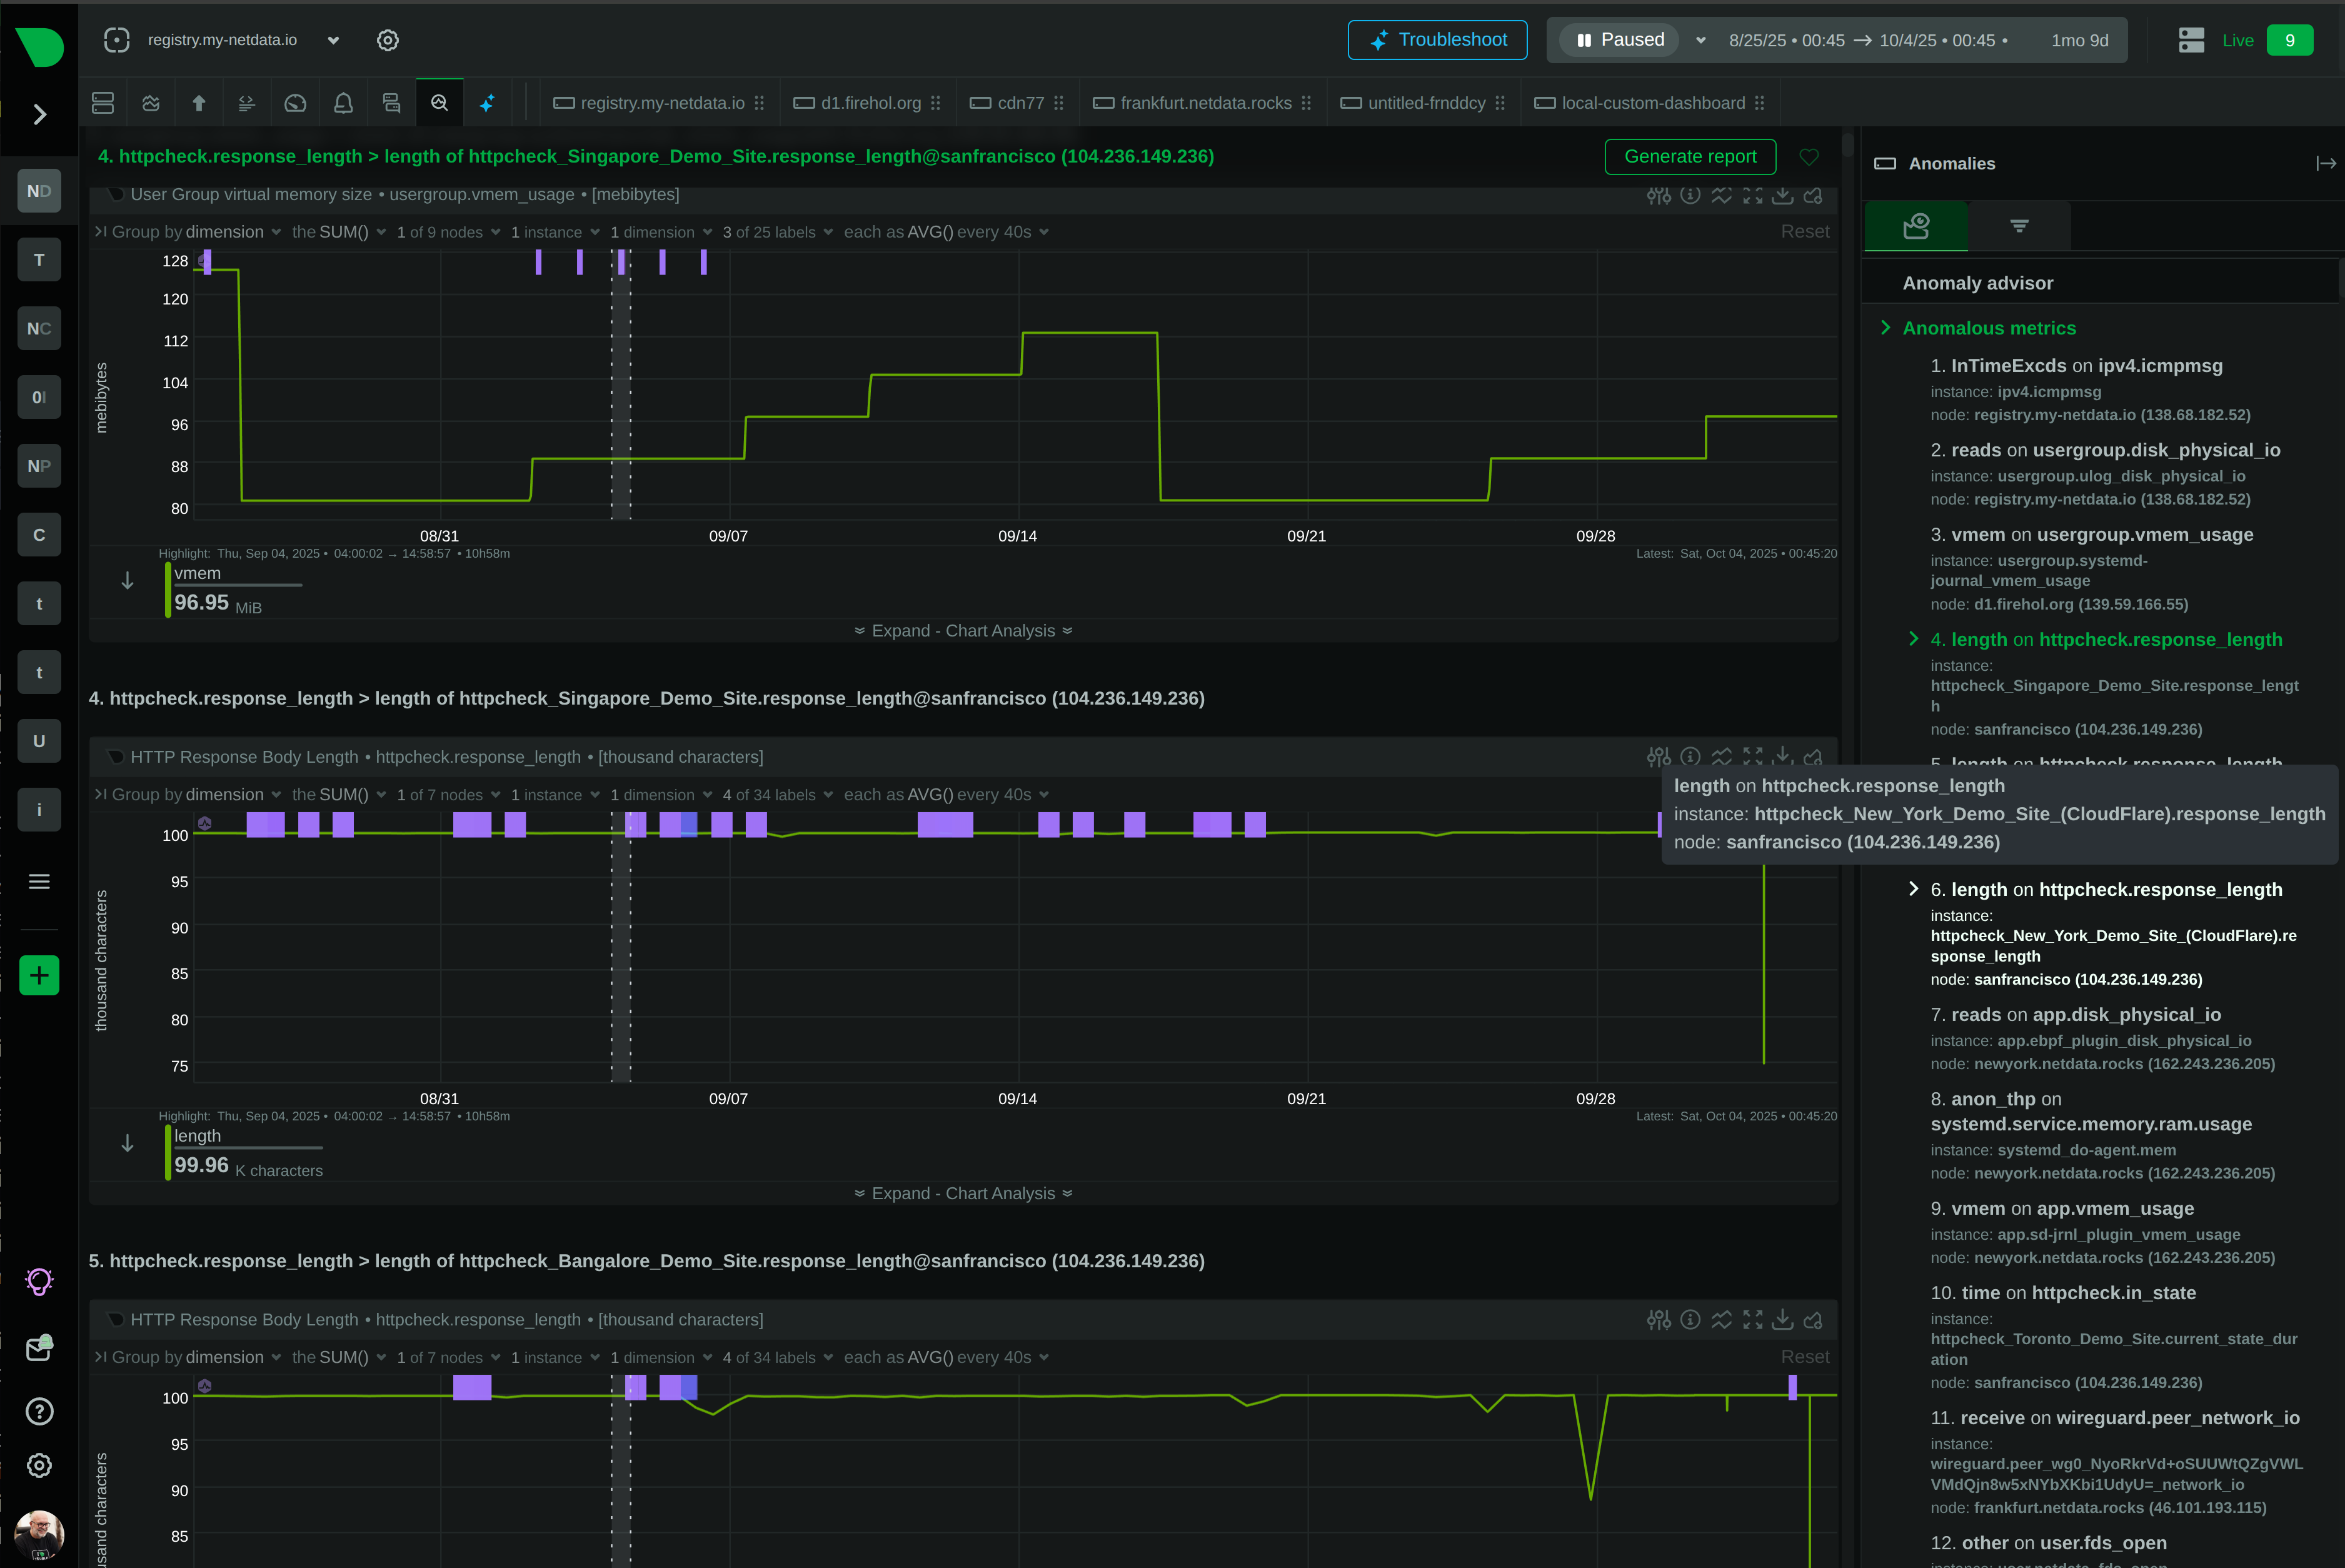
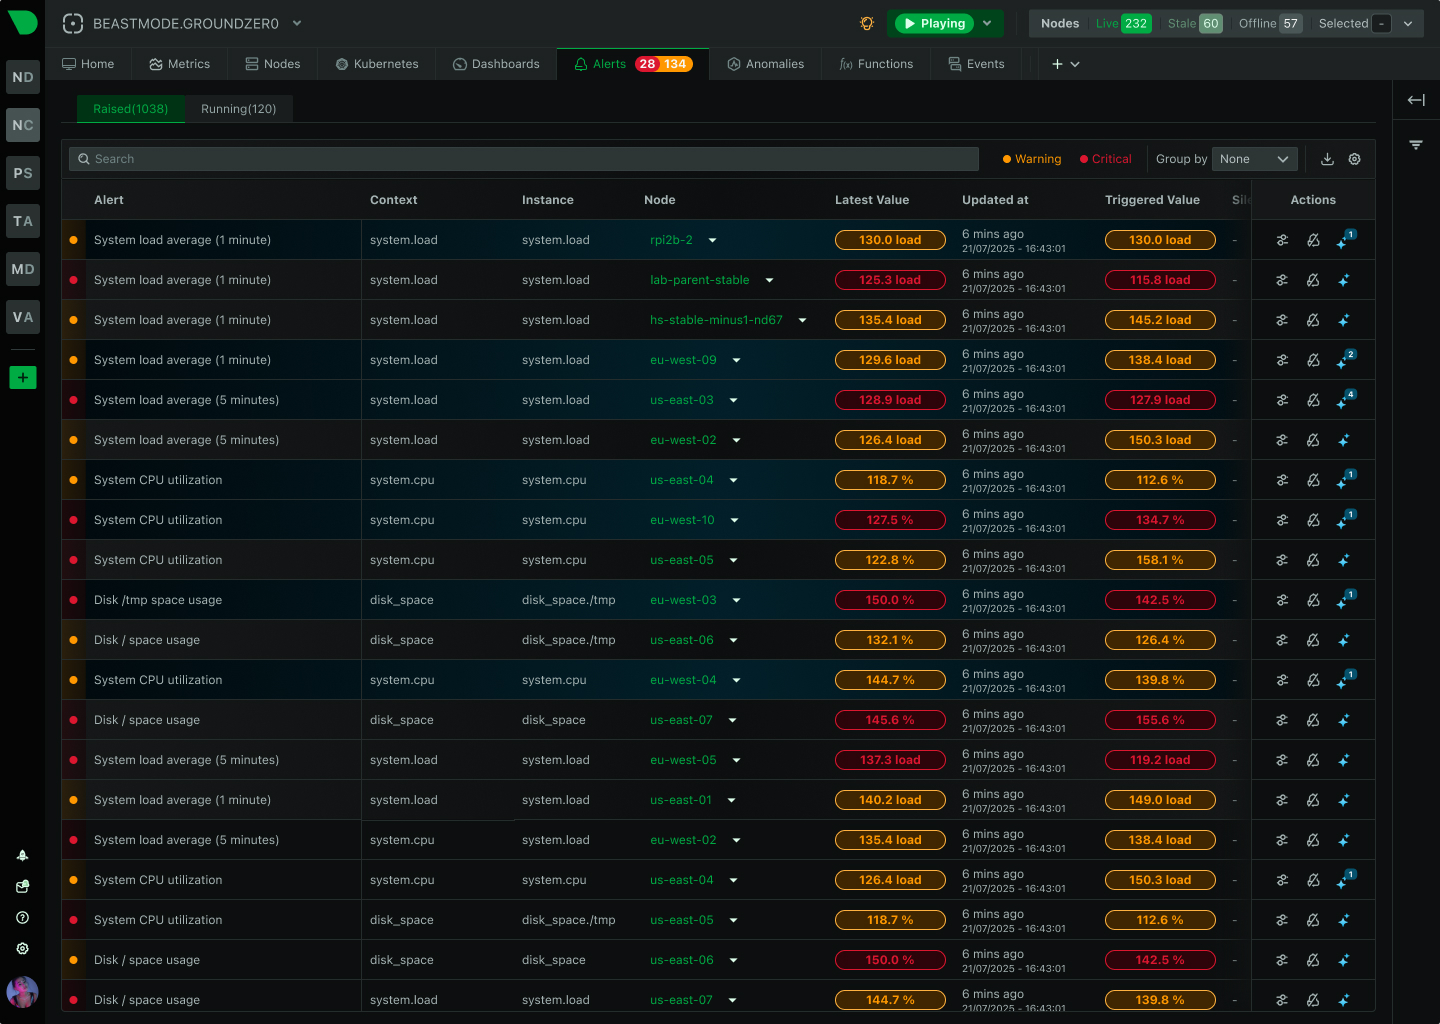
Powerful, intuitive monitoring interface
Modern, responsive UI built for real-time troubleshooting with customizable dashboards and advanced visualization capabilities.
Monitor on the go
Native iOS and Android apps bring full monitoring capabilities to your mobile device with real-time alerts and notifications.
The future of infrastructure observability
See our strategic direction across AI-native observability, full-stack signals, operational intelligence, and enterprise platform maturity.
Best energy efficiency
True real-time per-second
100% automated zero config
Centralized observability
Multi-year retention
High availability built-in
Zero maintenance
Always up-to-date
Enterprise security
Complete data control
Air-gap ready
Compliance certified
Millisecond responsiveness
Infinite zoom & pan
Works on any device
Native performance
Instant alerts
Monitor anywhere
AI-native observability
Continuous delivery
Open source foundation

80% Faster Incident Resolution
True Real-Time and Simple, even at Scale
90% Cost Reduction, Full Fidelity
See and Map Your Entire Network
Single Pane of Glass
Control Without Surrender
Integrations
800+ collectors and notification channels, auto-discovered and ready out of the box.
Connect any MCP-compatible AI to your observability data. Automate workflows, playbooks, and incident response.
AWS, GCP, Azure—unified observability across all providers.
On-prem and cloud infrastructure in a single view.
Your metrics stay on your infrastructure. Always.
Reduced monitoring costs by 46% while cutting staff overhead by 67%.
— Leonardo Antunez, Codyas
No data shipping. No central storage costs. Query at the edge.
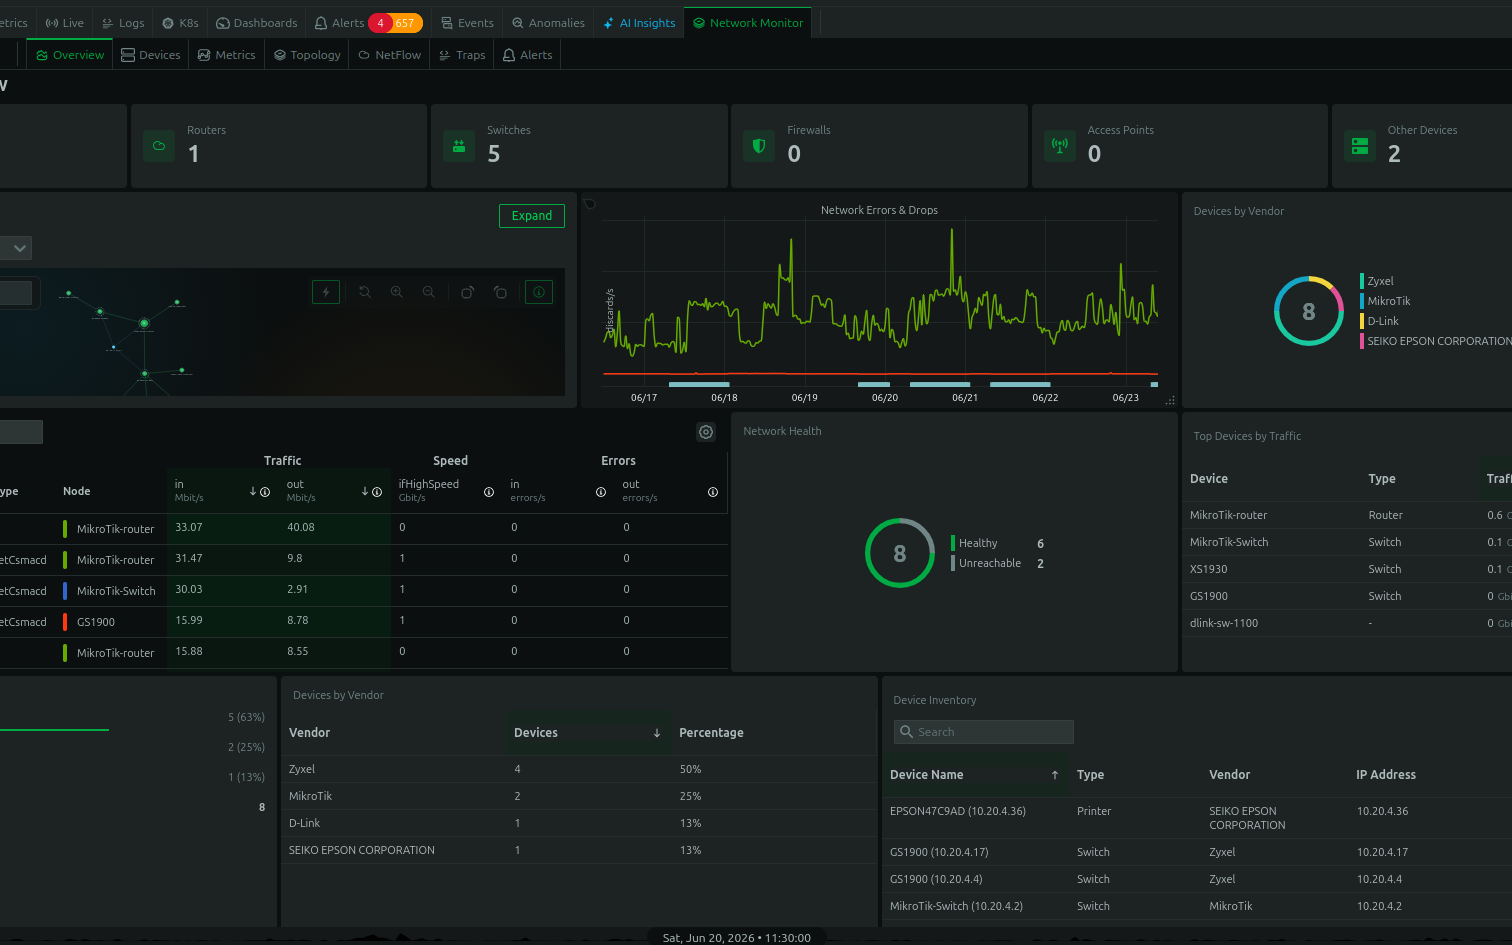
Real-time connection and device maps, built in the agent — no scheduled discovery scans.
SNMP, flows, traps, and topology unified with your full-stack observability.
So many out-of-the-box features! I mostly don't have to develop anything.
— Simon Beginn, LANCOM Systems
Point-and-click troubleshooting. No PromQL, no LogQL, no learning curve.
Enterprise efficiency without enterprise complexity—real ROI from day one.
Zero data egress. Only metadata reaches the cloud. Your metrics stay on your infrastructure.
Auto-discovered and configured. No manual setup required.
Slack, PagerDuty, Teams, email, webhooks—all built-in.
Built for the People Who Get Paged
Every Industry Has Rules. We Master Them.
Monitor Any Technology. Configure Nothing.
Complete Visibility. Total Control.
Don't Take Our Word for It
Government
Falkland Islands Government
99% less downtime, 30% cloud cost reduction
Transportation
TMB Barcelona
"A rare unicorn that obeys the Pareto rule"
Gaming
Nodecraft
Troubleshooting in 30 seconds, not 3 minutes
Technology
Codyas
46% cost reduction, 67% less monitoring staff
Netdata gives more than you invest in it. A rare unicorn that obeys the Pareto rule.
— Eduard Porquet Mateu, TMB Barcelona
Reduced website downtime by 99% and cloud bill by 30% using Netdata alerts.
— Falkland Islands Government
Optimized resource allocation based on Netdata alerts cut cloud spending by 30%.
Reduced monitoring staff by 67% while cutting operational costs by 46%.
— Codyas
Netdata has agent capacity or a plugin for everything, including Windows and Kubernetes.
From 2-3 minutes to 30 seconds—instant visibility into any node issue.
— Matthew Artist, Nodecraft
20% less downtime and 40% budget optimization from out-of-the-box monitoring.
Pay per Node. Unlimited Everything Else.
One price per node. Unlimited metrics, logs, users, and retention. No per-GB surprises.
What's Your Monitoring Really Costing You?
Most teams overpay by 40-60%. Let's find out why.
Your Infrastructure Is Unique. Let's Talk.
Because monitoring 10 nodes is different from monitoring 10,000.
Monitoring That Sells Itself
Deploy in minutes. Impress clients in hours. Earn recurring revenue for years.
Per-Second Metrics at Homelab Prices
Same engine, same dashboards, same ML. Just priced for tinkerers.
$1,000 Per Referral. Unlimited Referrals.
Your colleagues get 10% off. You get 10% commission. Everyone wins.
"Netdata's significant positive impact" — LANCOM Systems
Compare vs Datadog, Grafana, Dynatrace
"Cut costs by 46%, staff by 67%" — Codyas
"Reduced cloud bill by 30%" — Falkland Islands Gov
"Better observability with Netdata than combining other tools." — TMB Barcelona
DPA, SLAs, on-prem, volume pricing
One command, 30 seconds, real data—no sandbox needed
Auto-config + per-node pricing = predictable profit
8-episode Netdata tutorial by LearnLinux.tv
3rd most starred monitoring project
Customers report 40-67% cost cuts, 99% downtime reduction
Free tier lets them try before they buy
AI Support Assistant, Available 24/7
Nedi has access to all official documentation, source code, and resources. Ask any question about Netdata—responds in your language.
Engineering Insights & Product Updates
Jul 2026
Native macOS Monitoring: Logs, Sensors, …
We’ve overhauled macOS monitoring in …
Jun 2026
Fleet Observability: Linux Edge Device …
It feels less like managing devices and more …
Real Time Network Monitoring: Topology, …
Interface counters tell you a port is busy. …
5 Best SolarWinds Alternatives for 2026
As organizations modernize their …
Never Fight Fires Alone
Docs, community, and expert help—pick your path to resolution.
60 Seconds to First Dashboard
One command to install. Zero config. 850+ integrations documented.
Level Up Your Monitoring
76,000+ Engineers Strong
Per-Second. 90% Cheaper. Data Stays Home.
See why teams switch from Datadog, Prometheus, Grafana, and more.
Trace issues directly in the source code
Get architecture recommendations
Real-time operational status, incident history, and uptime for all Netdata Cloud services.
Copy, paste, monitoring in 60 seconds
Every collector documented
PostgreSQL, NGINX, K8s, and more
Maturity model and implementation
76k+ stars and growing daily
Engineers helping engineers
Netdata is modern, fast, full-stack observability with per-second metrics, AI-powered troubleshooting, and predictable pricing.
One of the most popular open-source monitoring projects
Enterprise-grade security and compliance
Your metrics stay on your infrastructure
"Most energy-efficient monitoring solution" — ICSOC 2023, peer-reviewed
"Doesn't miss alerts—mission-critical trust for safety software"
Global community improving monitoring for everyone
Trusted by teams worldwide
Free forever, fully open source agent
Work from anywhere, async-friendly culture
Your work helps millions of systems
March 4–5, London, UK
February 13, Bengaluru, India
November 17–19, Las Vegas
Pricing, volume discounts, and enterprise needs
Docs, community, and expert help
Continuous compliance monitoring by Drata. View our live security posture and audit reports.
Explore Netdata's product roadmap and strategic direction. See how we're investing in AI-native observability, full-stack signal coverage, operational intelligence, and enterprise platform maturity.
Netdata’s AI Co-Engineer delivers instant expert-level analysis, 99% noise reduction, and predictable per-node pricing with full data control. Read more!
Turn observability data into strategic intelligence with automated summaries, forecasts, and AI-driven incident analysis from Netdata. Read more now!
Netdata delivers real-time AIOps with per-second insights, edge-native ML, and AI-driven root cause analysis without configuration or surprises. Read more!
Get instant, automated infrastructure visibility with per-second metrics, built-in ML, and zero manual configuration for any environment. Read more now!
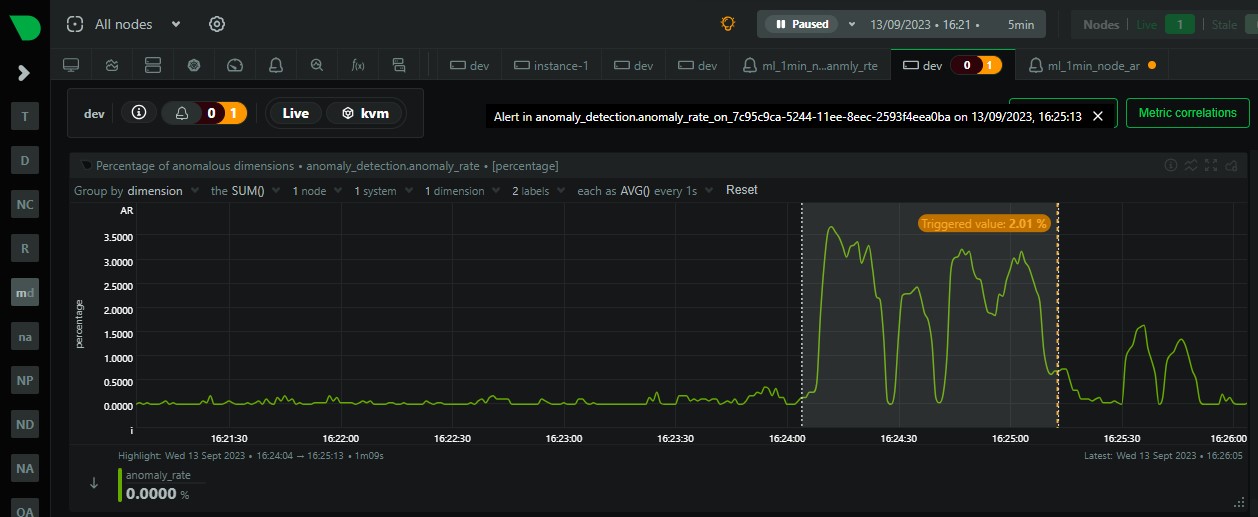
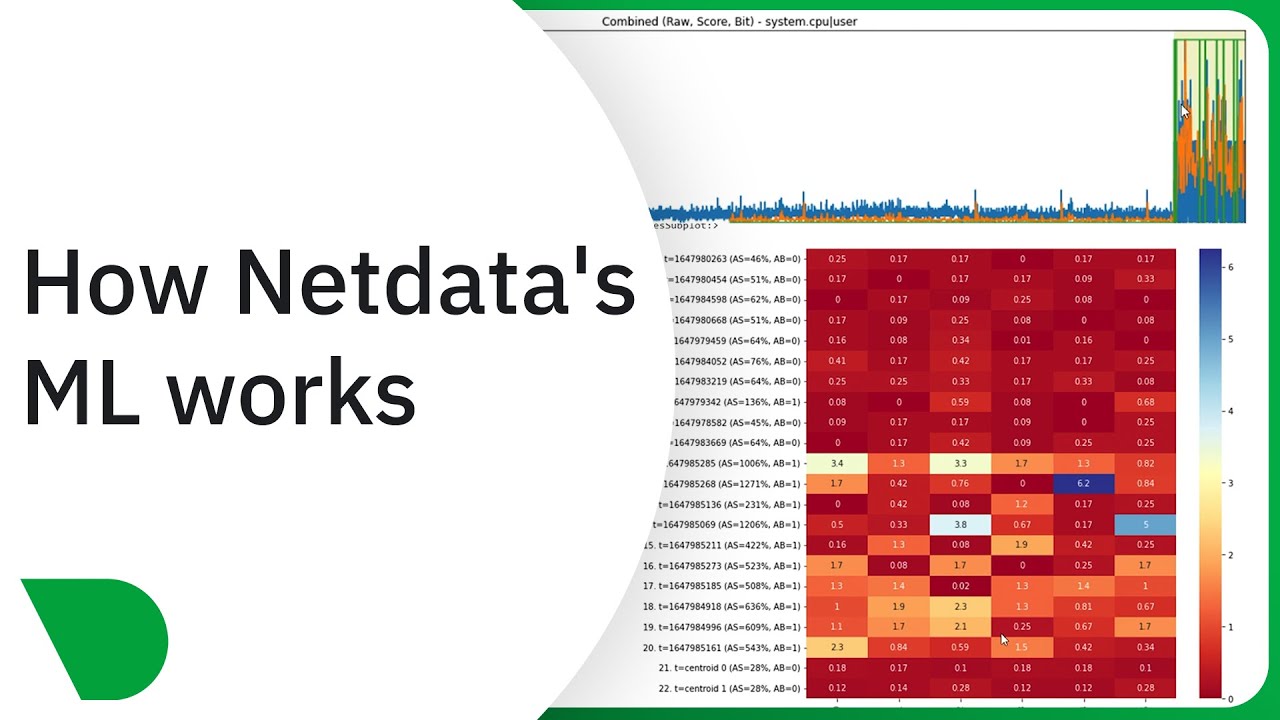
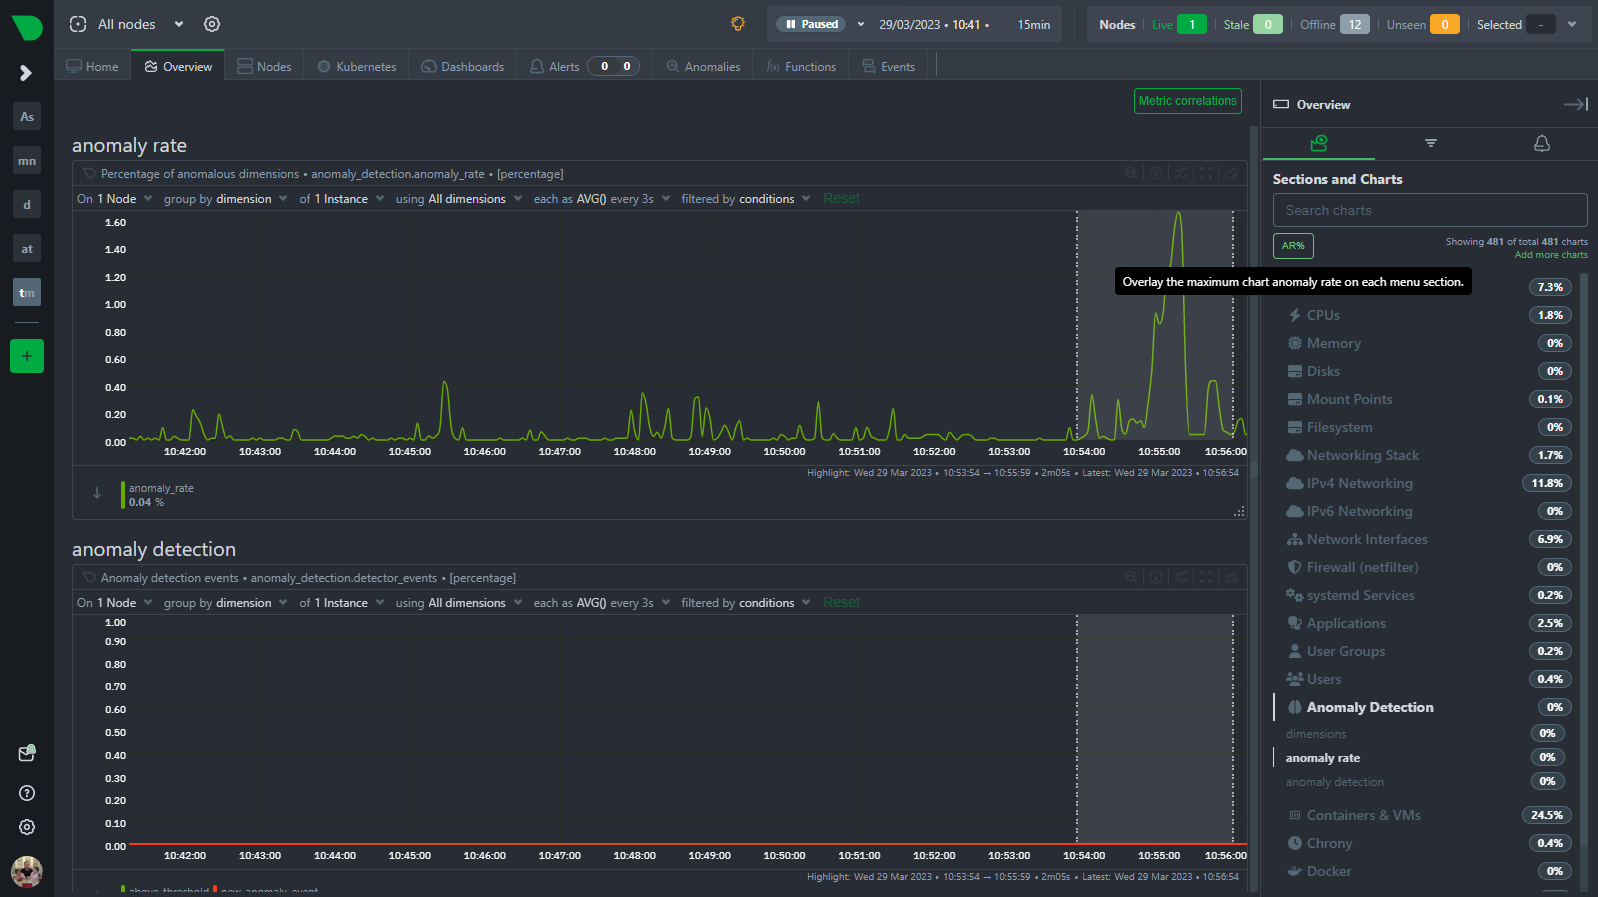
Netdata’s Anomaly Advisor detects issues in seconds with 18-model ML, sub-2-second analysis, and precise root-cause insights for any scale. Read more now!
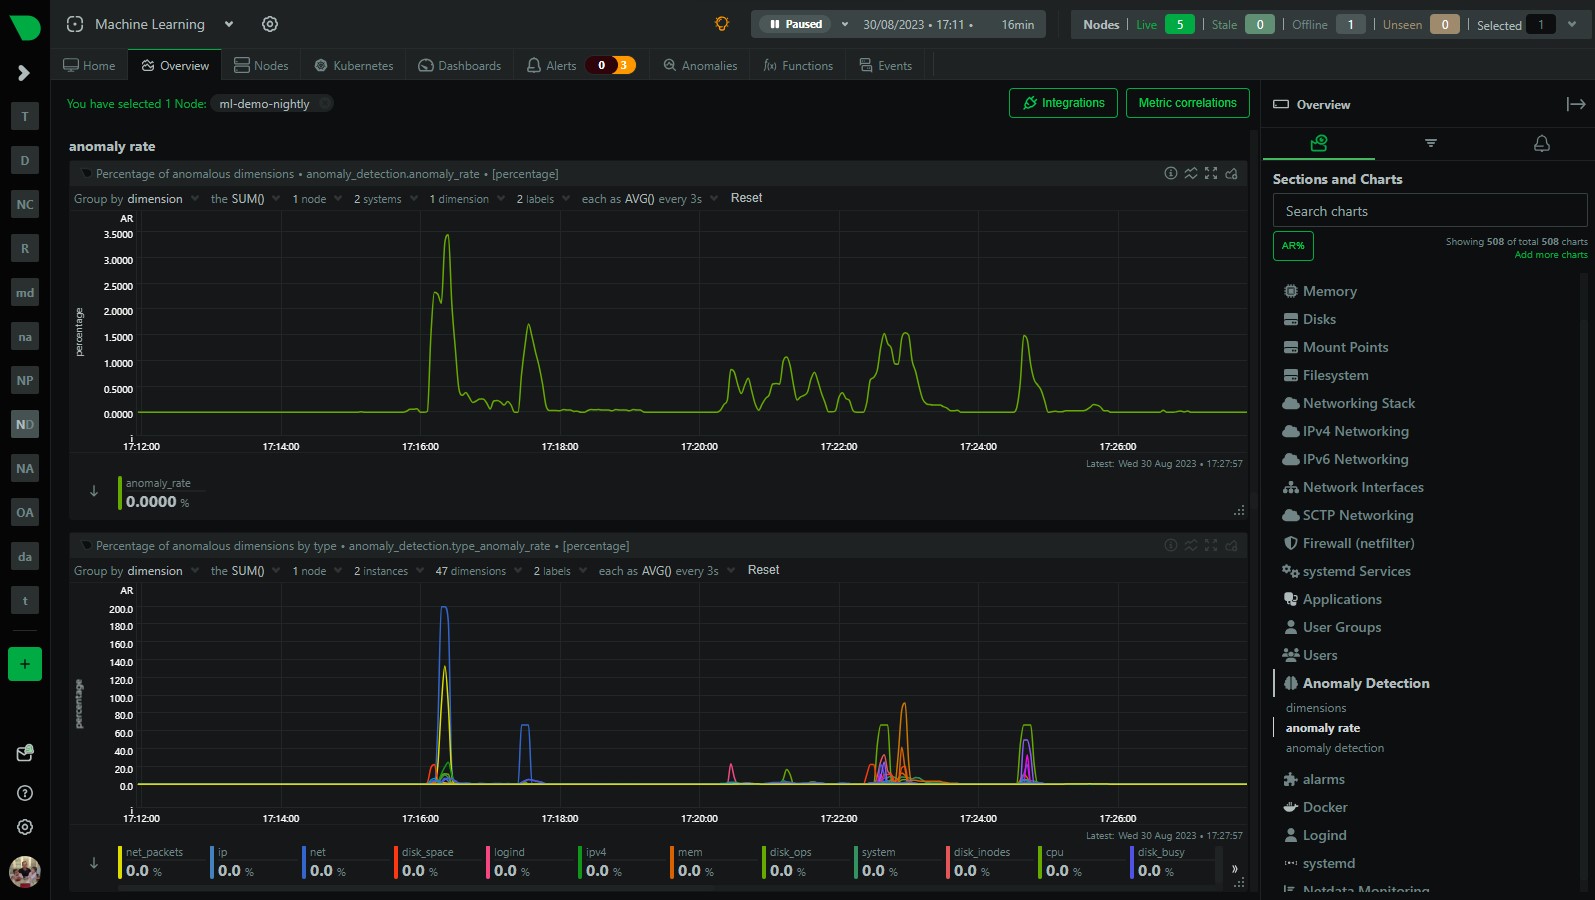
Detect metric anomalies in real time with zero-configuration, edge-based machine learning and 18-model consensus that reduces false positives by 99%.
Reduce false positives by 99% with Netdata’s zero-config, edge-based ML for real-time anomaly detection and faster root cause analysis. Read more now!
Netdata Mobile delivers actionable alerts so on-call engineers resolve incidents faster. Book a demo!
Slash MTTR by 80% with Netdata's per-second visibility, ML-powered anomaly detection, and AI-driven root cause analysis. From incident to insight in seconds.
Detect anomalies instantly, surface root cause fast, and troubleshoot with grounded AI that never guesses. Modern RCA starts here. Read more now!
Boost team collaboration with real-time visibility, intelligent alerts, and secure multi-tenancy. See how Netdata accelerates incident response. Read more!
Netdata Cloud delivers real-time observability, zero data replication, AI-driven analysis, and predictable per-node pricing for enterprises. Book a demo!
Ensure operational continuity with autonomous agents, automatic failover, and ML-powered anomaly detection for real-time deployments. Read more now!
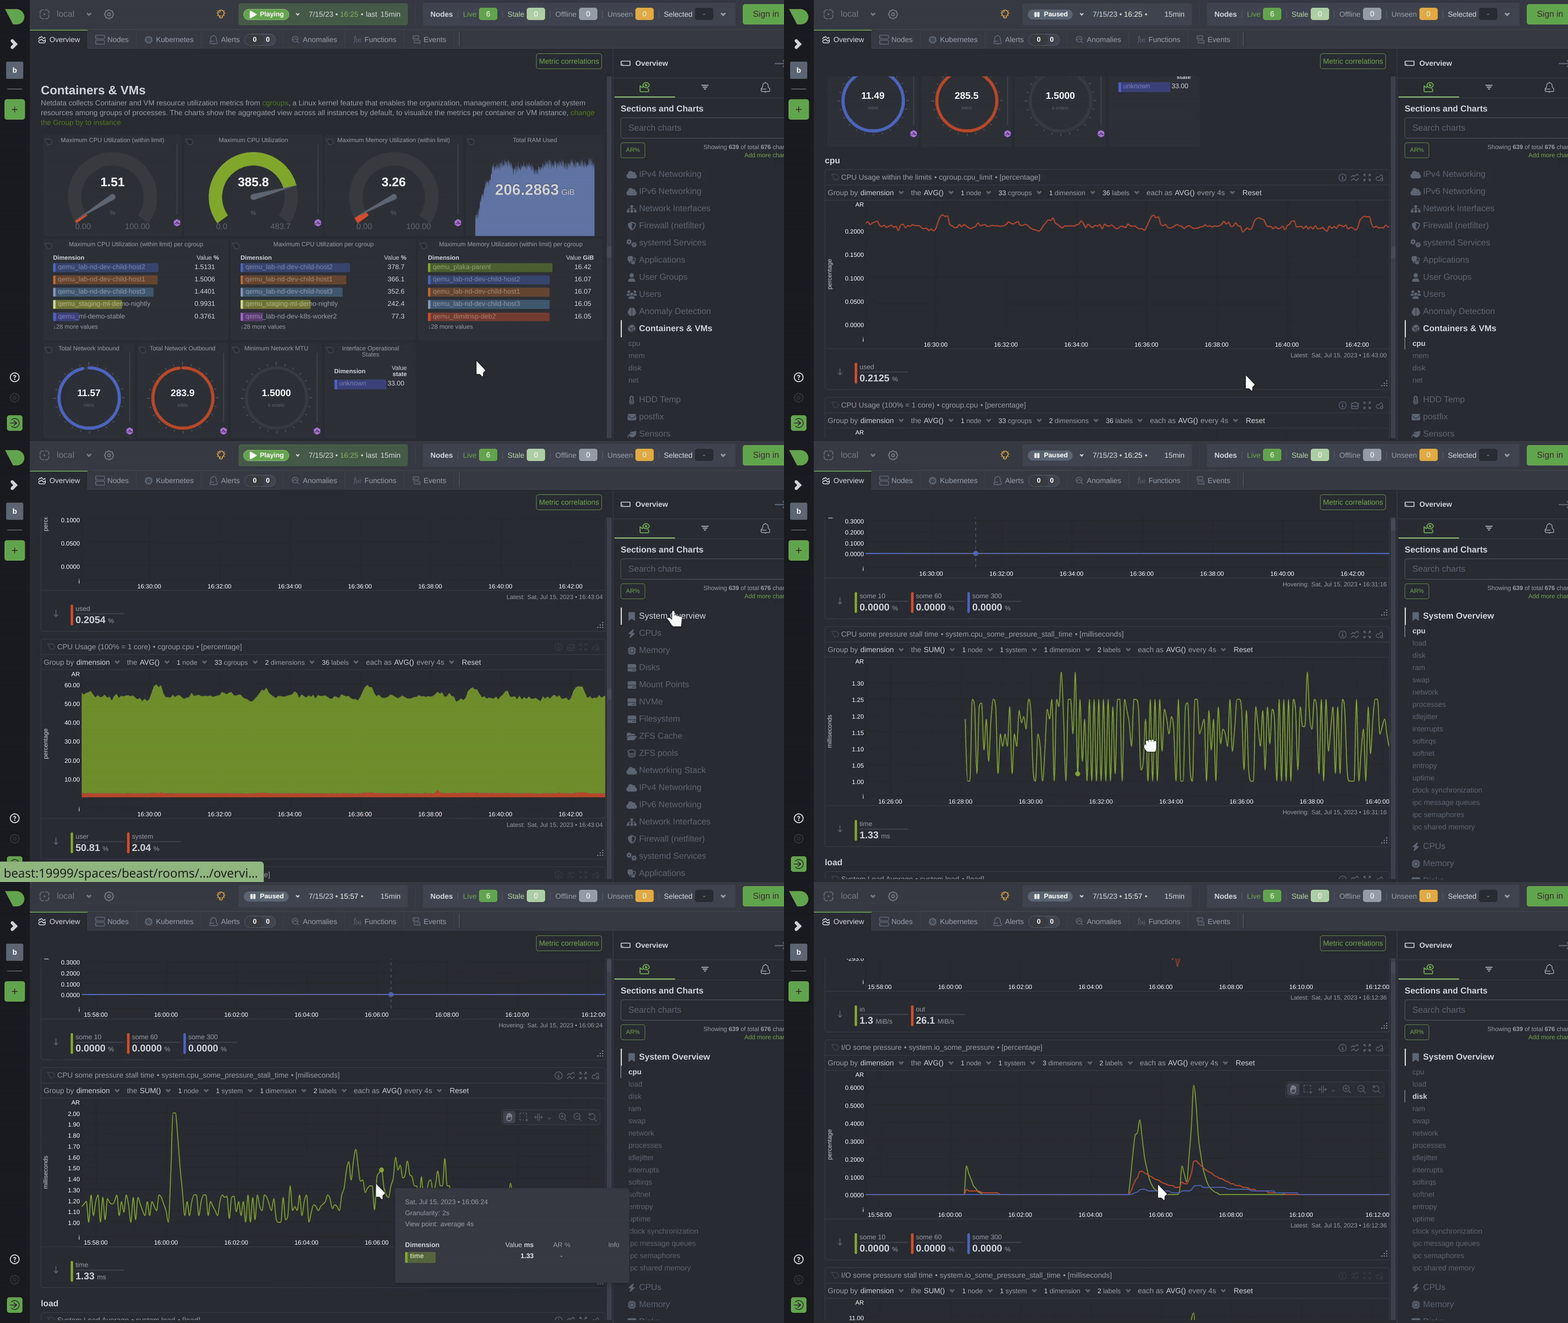
Explore Netdata's real-time monitoring features: per-second granularity, ML anomaly detection, AI troubleshooting & zero config setup. See the live demo!
Netdata is free for up to 5 nodes. Business plans start at $4.50/node/month (billed annually) with a 14-day free trial. Simple, transparent pricing.
Real-time infrastructure monitoring with per-second metrics, ML anomaly detection, and AI troubleshooting. Open source, #1 on GitHub. Cut MTTR by 80%.
Calculate how much Netdata will reduce your MTTR, eliminate blind spots, and save costs with per-second metrics and AI troubleshooting.
Alert fatigue is a symptom of bad observability, not a separate problem. Per-metric ML with consensus voting prevents the false-positive flood at the source — before alerts ever fire.
Monitor every metric every second with edge-native ML, cut costs by 90%, and resolve issues 80% faster with Netdata’s real-time APM. Book a demo now!
Get per-second visibility, instant anomaly detection, and AI-powered troubleshooting that prevents outages and cuts monitoring costs by 90%. Book a demo!
Monitor every database in real time with per-second precision, AI root-cause detection, and 60-second deployment for full visibility. Book a demo now!
Keep your gaming platform fast and stable with real-time visibility, ML detection, and AI-powered root cause analysis for 99.9% uptime. Book a demo now!
Get real-time hybrid cloud observability with per-second metrics, edge-based ML, and unified visibility across any environment. Book a demo now!
Real-time Kubernetes monitoring with per-second metrics, ML anomaly detection, and AI troubleshooting at unmatched cost efficiency. Book a demo now!
Netdata gives lean ops teams real-time visibility, AI-powered resolution, and predictable costs to reduce MTTR and streamline every shift. Book a demo now!
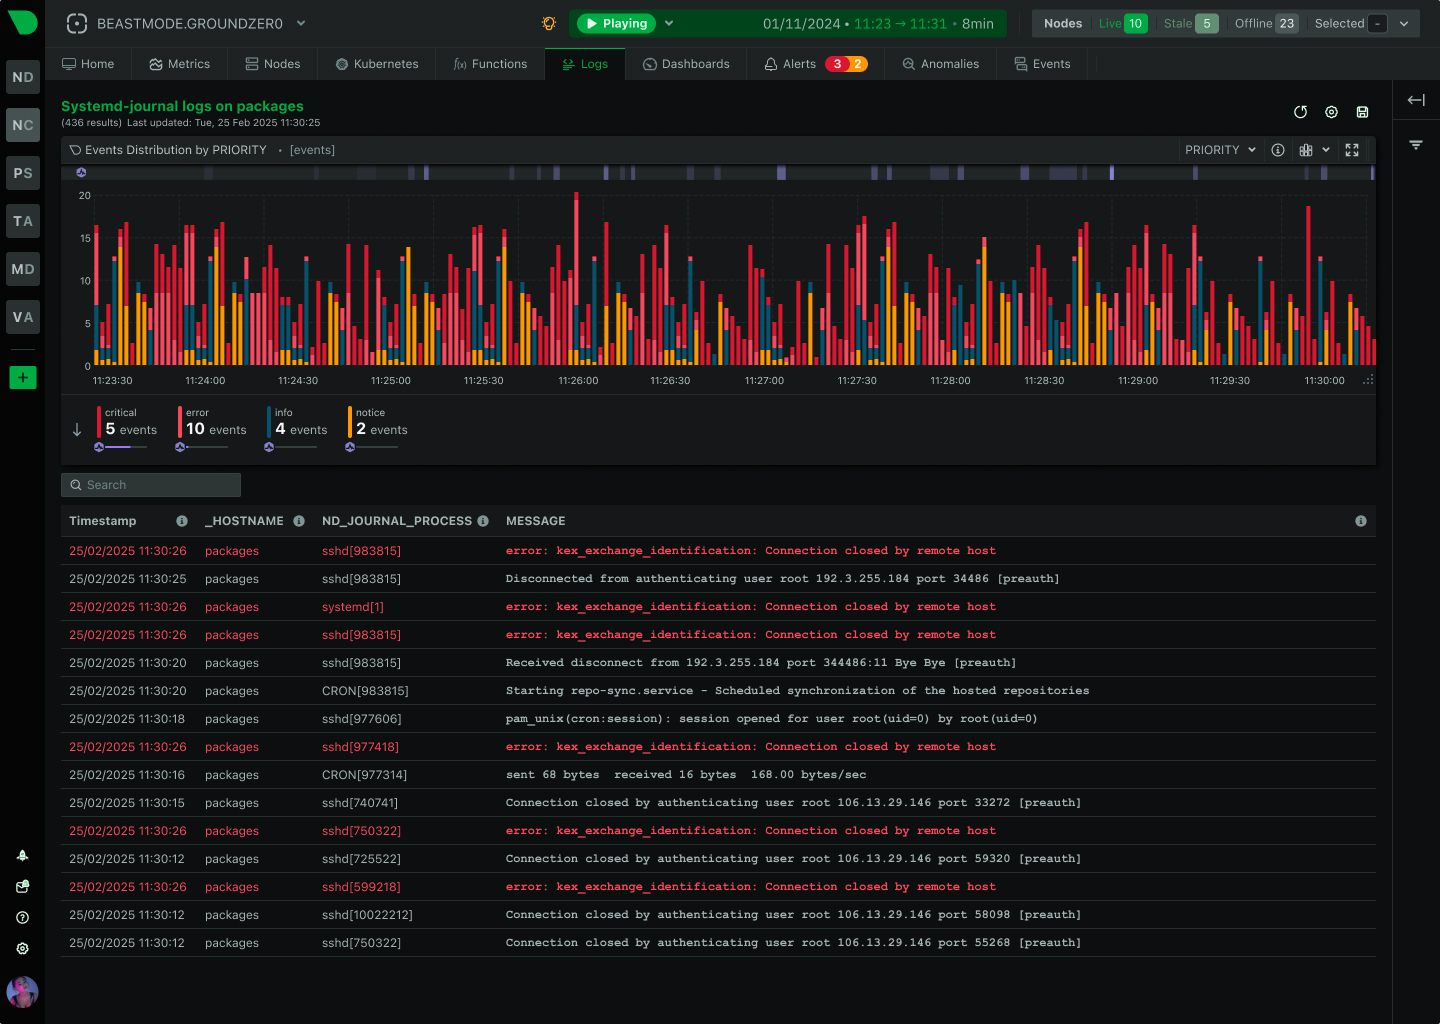
Get sub-2-second queries, AI-powered troubleshooting, and zero-pipeline systemd-journal log management with full data sovereignty. Book a demo now!
Monitor all client environments in seconds with real-time visibility, flat pricing, and built-in AI troubleshooting designed for freelancers. Book a demo!
See every issue instantly with per-second monitoring, smart ML anomaly detection, and AI-guided troubleshooting that cuts MTTR dramatically. Book a demo!
Achieve 24/7 operational excellence with per-second visibility, AI-powered troubleshooting, and predictable costs with Netdata. Learn more today!
Ship faster with real-time, per-second observability, AI troubleshooting, and seamless IDE integration. Boost dev velocity with zero config. Book a demo!
Real-time observability for government teams with full compliance, data sovereignty, and up to 90% cost reduction. Powerful, secure, and fast. Book a demo!
Get real-time observability, per-second metrics, ML anomaly detection, and predictable costs. Cut MTTR by 80% and scale instantly. Book a demo now!
Achieve complete infrastructure visibility with Netdata's unified observability platform. Per-second metrics, logs, and ML-powered insights. Learn more!
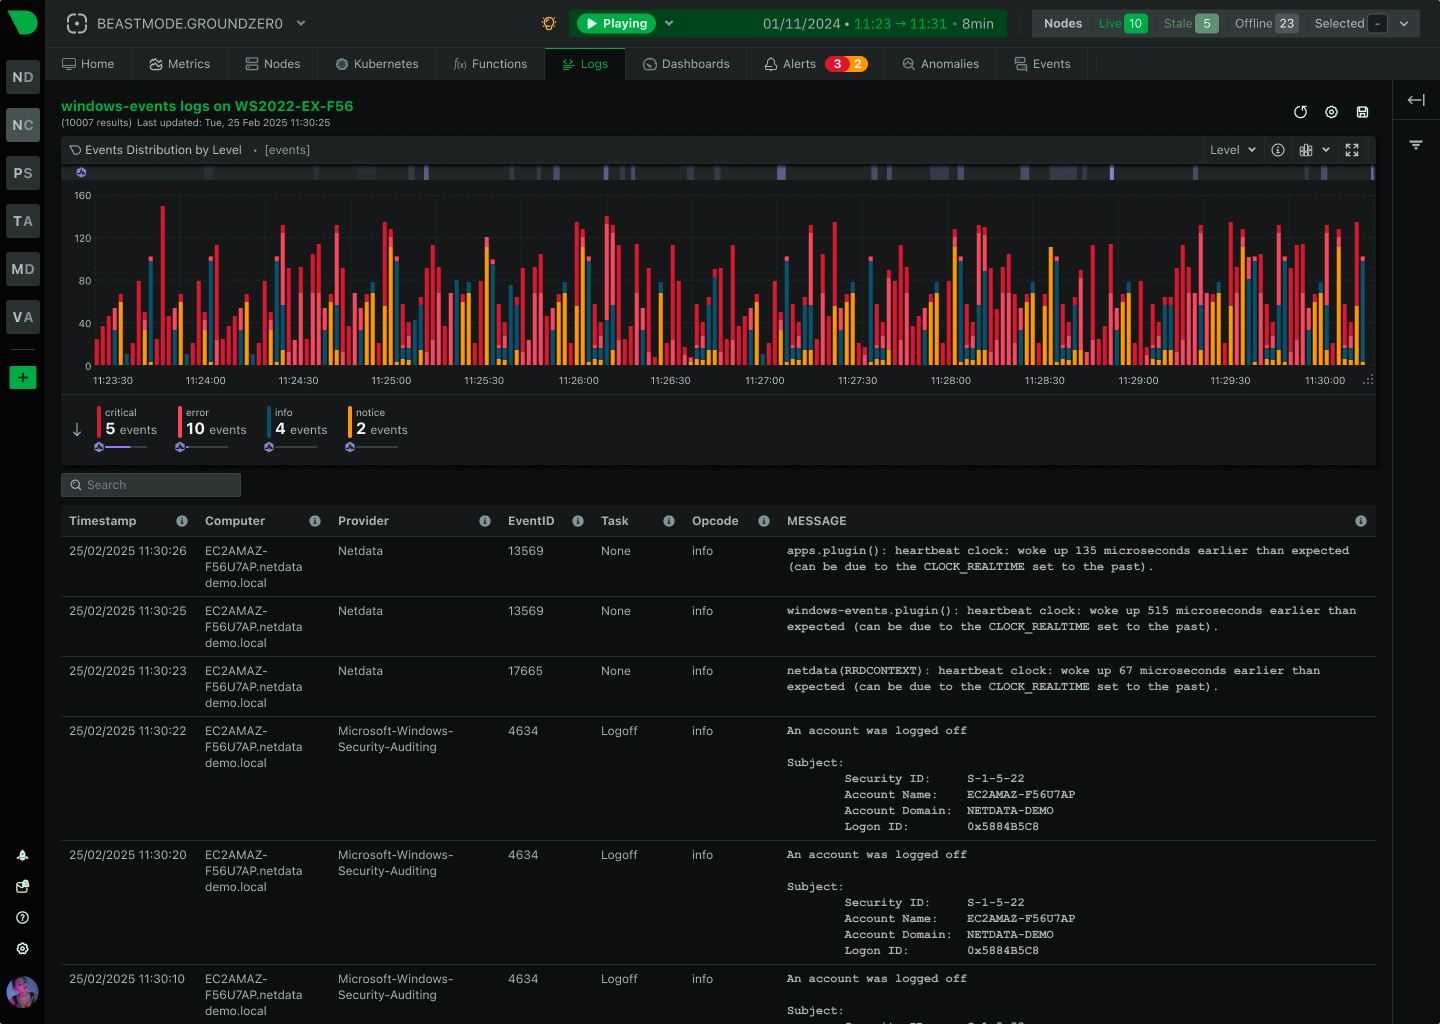
Get real-time Windows Event Log observability with per-second metrics, ML anomaly detection, and AI-powered troubleshooting at lower cost. Book a demo now!
Enhance Lansweeper with real-time monitoring from Netdata. Get per-second visibility, ML anomaly detection, and AI-powered troubleshooting. Learn more now!
A free 8-episode video course on Netdata by Jay LaCroix of LearnLinux.tv — covering installation, dashboards, metrics, logging, alerting, troubleshooting, and best practices.
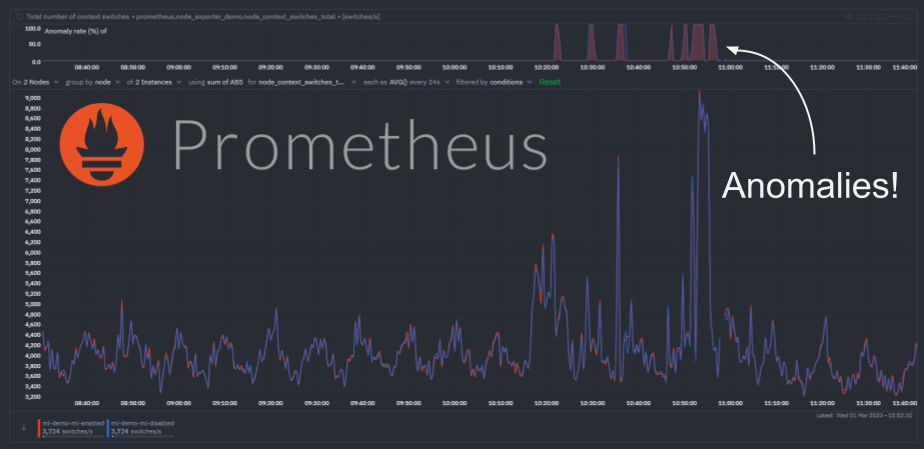
Netdata's Costa Tsaousis spoke at Conf42 Cloud Native 2024 on practical AI with machine learning for observability, covering how anomaly detection converges across services.
Netdata's Shyam Sreevalsan spoke at Conf42 DevOps 2025 on the future of observability, covering AI-driven anomaly detection, real-time processing, and predictive analytics.
Netdata at the 7th Future of Cybersecurity Summit (FOCS) 2026 in Malaysia. See how real-time infrastructure monitoring strengthens cybersecurity posture with per-second visibility and AI-driven anomaly detection.
Netdata exhibited at Gartner IT Infrastructure, Operations & Cloud Strategies Conference 2025. Learn about our booth demos, Costa's talk on observability overspend, and how we met with IT leaders in Las Vegas.
Netdata at GITEX AI ASIA 2026, April 9–10 at Marina Bay Sands, Singapore. See real-time infrastructure monitoring and AI-powered observability at Asia's largest tech event.
Netdata at the Howard Conference and Expo 'Game On' event in Fairhope, Alabama. Per-second monitoring demos, AI troubleshooting walkthroughs, and real conversations with IT leaders.
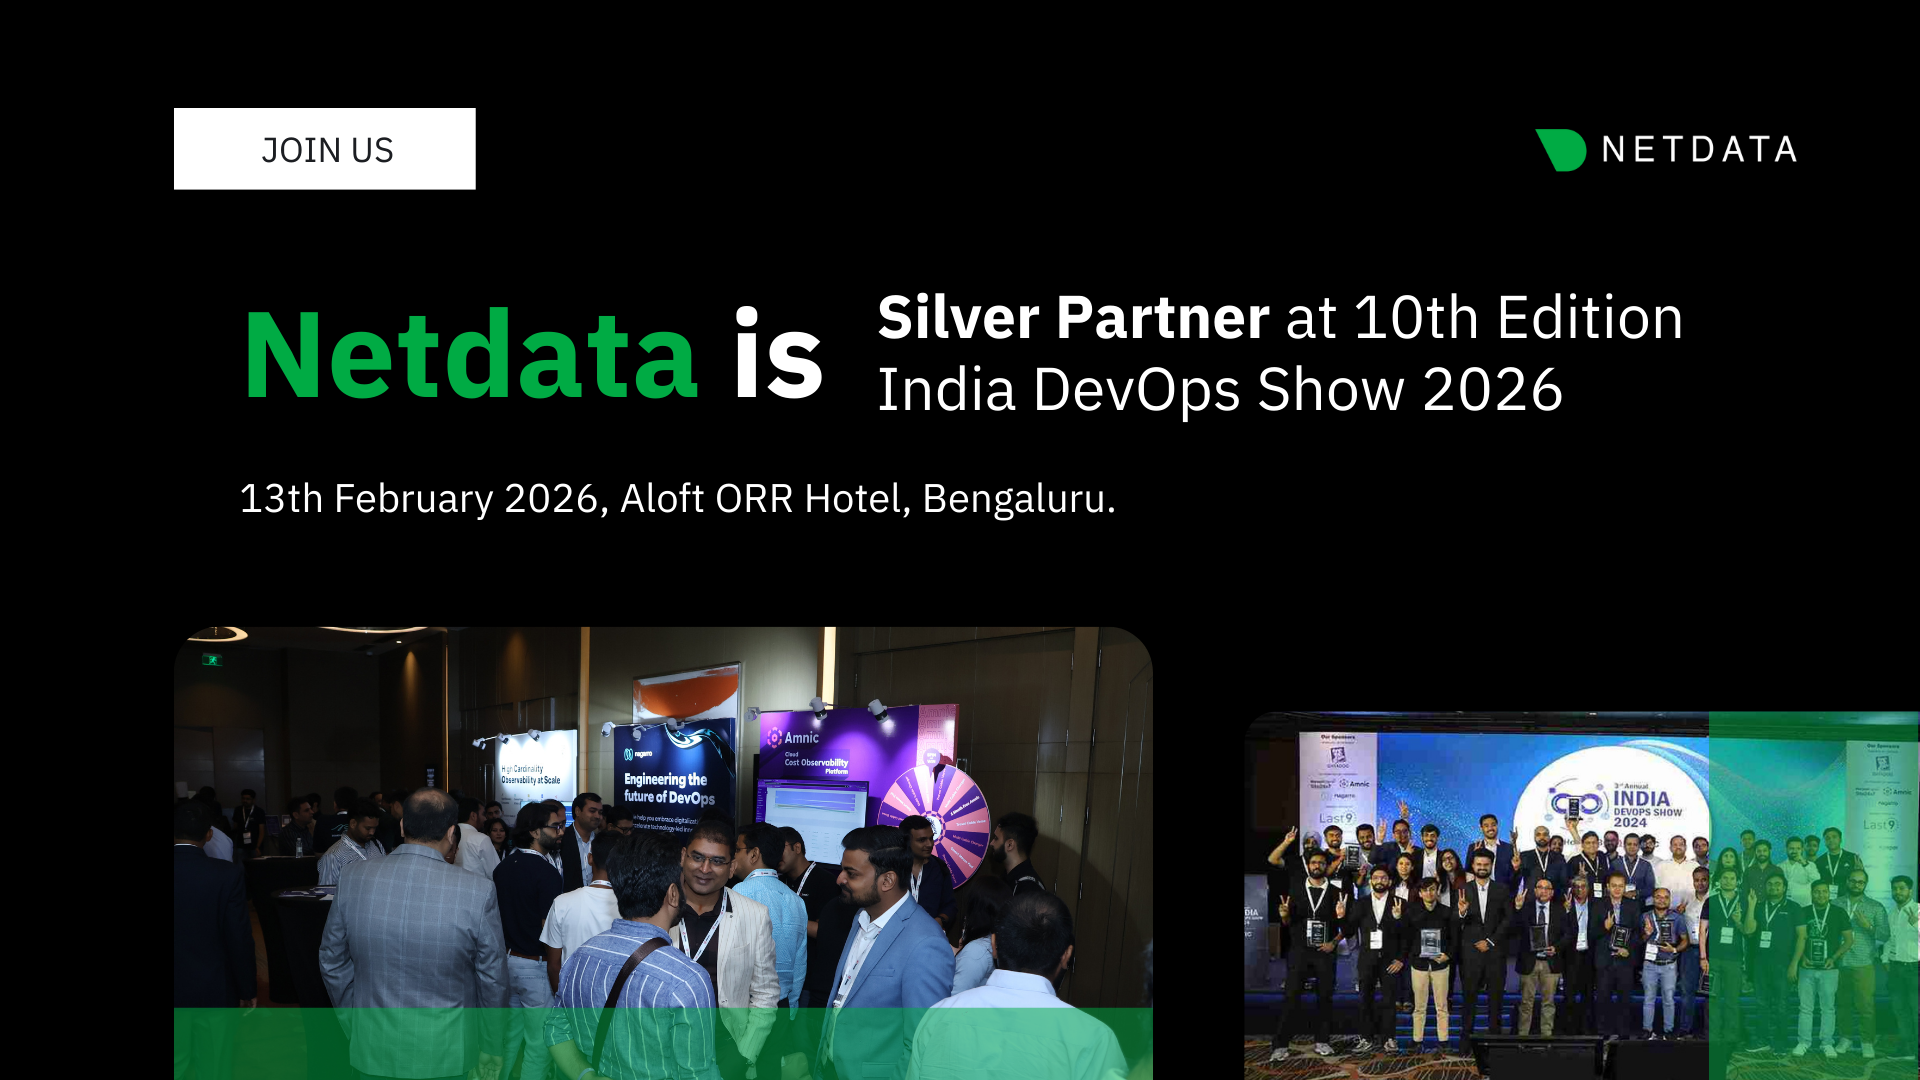
Netdata participated as a Silver Partner at the 10th Edition India DevOps Show in Bengaluru. Meet the team and discover how real-time observability accelerates DevOps excellence.
Netdata's Costa Tsaousis spoke at OpenConf 2025 in Athens on practical AI and machine learning for observability, covering anomaly detection as an advisor system and multi-model ML approaches.
Netdata's Costa Tsaousis spoke at SREday London 2024 on practical AI with machine learning for observability, engaging with site reliability and platform engineering teams.
Netdata exhibited at WeAreDevelopers World Congress 2024 in Berlin, with live booth demos, a prize draw, and Costa Tsaousis's talk on practical AI in observability.
An alert tells you what changed. It rarely tells you why. See how Netdata AI now connects to the tools your team already runs — over the Model Context Protocol — to pull that context into the investigation and reach root cause in one place instead of five browser tabs.
Join ilert and Netdata to explore the shift from static runbooks to AI agents that bridge observability and incident response — investigating incidents in real time, correlating signals, and acting autonomously.
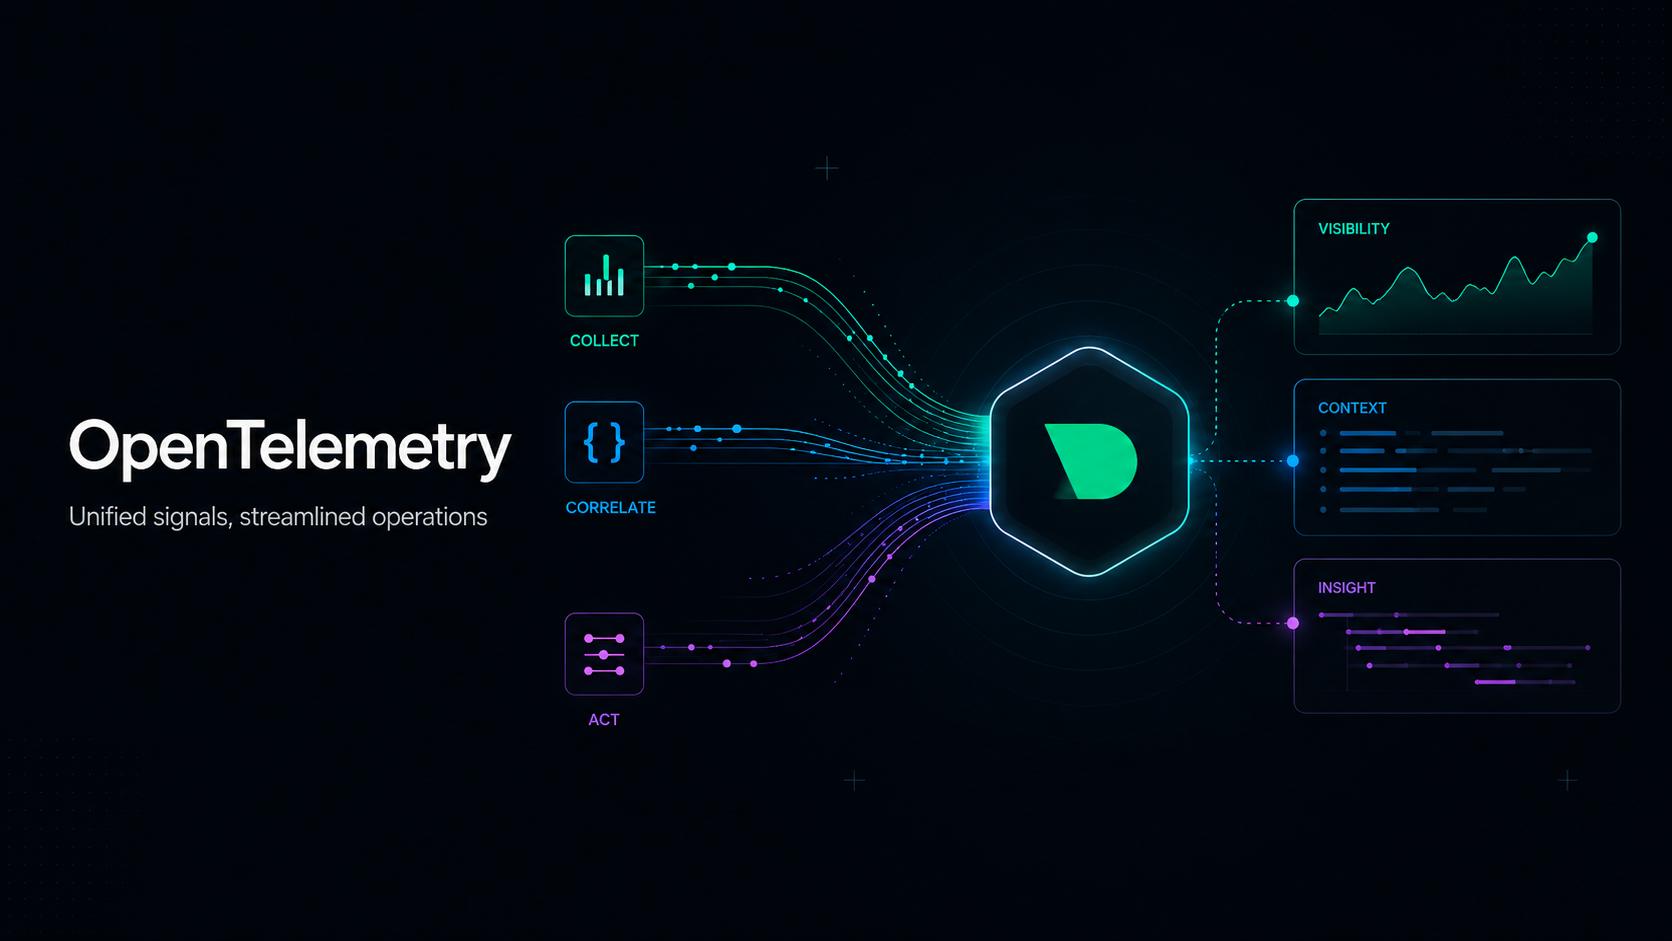
Stand up an OpenTelemetry Collector pipeline, point it at Netdata, and skip the per-metric bill.
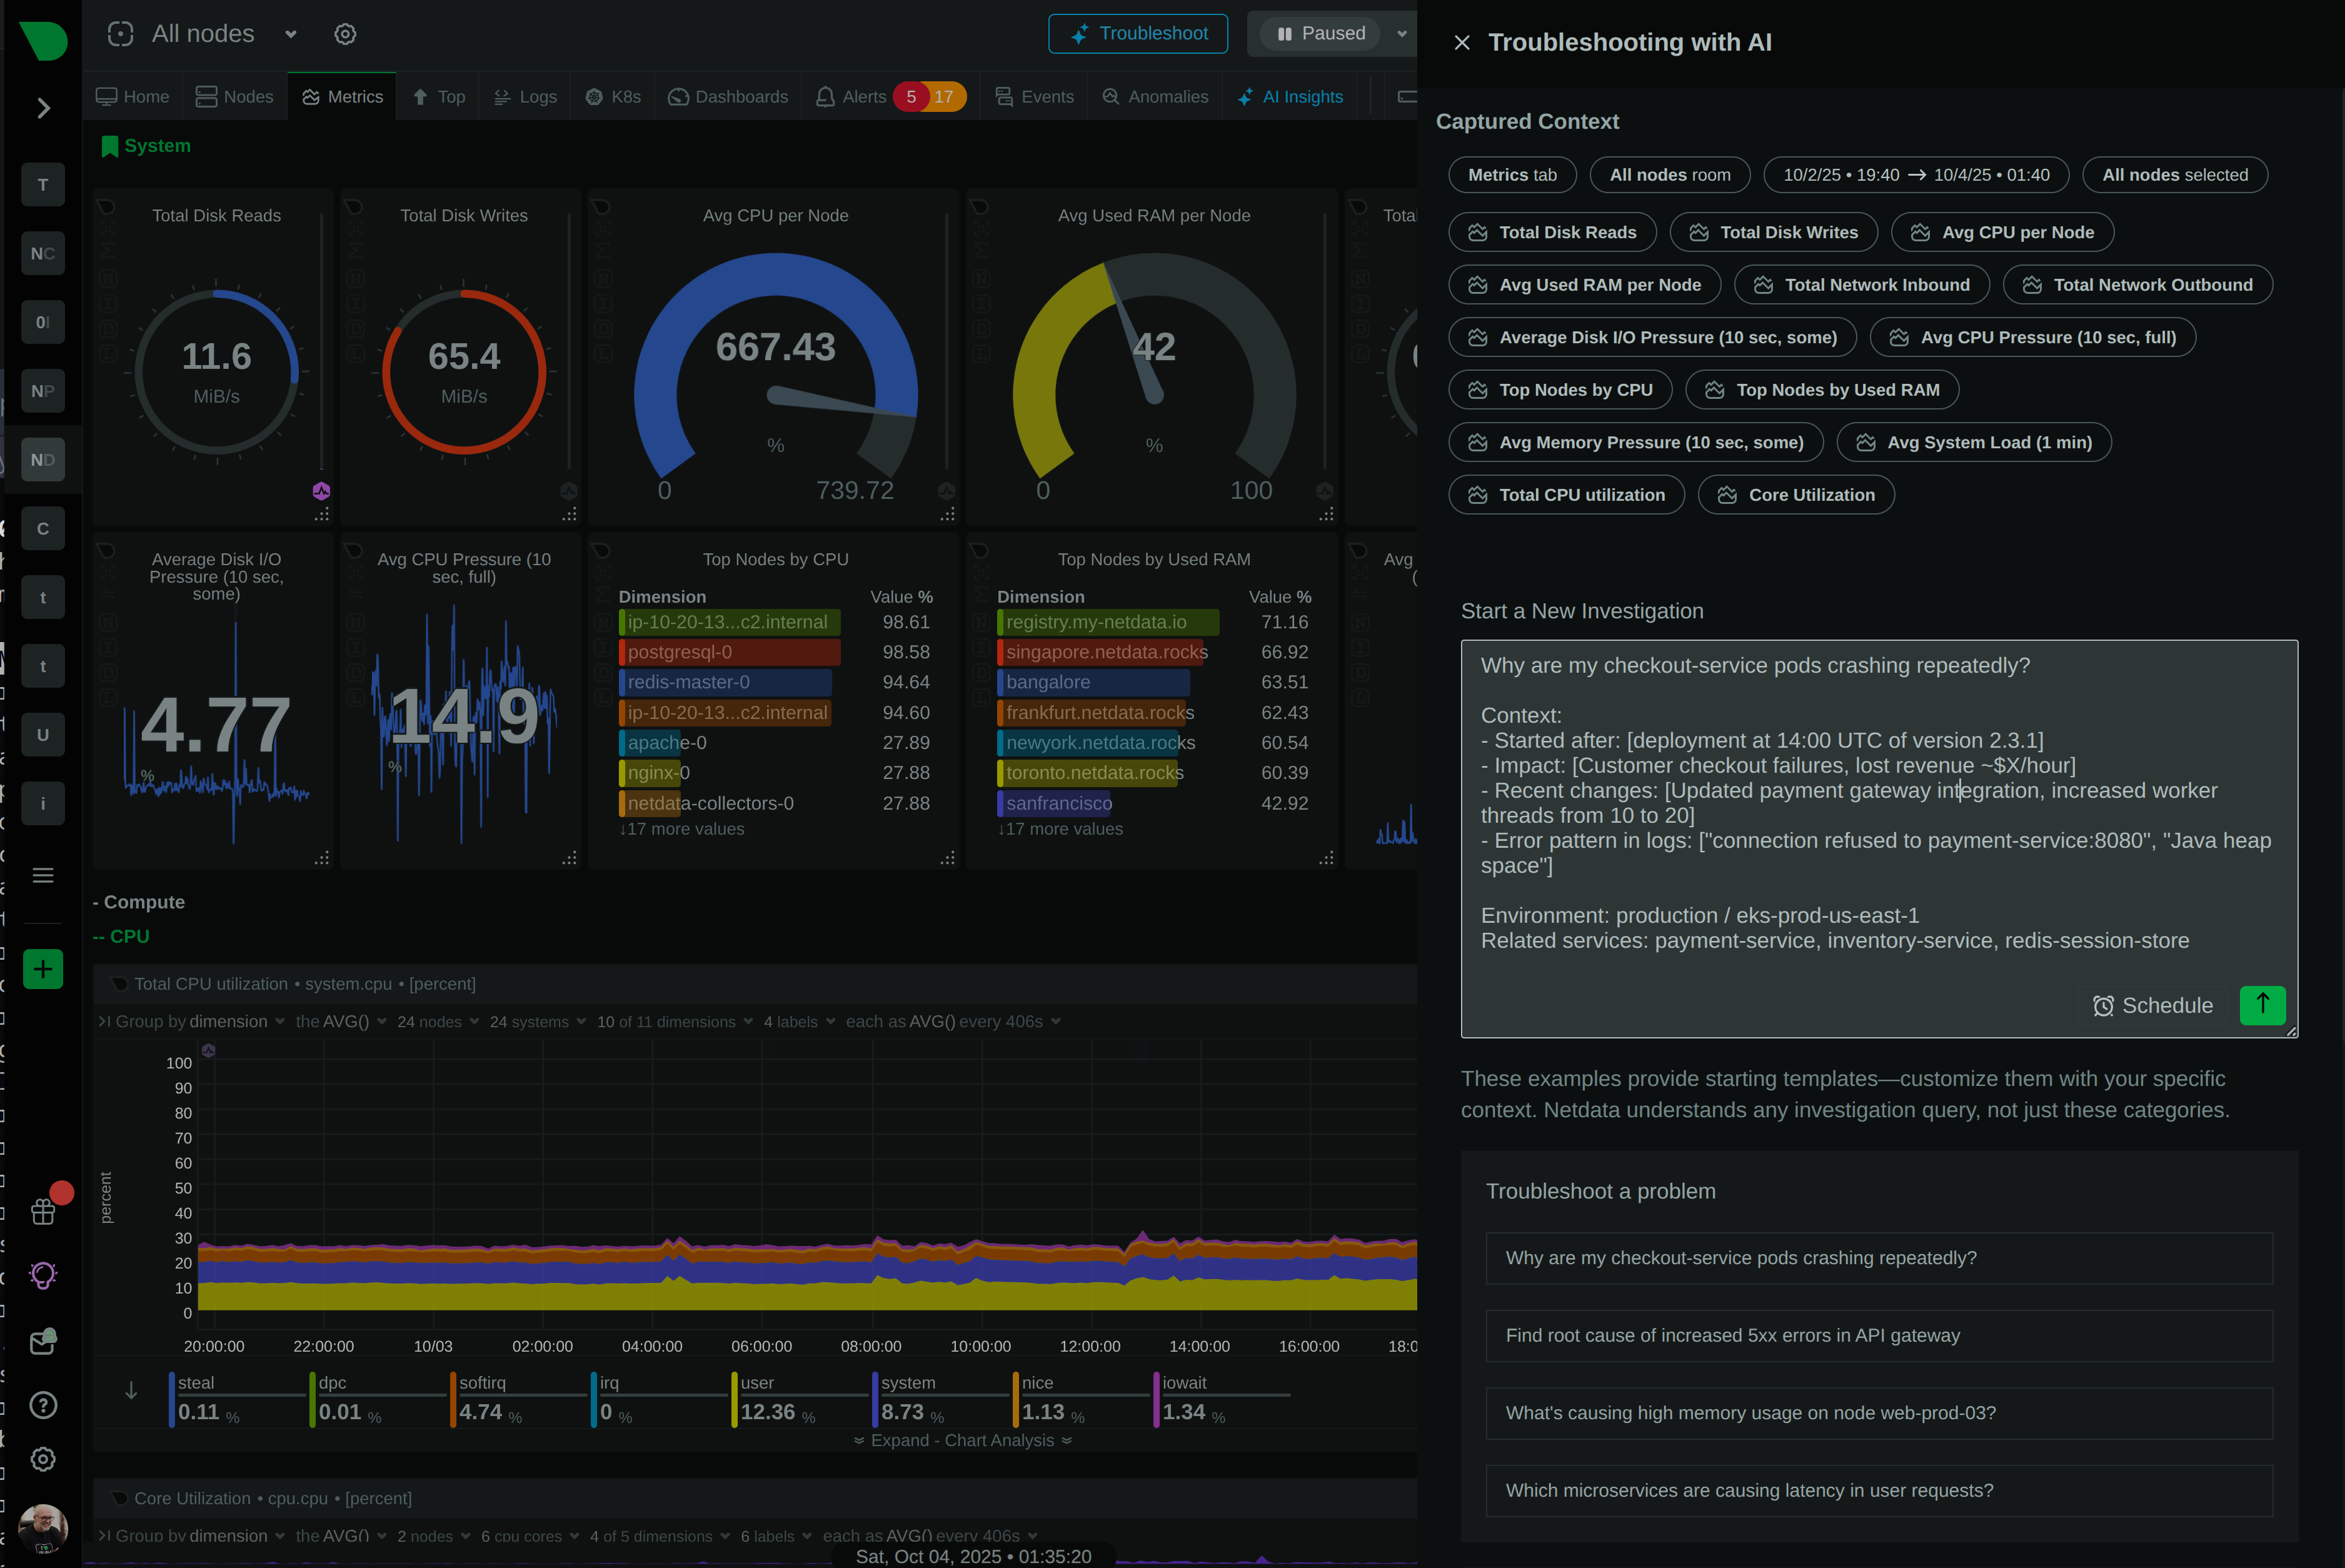
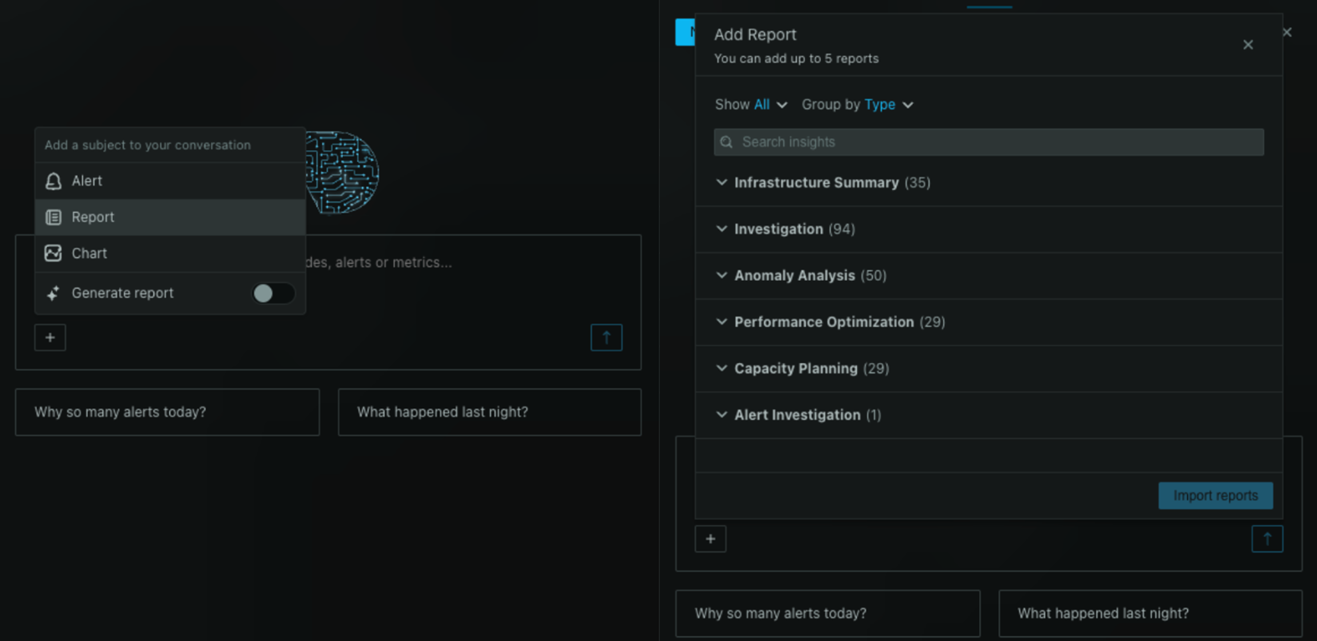
Chat with your charts, alerts, and reports. Start investigations from a conversation.
One endpoint. Your entire infrastructure. Any AI agent.
Meet the Netdata team in Bengaluru to see how real-time observability accelerates DevOps excellence.
Your interactive partner for rapid-fire questions, data exploration, and instant analysis.
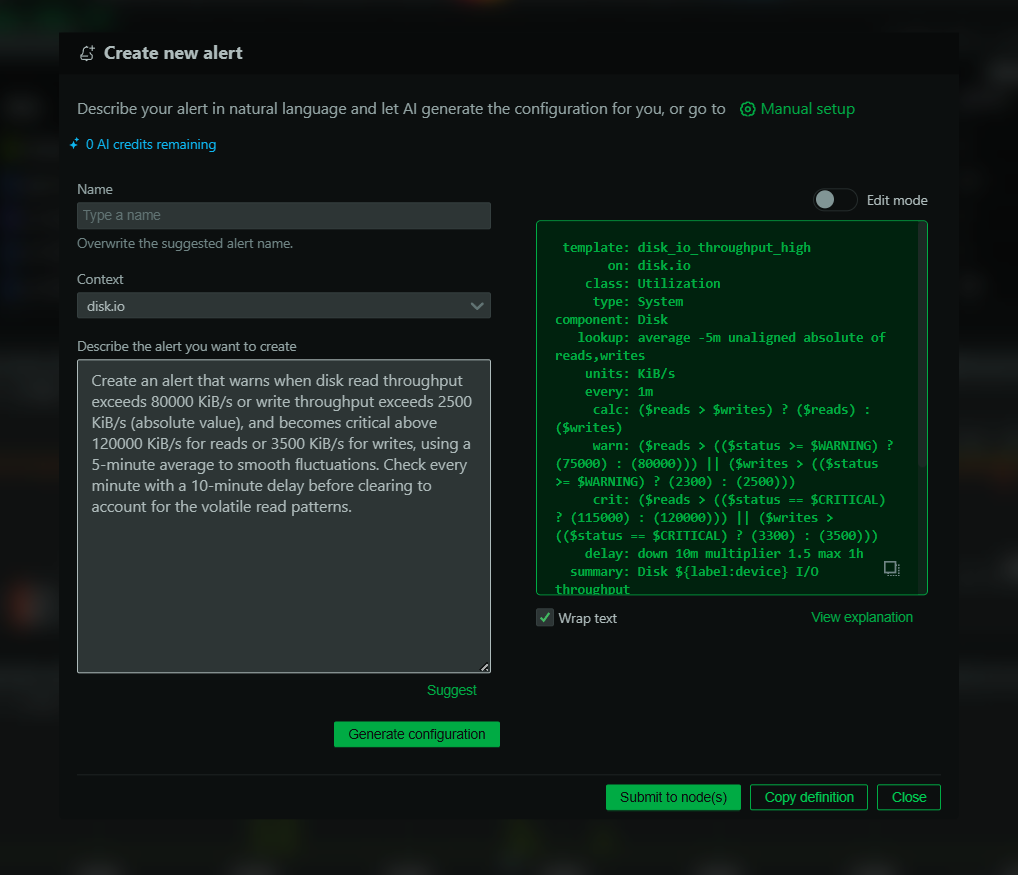
Turn your intent into production-ready alerts using plain English.
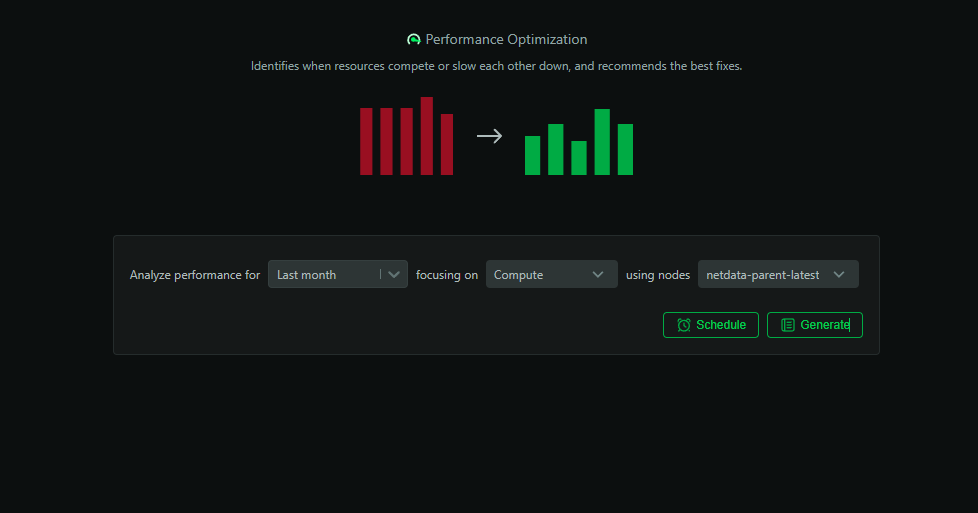
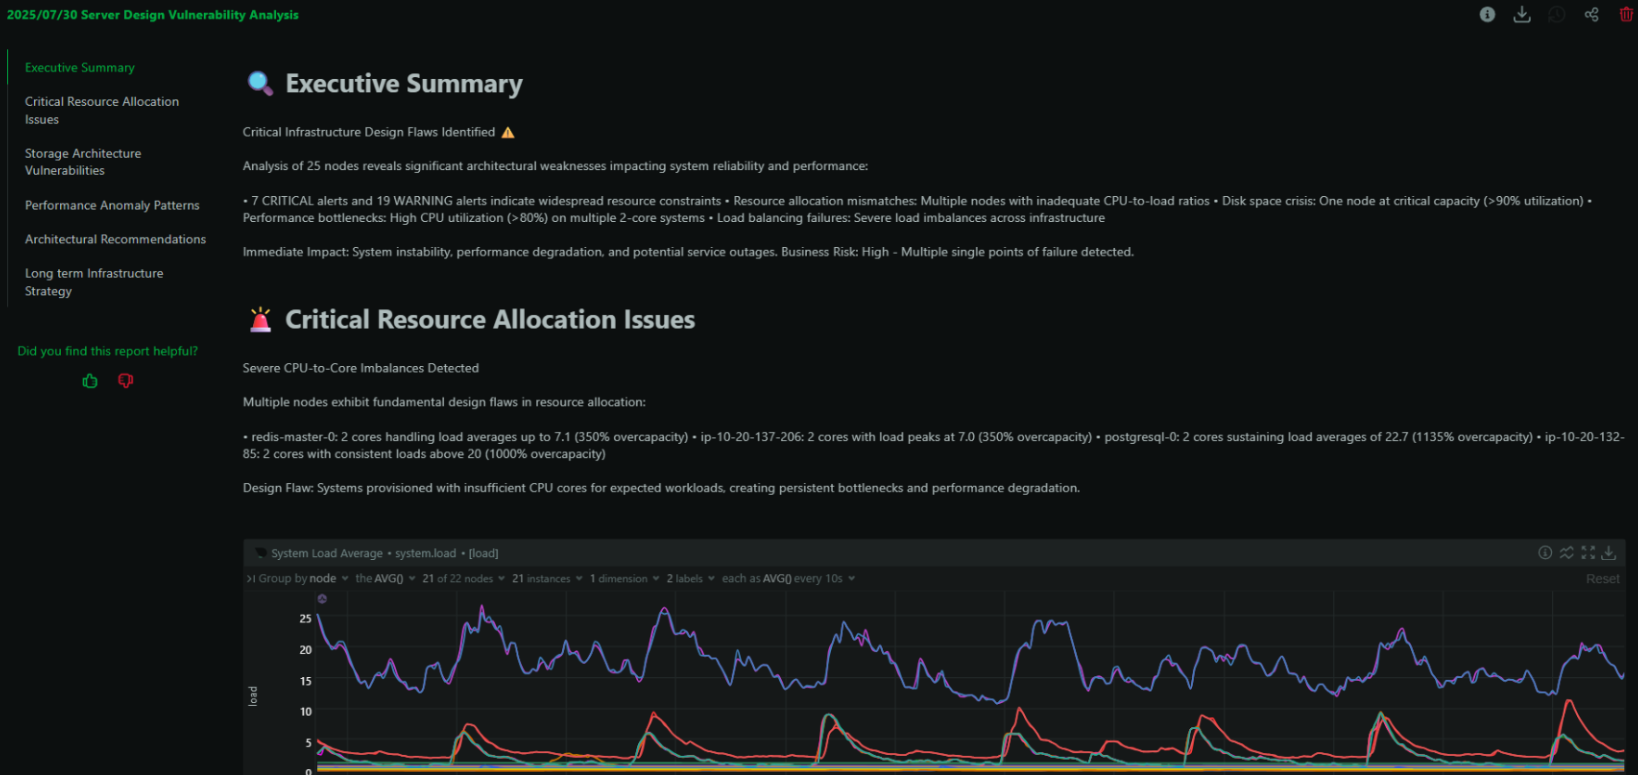
Get weekly health checks, monthly optimization analyses, and custom reports delivered automatically
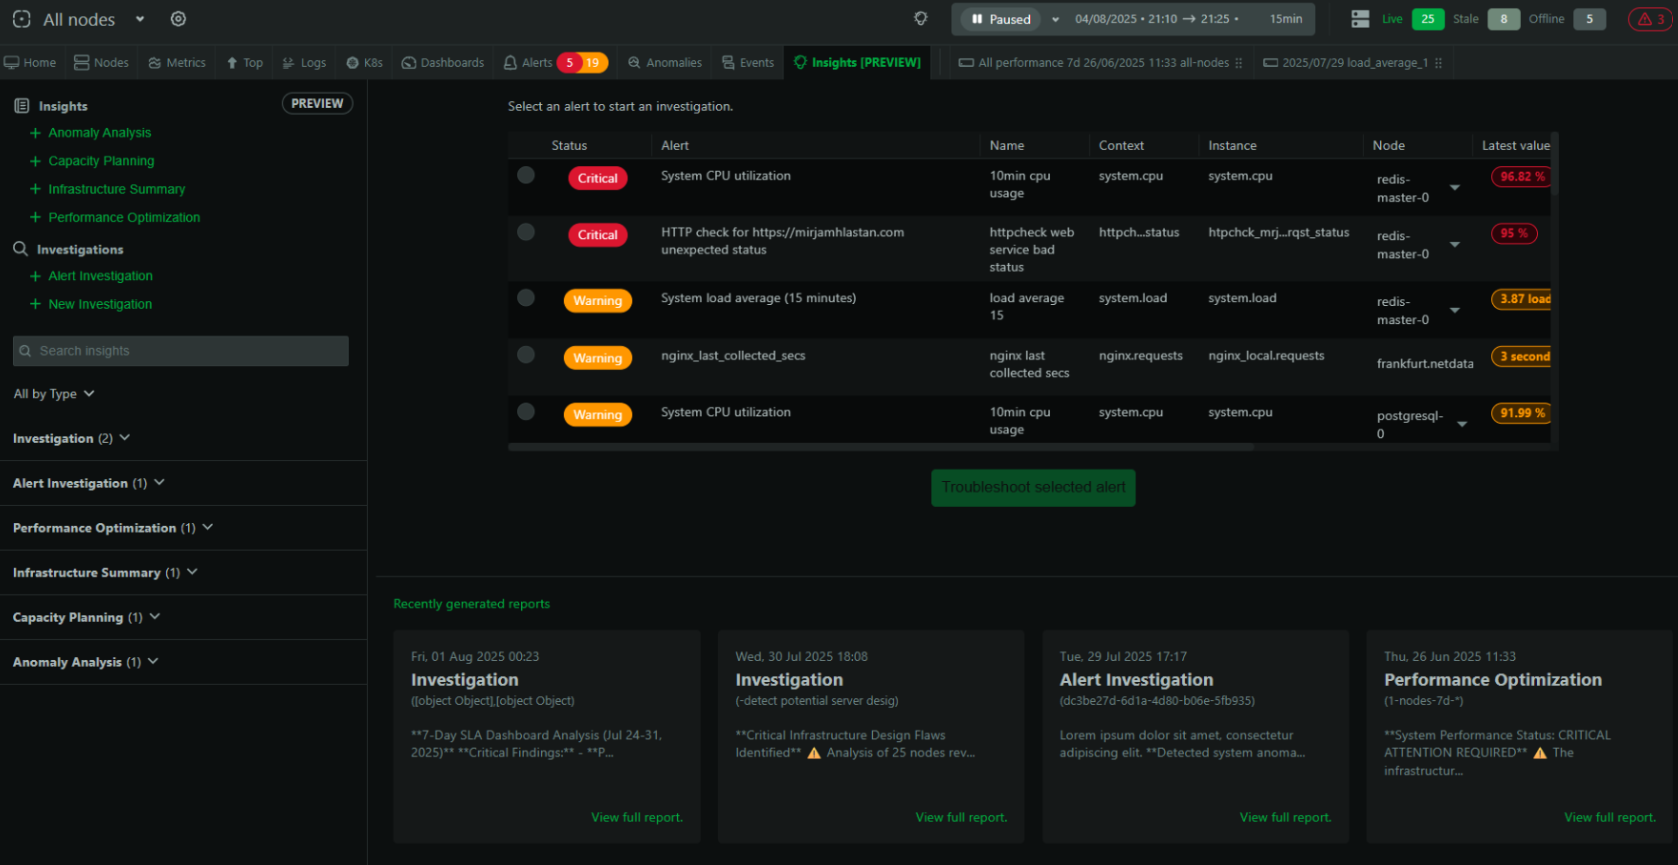
Make Netdata AI an essential part of your toolkit with on-demand automated RCA.
Ask Netdata Anything, Get an Expert Analysis in Minutes
Netdata AI: Your Co-SRE for Alert Investigation
Revolutionize how you interact with your monitoring data!
Infrastructure Intelligence for the Modern Enterprise
How Netdata is setting new standards in the monitoring industry
Unveiling the Latest Innovations in Monitoring and Observability
Pioneering Alerts with Machine Learning for Proactive Monitoring
Deep Dive into Understanding and Managing Unusual System Behavior
Introducing New Enhancements for Optimal System Monitoring
Your Guide to Maximizing Netdata's Capabilities
Advanced Algorithms for Proactive System Health Management
Envisioning the Next Generation of Performance and Health Monitoring
Leading the Charge in Next-Gen Observability
Leveraging AI for Deeper Analysis and Faster Problem Resolution
Navigating Through Anomalies with Ease for Quicker Troubleshooting
Utilizing AI to Predict and Prevent System Anomalies
Behind the Scenes of Enhancing Monitoring with AI
Integrating Anomaly Detection for Enhanced Monitoring Precision
Revolutionizing Monitoring with AI
Showcasing Innovations and Best Practices in Cloud
How Machine Learning Powers Enhanced Monitoring Solutions
Joining Forces to Revolutionize Monitoring with AI
See how Netdata can improve visibility, reduce downtime, and simplify monitoring — no commitment required.