The only agent that thinks for itself
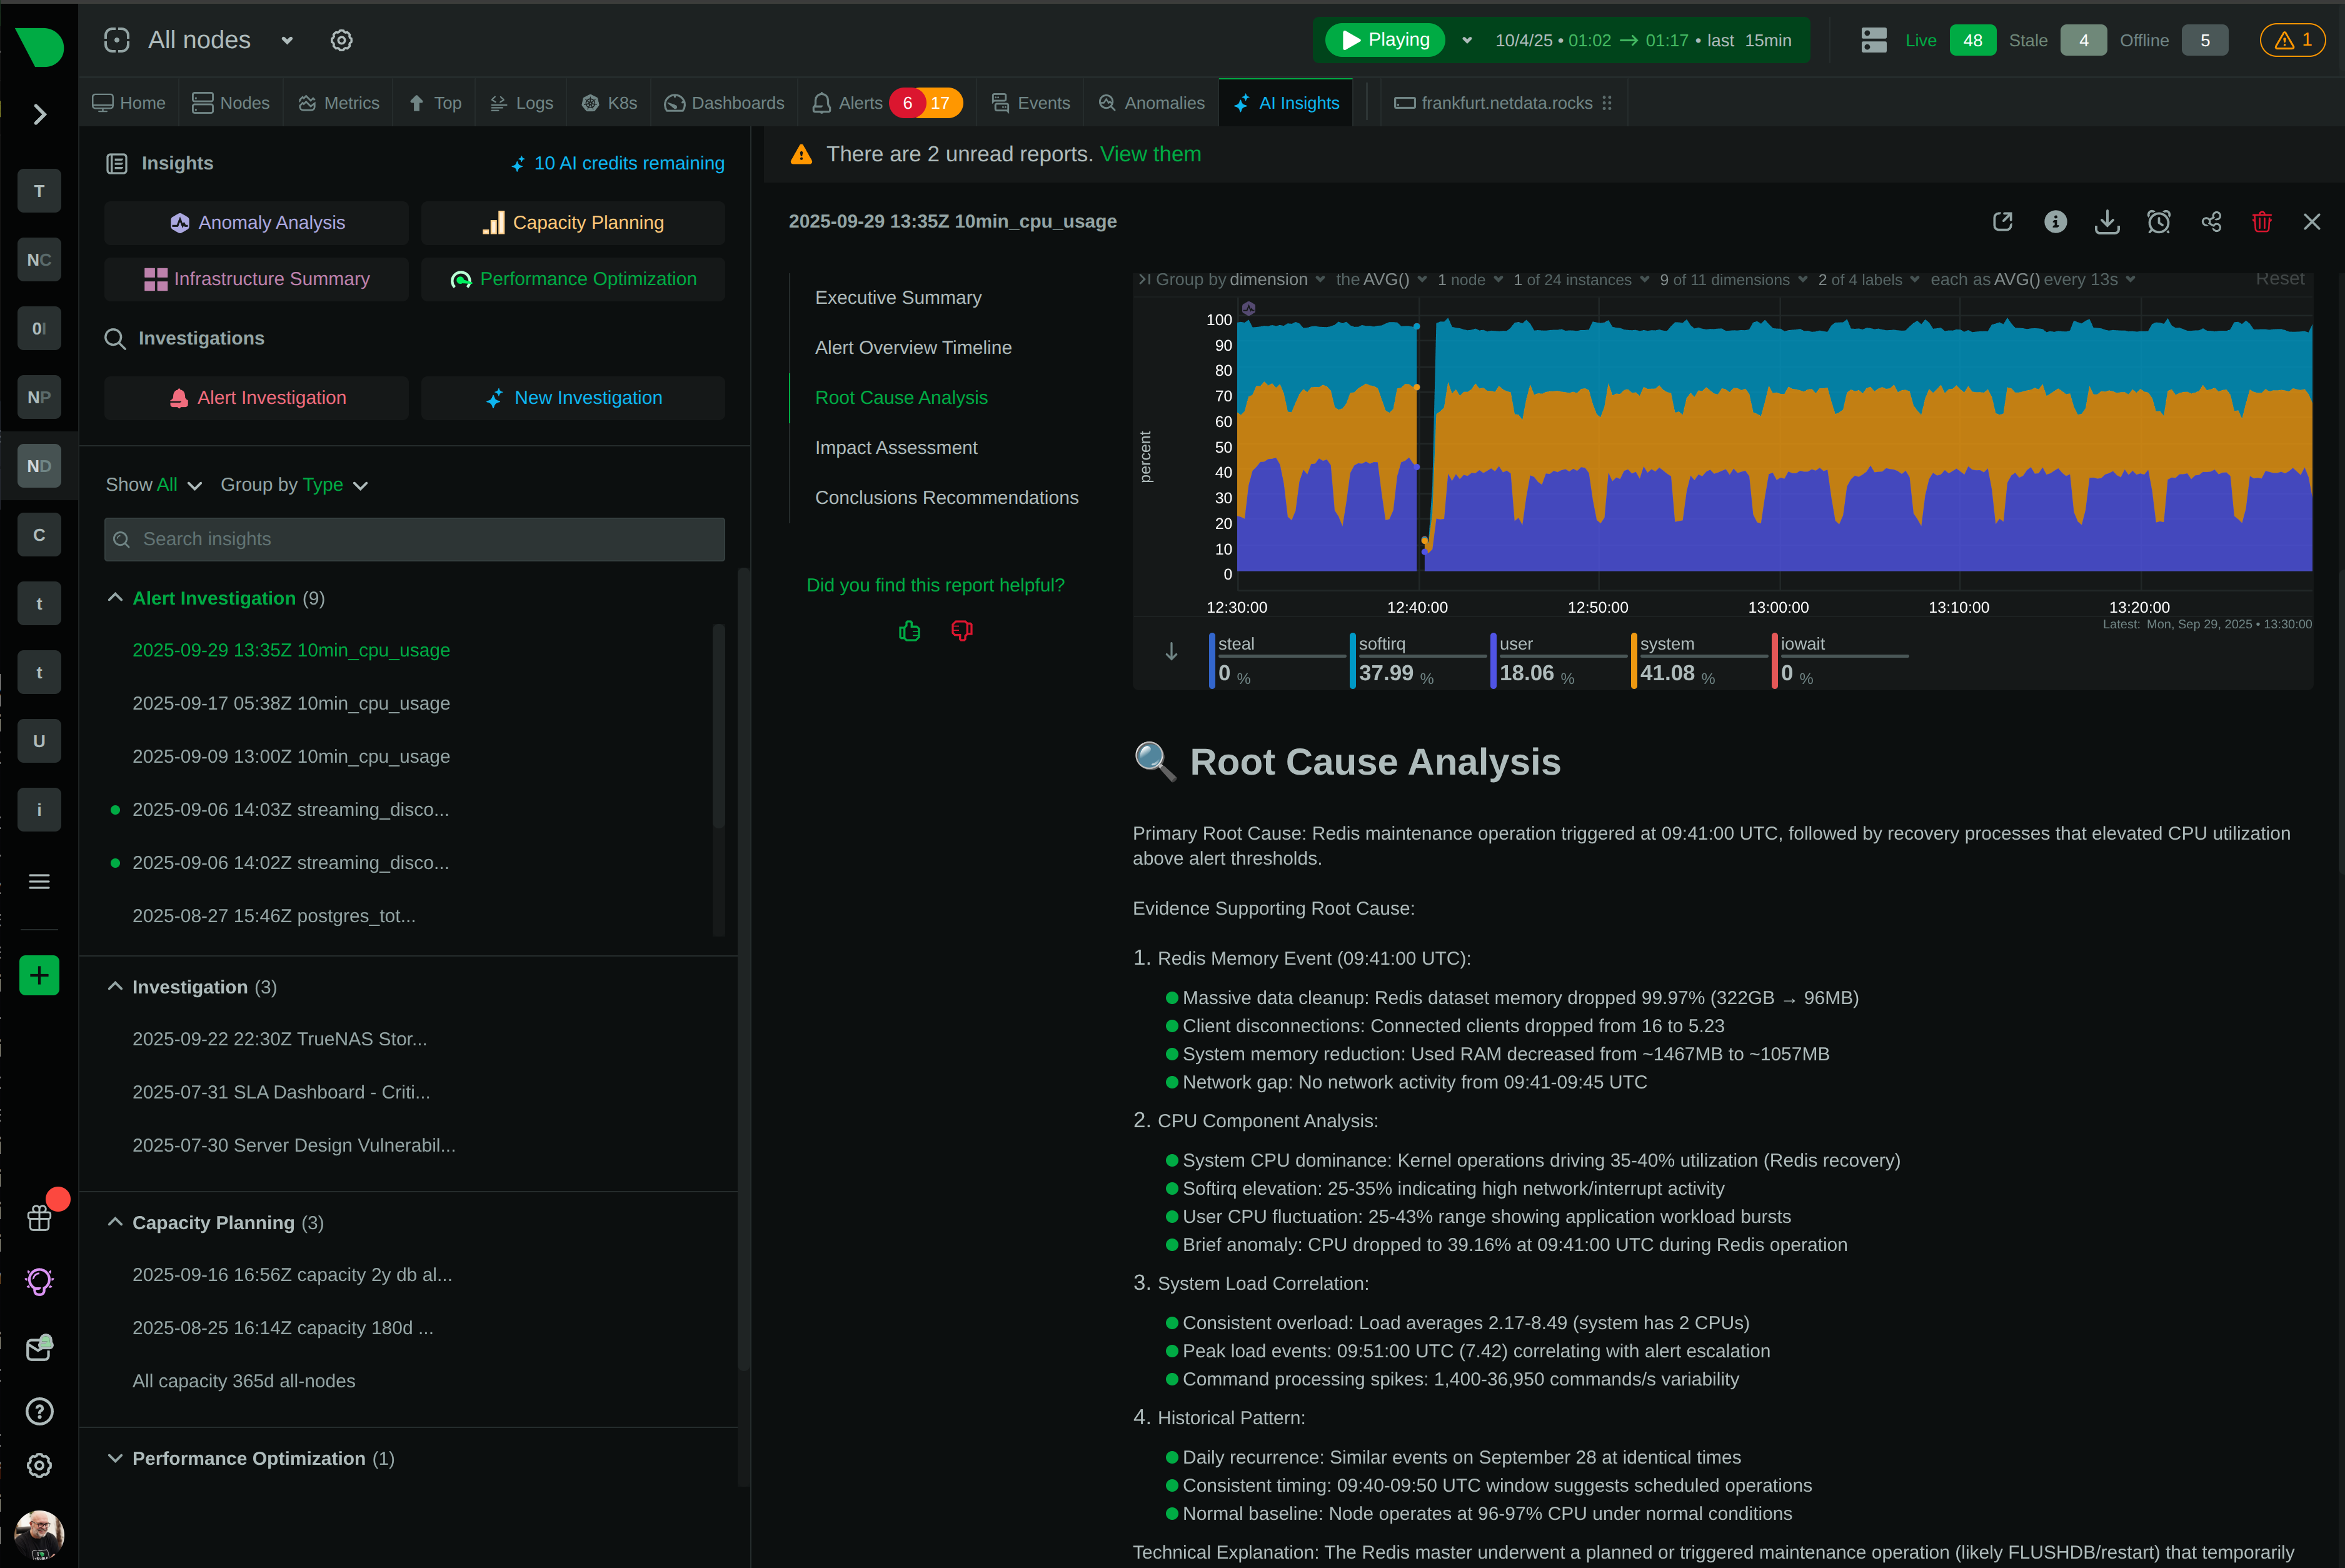
Autonomous Monitoring with self-learning AI built-in, operating independently across your entire stack.

Centralized metrics streaming and storage
Aggregate metrics from multiple agents into centralized Parent nodes for unified monitoring across your infrastructure.
Fully managed cloud platform
Access your monitoring data from anywhere with our SaaS platform. No infrastructure to manage, automatic updates, and global availability.
Deploy Netdata Cloud in your infrastructure
Run the full Netdata Cloud platform on-premises for complete data sovereignty and compliance with your security policies.
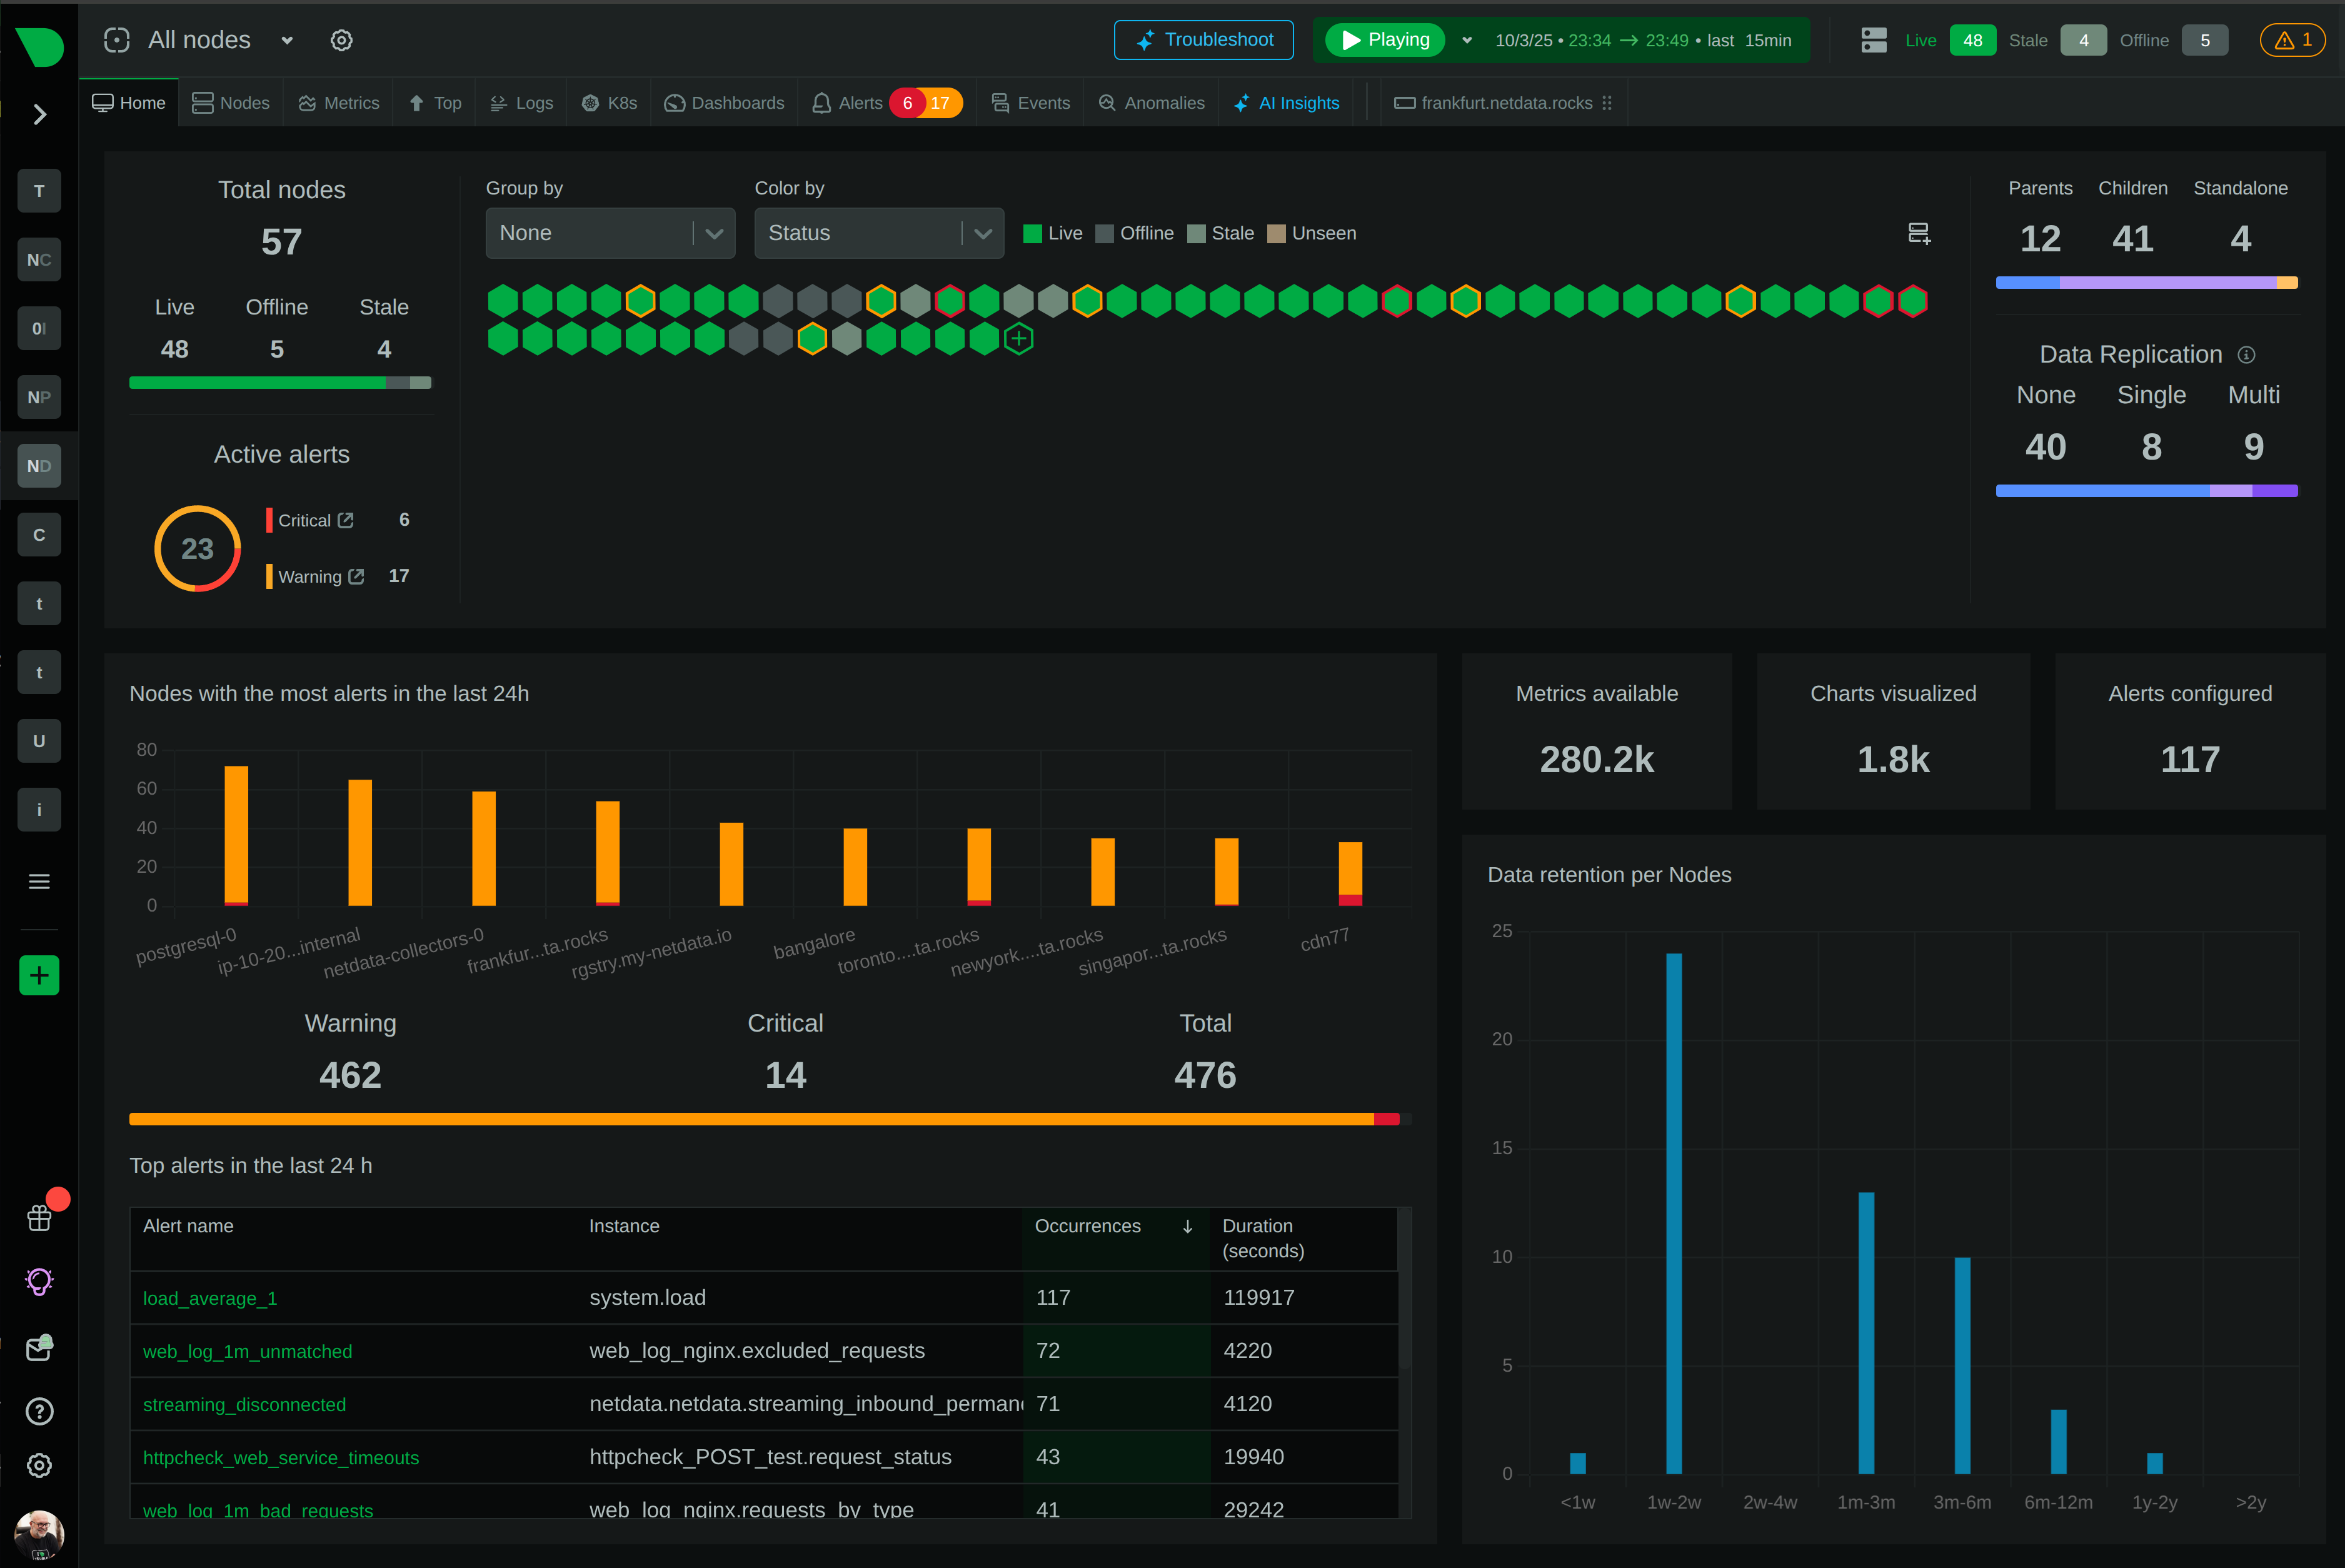
Powerful, intuitive monitoring interface
Modern, responsive UI built for real-time troubleshooting with customizable dashboards and advanced visualization capabilities.
Monitor on the go
Native iOS and Android apps bring full monitoring capabilities to your mobile device with real-time alerts and notifications.
The future of infrastructure observability
See our strategic direction across AI-native observability, full-stack signals, operational intelligence, and enterprise platform maturity.
Best energy efficiency
True real-time per-second
100% automated zero config
Centralized observability
Multi-year retention
High availability built-in
Zero maintenance
Always up-to-date
Enterprise security
Complete data control
Air-gap ready
Compliance certified
Millisecond responsiveness
Infinite zoom & pan
Works on any device
Native performance
Instant alerts
Monitor anywhere
AI-native observability
Continuous delivery
Open source foundation

80% Faster Incident Resolution
True Real-Time and Simple, even at Scale
90% Cost Reduction, Full Fidelity
See and Map Your Entire Network
Single Pane of Glass
Control Without Surrender
Integrations
800+ collectors and notification channels, auto-discovered and ready out of the box.
Connect any MCP-compatible AI to your observability data. Automate workflows, playbooks, and incident response.
AWS, GCP, Azure—unified observability across all providers.
On-prem and cloud infrastructure in a single view.
Your metrics stay on your infrastructure. Always.
Reduced monitoring costs by 46% while cutting staff overhead by 67%.
— Leonardo Antunez, Codyas
No data shipping. No central storage costs. Query at the edge.
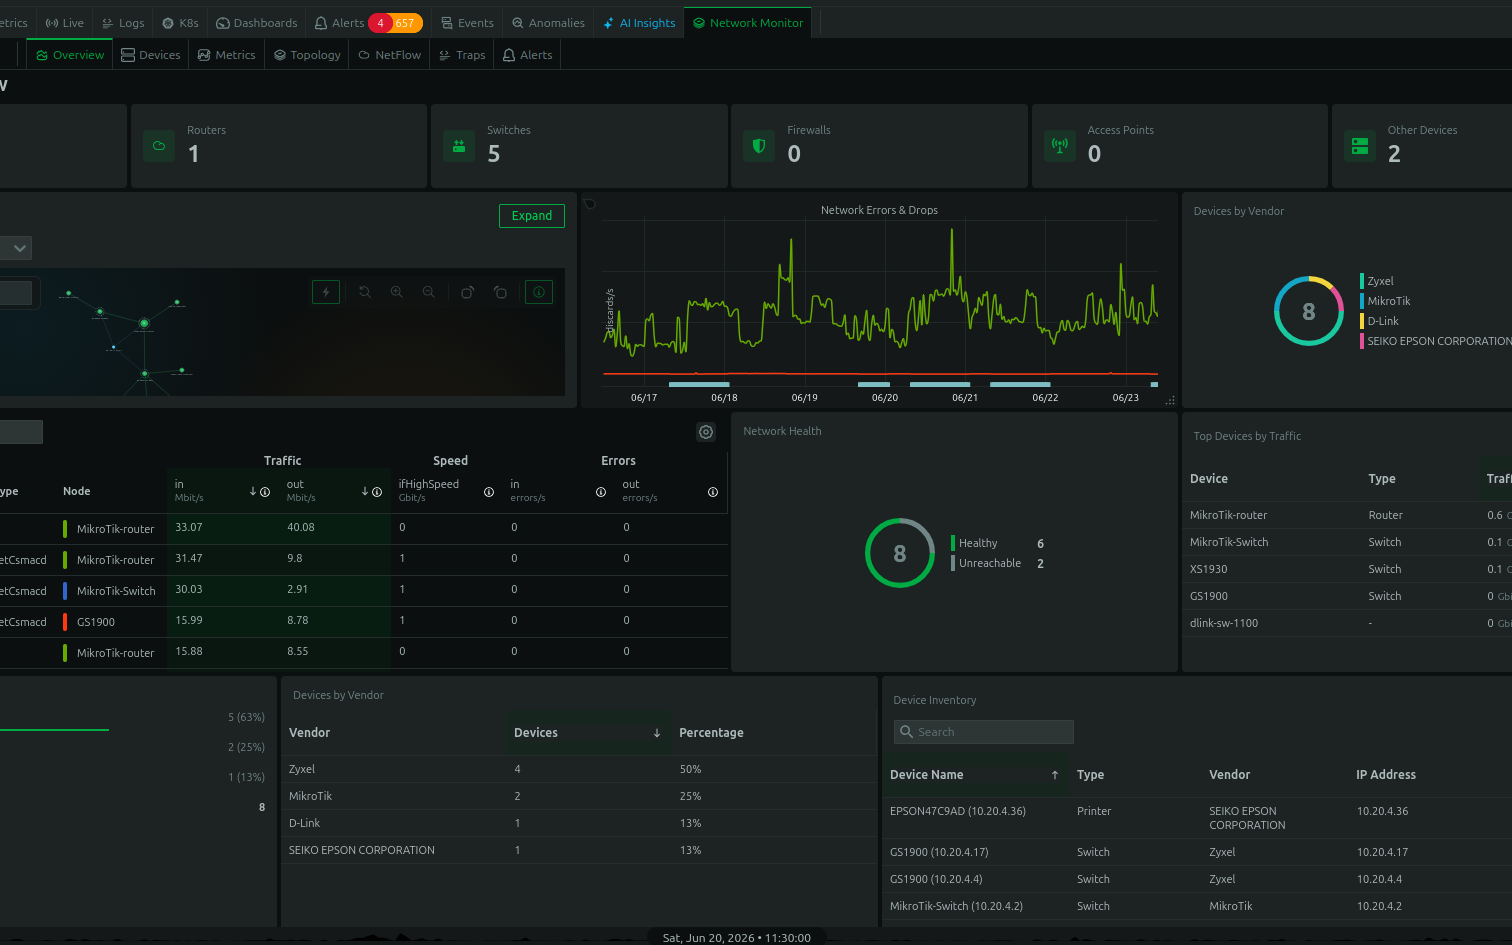
Real-time connection and device maps, built in the agent — no scheduled discovery scans.
SNMP, flows, traps, and topology unified with your full-stack observability.
So many out-of-the-box features! I mostly don't have to develop anything.
— Simon Beginn, LANCOM Systems
Point-and-click troubleshooting. No PromQL, no LogQL, no learning curve.
Enterprise efficiency without enterprise complexity—real ROI from day one.
Zero data egress. Only metadata reaches the cloud. Your metrics stay on your infrastructure.
Auto-discovered and configured. No manual setup required.
Slack, PagerDuty, Teams, email, webhooks—all built-in.
Built for the People Who Get Paged
Every Industry Has Rules. We Master Them.
Monitor Any Technology. Configure Nothing.
Complete Visibility. Total Control.
Don't Take Our Word for It
Government
Falkland Islands Government
99% less downtime, 30% cloud cost reduction
Transportation
TMB Barcelona
"A rare unicorn that obeys the Pareto rule"
Gaming
Nodecraft
Troubleshooting in 30 seconds, not 3 minutes
Technology
Codyas
46% cost reduction, 67% less monitoring staff
Netdata gives more than you invest in it. A rare unicorn that obeys the Pareto rule.
— Eduard Porquet Mateu, TMB Barcelona
Reduced website downtime by 99% and cloud bill by 30% using Netdata alerts.
— Falkland Islands Government
Optimized resource allocation based on Netdata alerts cut cloud spending by 30%.
Reduced monitoring staff by 67% while cutting operational costs by 46%.
— Codyas
Netdata has agent capacity or a plugin for everything, including Windows and Kubernetes.
From 2-3 minutes to 30 seconds—instant visibility into any node issue.
— Matthew Artist, Nodecraft
20% less downtime and 40% budget optimization from out-of-the-box monitoring.
Pay per Node. Unlimited Everything Else.
One price per node. Unlimited metrics, logs, users, and retention. No per-GB surprises.
What's Your Monitoring Really Costing You?
Most teams overpay by 40-60%. Let's find out why.
Your Infrastructure Is Unique. Let's Talk.
Because monitoring 10 nodes is different from monitoring 10,000.
Monitoring That Sells Itself
Deploy in minutes. Impress clients in hours. Earn recurring revenue for years.
Per-Second Metrics at Homelab Prices
Same engine, same dashboards, same ML. Just priced for tinkerers.
$1,000 Per Referral. Unlimited Referrals.
Your colleagues get 10% off. You get 10% commission. Everyone wins.
"Netdata's significant positive impact" — LANCOM Systems
Compare vs Datadog, Grafana, Dynatrace
"Cut costs by 46%, staff by 67%" — Codyas
"Reduced cloud bill by 30%" — Falkland Islands Gov
"Better observability with Netdata than combining other tools." — TMB Barcelona
DPA, SLAs, on-prem, volume pricing
One command, 30 seconds, real data—no sandbox needed
Auto-config + per-node pricing = predictable profit
8-episode Netdata tutorial by LearnLinux.tv
3rd most starred monitoring project
Customers report 40-67% cost cuts, 99% downtime reduction
Free tier lets them try before they buy
AI Support Assistant, Available 24/7
Nedi has access to all official documentation, source code, and resources. Ask any question about Netdata—responds in your language.
Engineering Insights & Product Updates
Jul 2026
Native macOS Monitoring: Logs, Sensors, …
We’ve overhauled macOS monitoring in …
Jun 2026
Fleet Observability: Linux Edge Device …
It feels less like managing devices and more …
Real Time Network Monitoring: Topology, …
Interface counters tell you a port is busy. …
5 Best SolarWinds Alternatives for 2026
As organizations modernize their …
Never Fight Fires Alone
Docs, community, and expert help—pick your path to resolution.
60 Seconds to First Dashboard
One command to install. Zero config. 850+ integrations documented.
Level Up Your Monitoring
76,000+ Engineers Strong
Per-Second. 90% Cheaper. Data Stays Home.
See why teams switch from Datadog, Prometheus, Grafana, and more.
Trace issues directly in the source code
Get architecture recommendations
Real-time operational status, incident history, and uptime for all Netdata Cloud services.
Copy, paste, monitoring in 60 seconds
Every collector documented
PostgreSQL, NGINX, K8s, and more
Maturity model and implementation
76k+ stars and growing daily
Engineers helping engineers
Netdata is modern, fast, full-stack observability with per-second metrics, AI-powered troubleshooting, and predictable pricing.
One of the most popular open-source monitoring projects
Enterprise-grade security and compliance
Your metrics stay on your infrastructure
"Most energy-efficient monitoring solution" — ICSOC 2023, peer-reviewed
"Doesn't miss alerts—mission-critical trust for safety software"
Global community improving monitoring for everyone
Trusted by teams worldwide
Free forever, fully open source agent
Work from anywhere, async-friendly culture
Your work helps millions of systems
March 4–5, London, UK
February 13, Bengaluru, India
November 17–19, Las Vegas
Pricing, volume discounts, and enterprise needs
Docs, community, and expert help
Continuous compliance monitoring by Drata. View our live security posture and audit reports.
Performance optimization starts with measuring where time and resources go. This hub groups Netdata's blog posts on the subject, from reading Linux CPU, load and pressure metrics to shortening investigations with automated troubleshooting.
Turn observability data into strategic intelligence with automated summaries, forecasts, and AI-driven incident analysis from Netdata. Read more now!
Diagnose and resolve sustained CommitLog PendingTasks in Apache Cassandra, where commitlog fsync bottlenecks delay write acknowledgments and cascade into dropped mutations.
Diagnose and resolve long G1 stop-the-world pauses in Cassandra before they trigger gossip failures and client timeouts.
Size the JVM heap and tune G1GC for Cassandra 4.x and 5.x to avoid GC pauses, gossip flapping, and the death spiral.
Diagnose and mitigate hot partitions in Apache Cassandra when a single key concentrates traffic, saturating replicas and spiking tail latency.
Operational guide to diagnosing and stopping ClickHouse active part count growth before it triggers insert delays, throttling, or too-many-parts errors.
Diagnose why ClickHouse queries scan every row and how to fix partition pruning and primary key misalignment.
Troubleshoot ClickHouse error code 241 when per-query memory limits breach, including high-cardinality GROUP BY, unbounded DISTINCT, and Cartesian-product JOINs.
Why ALTER UPDATE/DELETE mutations starve the merge pool, how to spot the starvation before parts explode, and what to do about it.
Diagnose and fix ClickHouse P99 query latency spikes caused by tail latency, hot shards, cold data, and resource contention.
Understand how single-row and micro-batch inserts create part accumulation in ClickHouse, the signals that expose the pattern, and the client-side fixes that actually work.
Diagnose a growing Pebble compaction backlog in CockroachDB before it triggers write stalls, and learn how to restore balance between write ingestion and compaction throughput.
How to detect hot ranges in CockroachDB using per-node CPU asymmetry, the DB Console Hot Ranges page, and crdb_internal.ranges queries_per_second.
Diagnose and resolve CockroachDB Pebble write stalls when the storage engine pauses writes due to LSM compaction debt.
Diagnose and eliminate CockroachDB writetooold transaction restarts caused by hot keys, sequential writes, and wide transactions under SERIALIZABLE isolation.
Diagnose and fix CockroachDB RETRY_SERIALIZABLE errors by distinguishing writetooold, readwithinuncertainty, and txnpush causes and implementing proper retry logic.
Diagnose and fix Elasticsearch coordinating node overload caused by aggregation merges, heap spikes, and circuit breaker trips that return HTTP 429.
Find and fix Elasticsearch queries that burn CPU and heap. Covers leading wildcards, regex, deep pagination, scripts, and the diagnostic signals that expose them.
Diagnose and fix Elasticsearch merge storms caused by segment explosion, I/O saturation, and aggressive refresh intervals.
Clients time out but HAProxy looks perfectly healthy. How to detect and fix Linux accept-queue overflow (ListenOverflows, ListenDrops, somaxconn) in front of HAProxy.
Understand when ClickHouse server-side async insert buffering genuinely reduces part creation versus when it silently relocates too-many-parts risk into an in-memory buffer.
Diagnose and fix low NetworkProcessorAvgIdlePercent in Kafka, including network thread saturation from TLS handshakes, connection storms, and large fetch responses.
Practical guides for running, troubleshooting, and monitoring Microsoft SQL Server in production.
Size the WiredTiger cache to fit your working set. Covers default calculations, explicit overrides, container limits, and the signals that warn you before eviction stalls.
Fix MongoDB aggregation pipeline errors when $group or $sort hit the 100MB memory limit, diagnose disk spills, and restructure pipelines for production stability.
Find and terminate long-running MongoDB operations that are blocking others by holding WiredTiger tickets, using currentOp, killOp, and related diagnostic signals.
Diagnose MongoDB MaxTimeMSExpired errors. Understand why maxTimeMS kills operations, how to distinguish server-side timeouts from client socket timeouts, and how to find root causes with currentOp and the slow query log.
Practical guides for running, troubleshooting, and monitoring MongoDB in production.
Diagnose and fix sustained high page fault rates in MongoDB when the working set exceeds both WiredTiger cache and OS page cache after warmup.
Diagnose and fix MongoDB collection scans (COLLSCAN) that cause slow queries by identifying missing indexes, query plan regressions, and inefficient predicates.
Diagnose and fix MongoDB WiredTiger ticket exhaustion when read or write tickets approach zero and operations queue.
Learn why WiredTiger dirty ratio is a stronger leading indicator than cache fill, how to diagnose it before latency spikes, and what to fix.
Diagnose unexpected full table scans in MySQL by correlating Handler_read_rnd_next step-changes with Slow_queries, then isolate the offending query and fix the index coverage.
Understand how InnoDB purge lag works, why the history list length grows, and how MVCC read views turn a single idle transaction into fleet-wide slowdown.
Diagnose and fix InnoDB redo log checkpoint stalls that synchronously freeze all MySQL writes when checkpoint age exceeds redo capacity.
Diagnose InnoDB row lock contention in MySQL 8.0+ and 5.7 by mapping blocking transactions with performance_schema.data_lock_waits, sys.innodb_lock_waits, and the right status metrics.
Operational guide to sizing MySQL's InnoDB buffer pool, the 60-80% RAM heuristic, alignment constraints, and the container and memory gotchas that make it fail.
Size the MySQL InnoDB redo log to avoid checkpoint stalls. Covers 8.0.30+ dynamic capacity, headroom calculations, and flush tuning.
Diagnose and fix sudden MySQL query slowdowns caused by bad execution plans after deployments, ANALYZE TABLE, schema changes, or upgrades.
Diagnose and fix MySQL commit latency when CPU is idle but transactions stall on redo log and binary log fsync pressure.
Diagnose MySQL slow queries when Slow_queries climbs, the slow log is disabled, or long_query_time hides real problems. Read-only checks, ratio analysis, and targeted fixes.
Interpret NGINX stub_status Reading, Writing, and Waiting states to distinguish healthy keepalive reuse from slow clients, slow upstreams, and connection exhaustion.
Detect, diagnose, and prevent NGINX connection exhaustion before it causes cliff-edge timeouts. Covers worker_connections limits, kernel accept queues, keepalive pileup, and upstream slowdown.
Detect when NGINX workers saturate CPU on TLS handshakes and tune session caching, protocol version, and connection reuse to recover throughput.
How to size NGINX worker_processes and worker_connections for production traffic, including the reverse-proxy multiplier, FD chain, and headroom rules.
Understand why nginx buffers client request bodies to temporary files, how client_body_buffer_size controls the threshold, and when to tune or disable buffering for streaming uploads.
Configure per-table autovacuum thresholds, memory, and I/O throttling to control bloat and freeze progress on high-churn PostgreSQL tables.
Detect and fix PostgreSQL checkpoint storms before they stall your queries. Covers forced vs timed checkpoints, max_wal_size tuning, and safe tuning tradeoffs.
Detect B-tree index bloat in PostgreSQL using pgstatindex and recover online with REINDEX CONCURRENTLY without locking the table.
Detect missing indexes in PostgreSQL using pg_stat_user_tables, pg_stat_statements, auto_explain, and HypoPG without disrupting production.
A practical troubleshooting guide for diagnosing PostgreSQL slow queries using pg_stat_statements, log_min_duration_statement, auto_explain, and execution plan analysis.
Diagnose and fix frequent PostgreSQL checkpoints. Learn when to raise max_wal_size, adjust checkpoint_timeout, and spread I/O with checkpoint_completion_target.
Learn to read PostgreSQL EXPLAIN ANALYZE output like an SRE. Understand actual versus estimated rows, buffer hits, the loops multiplier, and common misreadings that waste tuning effort.
Diagnose and fix Redis latency caused by oversized keys and O(N) commands blocking the single-threaded event loop.
Diagnose Redis main-thread CPU saturation. Learn why single-threaded command execution creates a linear latency ramp, which metrics expose it, and how to relieve the bottleneck.
How Redis maxmemory eviction policies work, when each policy is the right choice, and how to detect when the wrong policy is causing silent failures or OOM write rejections.
Diagnose and fix Redis production outages caused by the KEYS command blocking the single-threaded event loop, and replace it with SCAN.
Diagnose and fix elevated Redis fork latency caused by Transparent Huge Pages, NUMA misconfiguration, and memory overcommit issues.
Diagnose and break the Redis memory pressure spiral where eviction, cache misses, and re-population writes feedback into each other.
SQL Server at 100% CPU is not automatically an incident. Learn how to split SQL Server CPU from other-process CPU, tell legitimate load from a bad plan, and alert on the signals that actually matter.
How to read CXPACKET and CXCONSUMER wait stats in SQL Server, when high values are normal, and how to fix the real causes: skewed parallel work, missing indexes, and bad MAXDOP or cost threshold defaults.
Diagnose high %CSTP on multi-vCPU VMs: vCPU oversizing, NUMA boundary crossing, snapshot-induced co-stop, and the relaxed co-scheduling trap that makes any visible value more severe than it looks.
How to diagnose and fix CPU limit throttling (%MLMTD) in vSphere, where a set-and-forgotten MHz cap silently degrades VMs that look healthy on ready time.
Diagnose and fix high CPU ready time in vSphere, where VMs are starved for pCPU time while guest OS CPU utilization appears low.
A practical guide to using docker buildx- multi-stage builds- and remote cache backends for lightning-fast container builds
A deep dive into how the query planner thinks and how to leverage new features for smarter- faster queries
How a single SQL clause can transform your database into a high-throughput- parallel-processing task queue
A deep dive into tuning NGINX rate limits to protect your origin without accidentally rejecting legitimate users
Learn to interpret load average correctly and use tools like iostat and vmstat to find the root cause of system performance issues
A deep dive into nginx buffering keepalive timeouts and how they can silently trigger 500 502 and 504 errors in your infrastructure
A deep dive into the causes of consumer lag- how to monitor it- and how to tune your Kafka consumers for optimal performance
A practical checklist to help you find and fix common NGINX issues yourself
How holding locks for milliseconds longer can cripple your database- and how to prove it with a repeatable benchmark
Understanding the automatic memory management that powers the JVM
A deep dive into Nodejs memory management- common leak causes- detection tools- and proactive strategies to keep your applications running smoothly.
Unlock peak database efficiency and reliability with proven strategies for performance tuning and optimization- Say goodbye to bottlenecks and hello to speed.
Balancing data integrity and query performance in database design
The essential technical foundation for building and scaling online stores
Mastering Disk Performance for Optimal System Health
A step-by-step guide for developers and SREs to troubleshoot and resolve CPU performance bottlenecks
A Beginner’s Guide to Optimizing MongoDB Performance
Essential Tweaks To Boost Your Windows PC
Why Cardinality Is Key To Database Performance
A Beginner's Guide to Understanding and Implementing Continuous Profiling in Your Software Monitoring Strategy
Learn everything about monitoring & troubleshooting MySQL, what metrics are important to monitor and why, and how to monitor MySQL with Netdata.
Learn everything about monitoring & troubleshooting PHP-FPM, what metrics are important to monitor and why, and how to monitor PHP-FPM with Netdata.
Find out about monitoring & troubleshooting PostgreSQL, what metrics are important to monitor and why, and how to monitor PostgreSQL with Netdata.
Simplifying Complex Monitoring for a Hybrid Infrastructure
Enhanced observability and real time metric correlation
See how Kubernetes CPU throttling impacts your workloads — and how to monitor, troubleshoot, and fix it. Includes a live stress test of a K8s cluster with real results.
Ask Netdata Anything, Get an Expert Analysis in Minutes
Infrastructure Intelligence for the Modern Enterprise
Tips and Tricks for Efficient Monitoring with Netdata
Detailed case study and performance analysis
Strategies For Enhancing Cloud Performance & Cost Efficiency
Proactive Strategies for Disk Health and Performance
Optimizing Memory Usage
Diving Deep into Kernel Memory for System Optimization
Navigating The Complexities Of Multitasking Environments
Analyzing CPU Usage to Optimize System Performance
Managing Swap to Optimize System Performance
Tracking Kernel Samepage Merging for Optimized Memory Use
Strategies for Maintaining Optimal Database Health and Performance
A Game-Changer for DevOps and Developers
Simplifying Database Optimization for Improved Performance
Addressing Performance Hiccups in Kubernetes Deployments
See how Netdata can improve visibility, reduce downtime, and simplify monitoring — no commitment required.