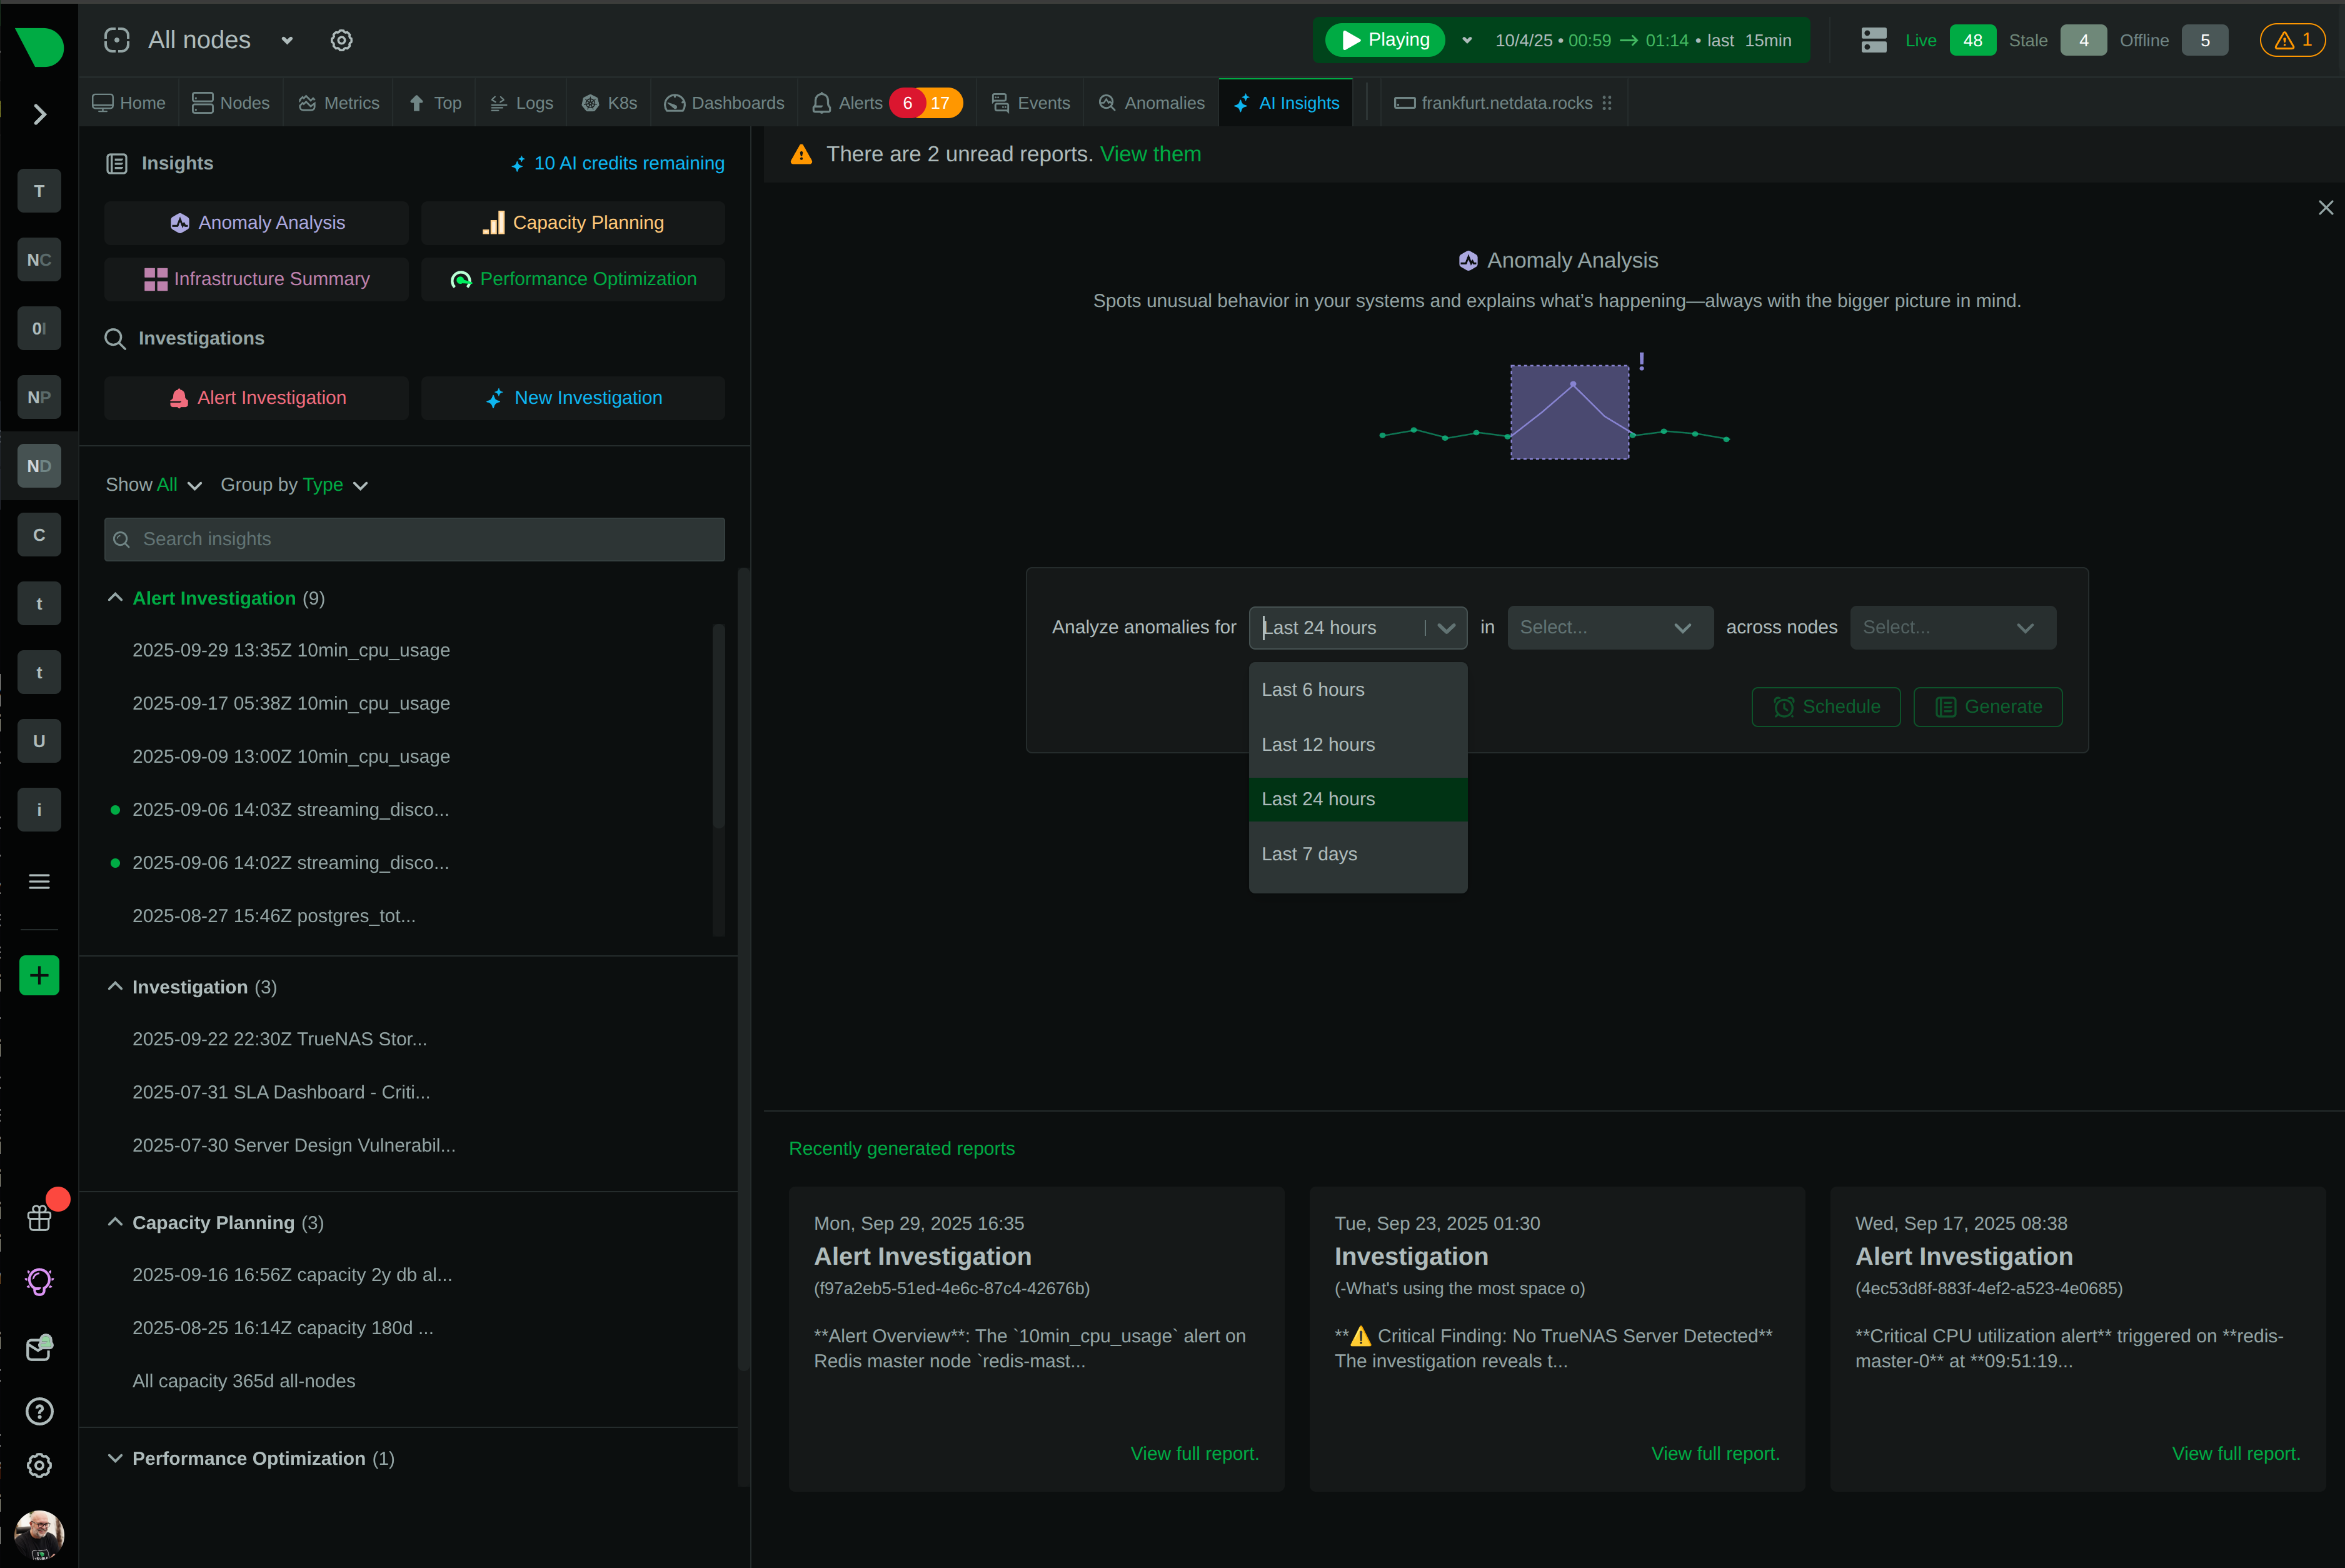
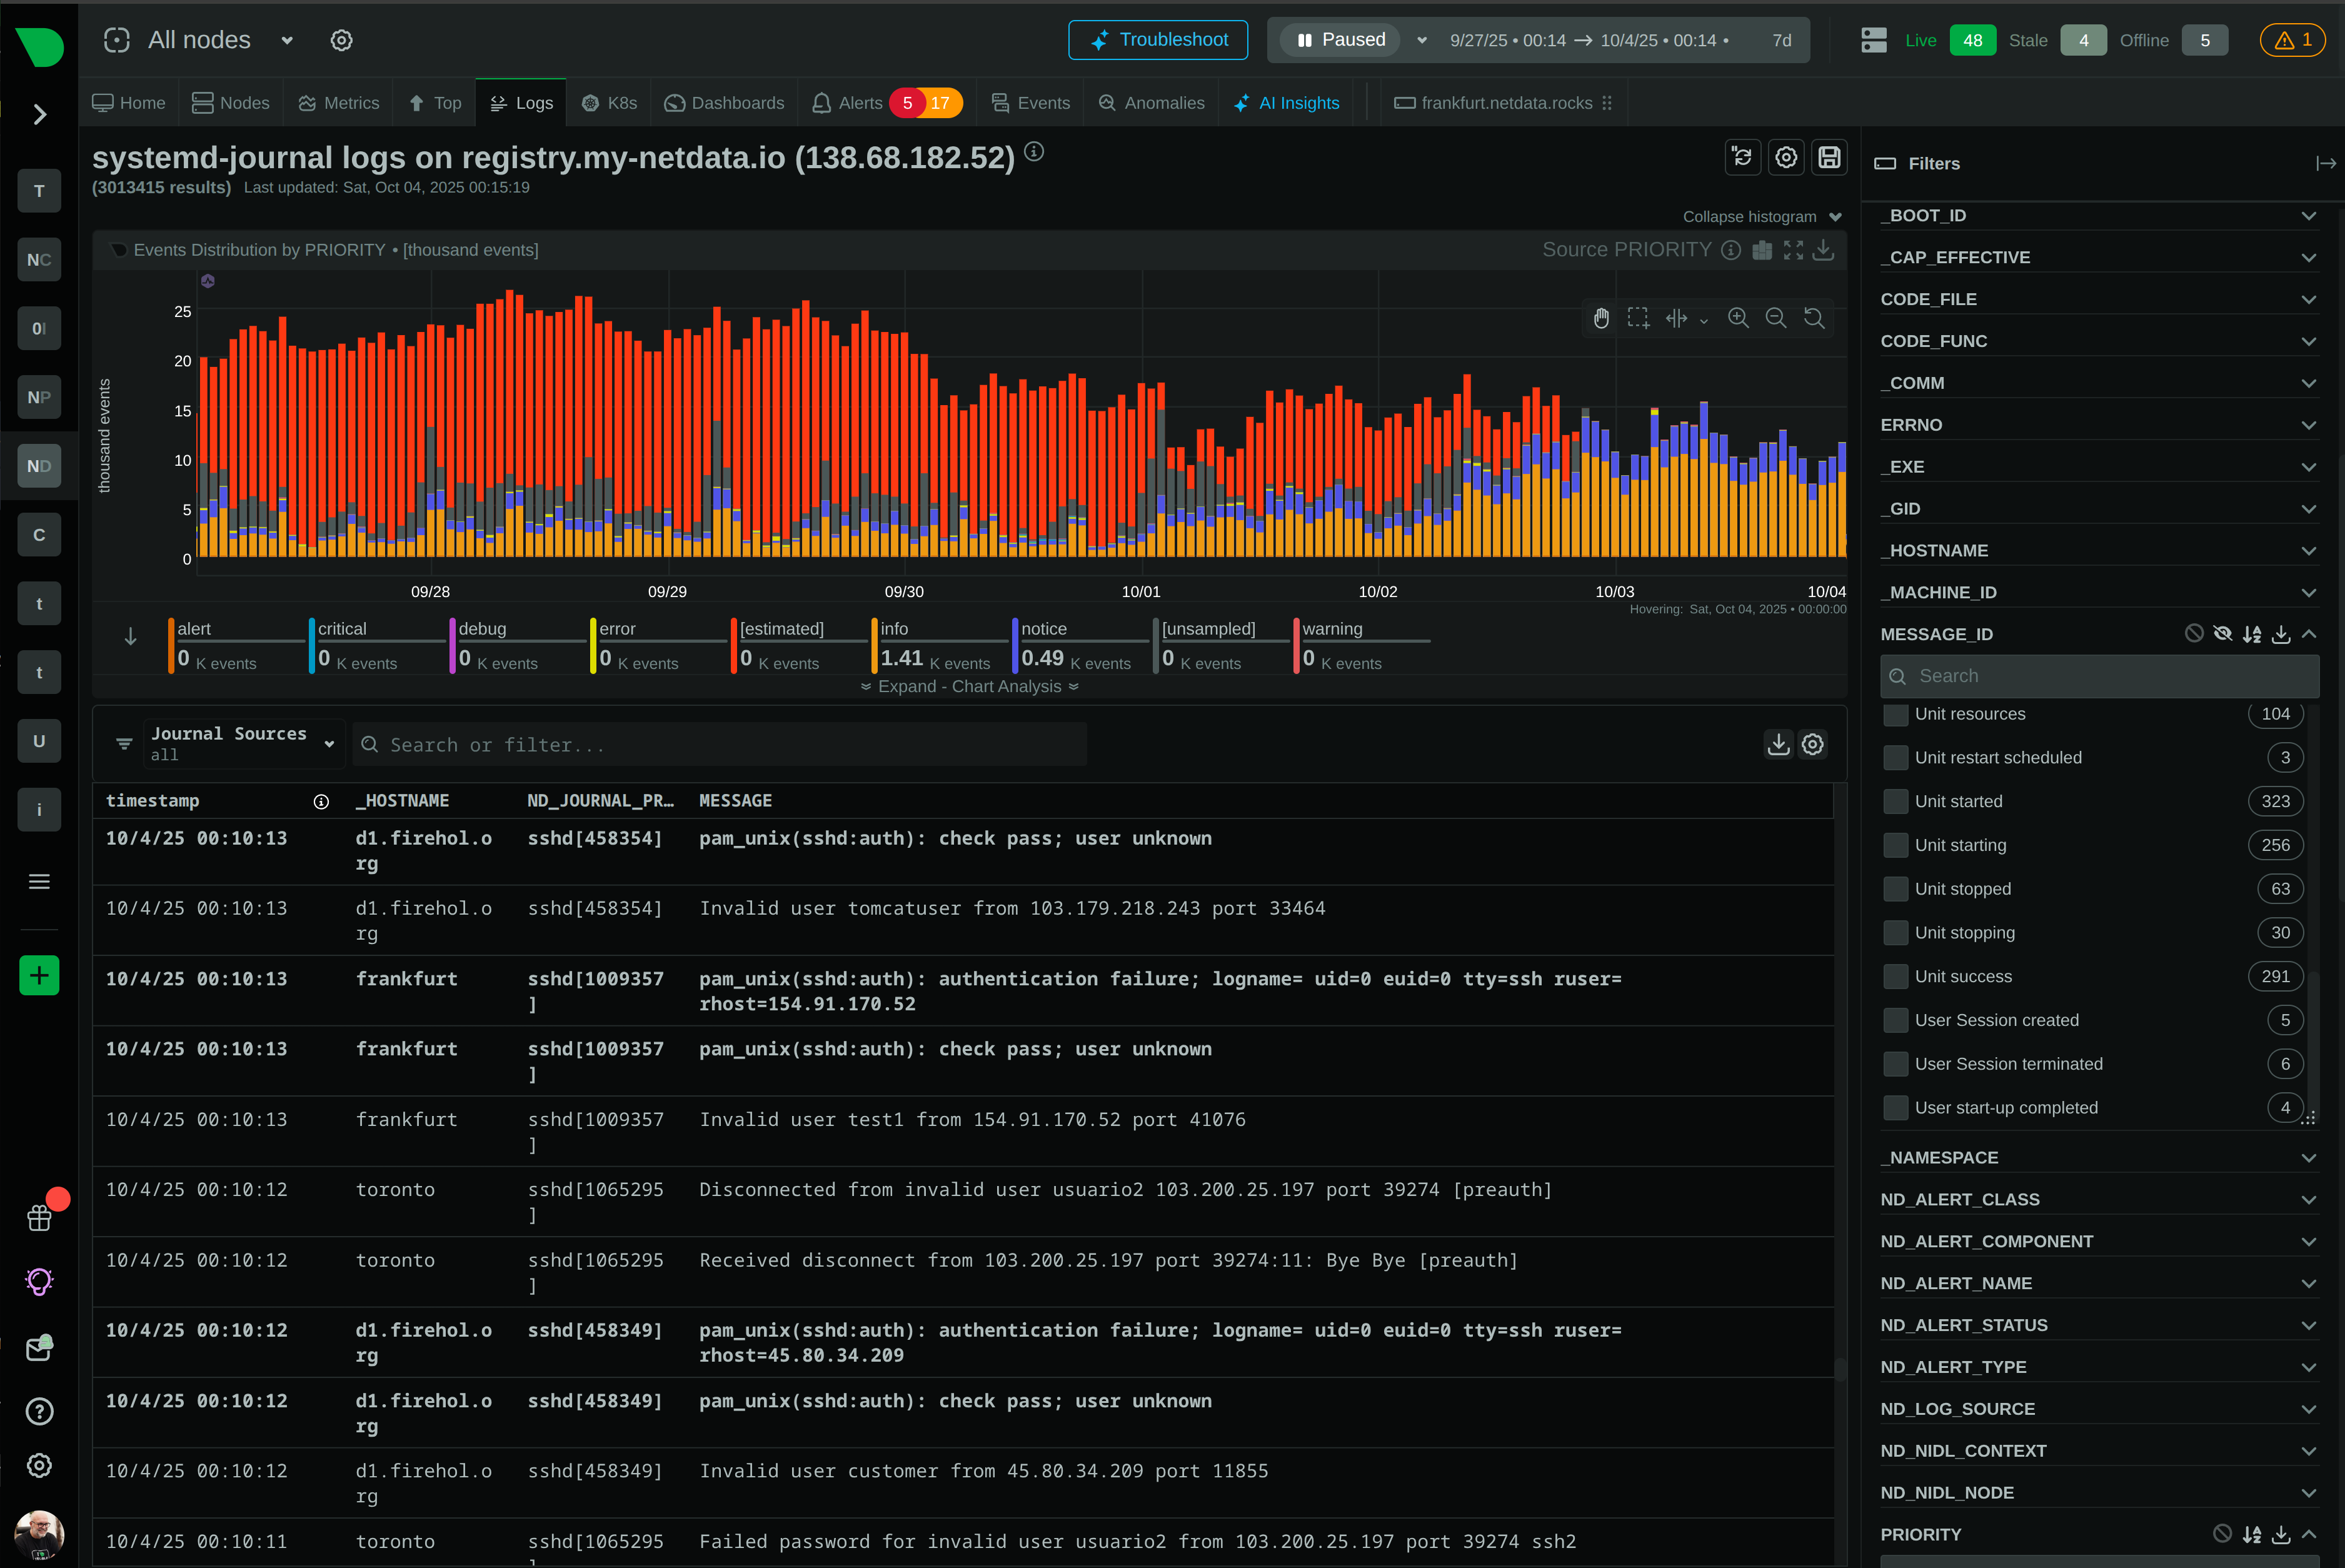
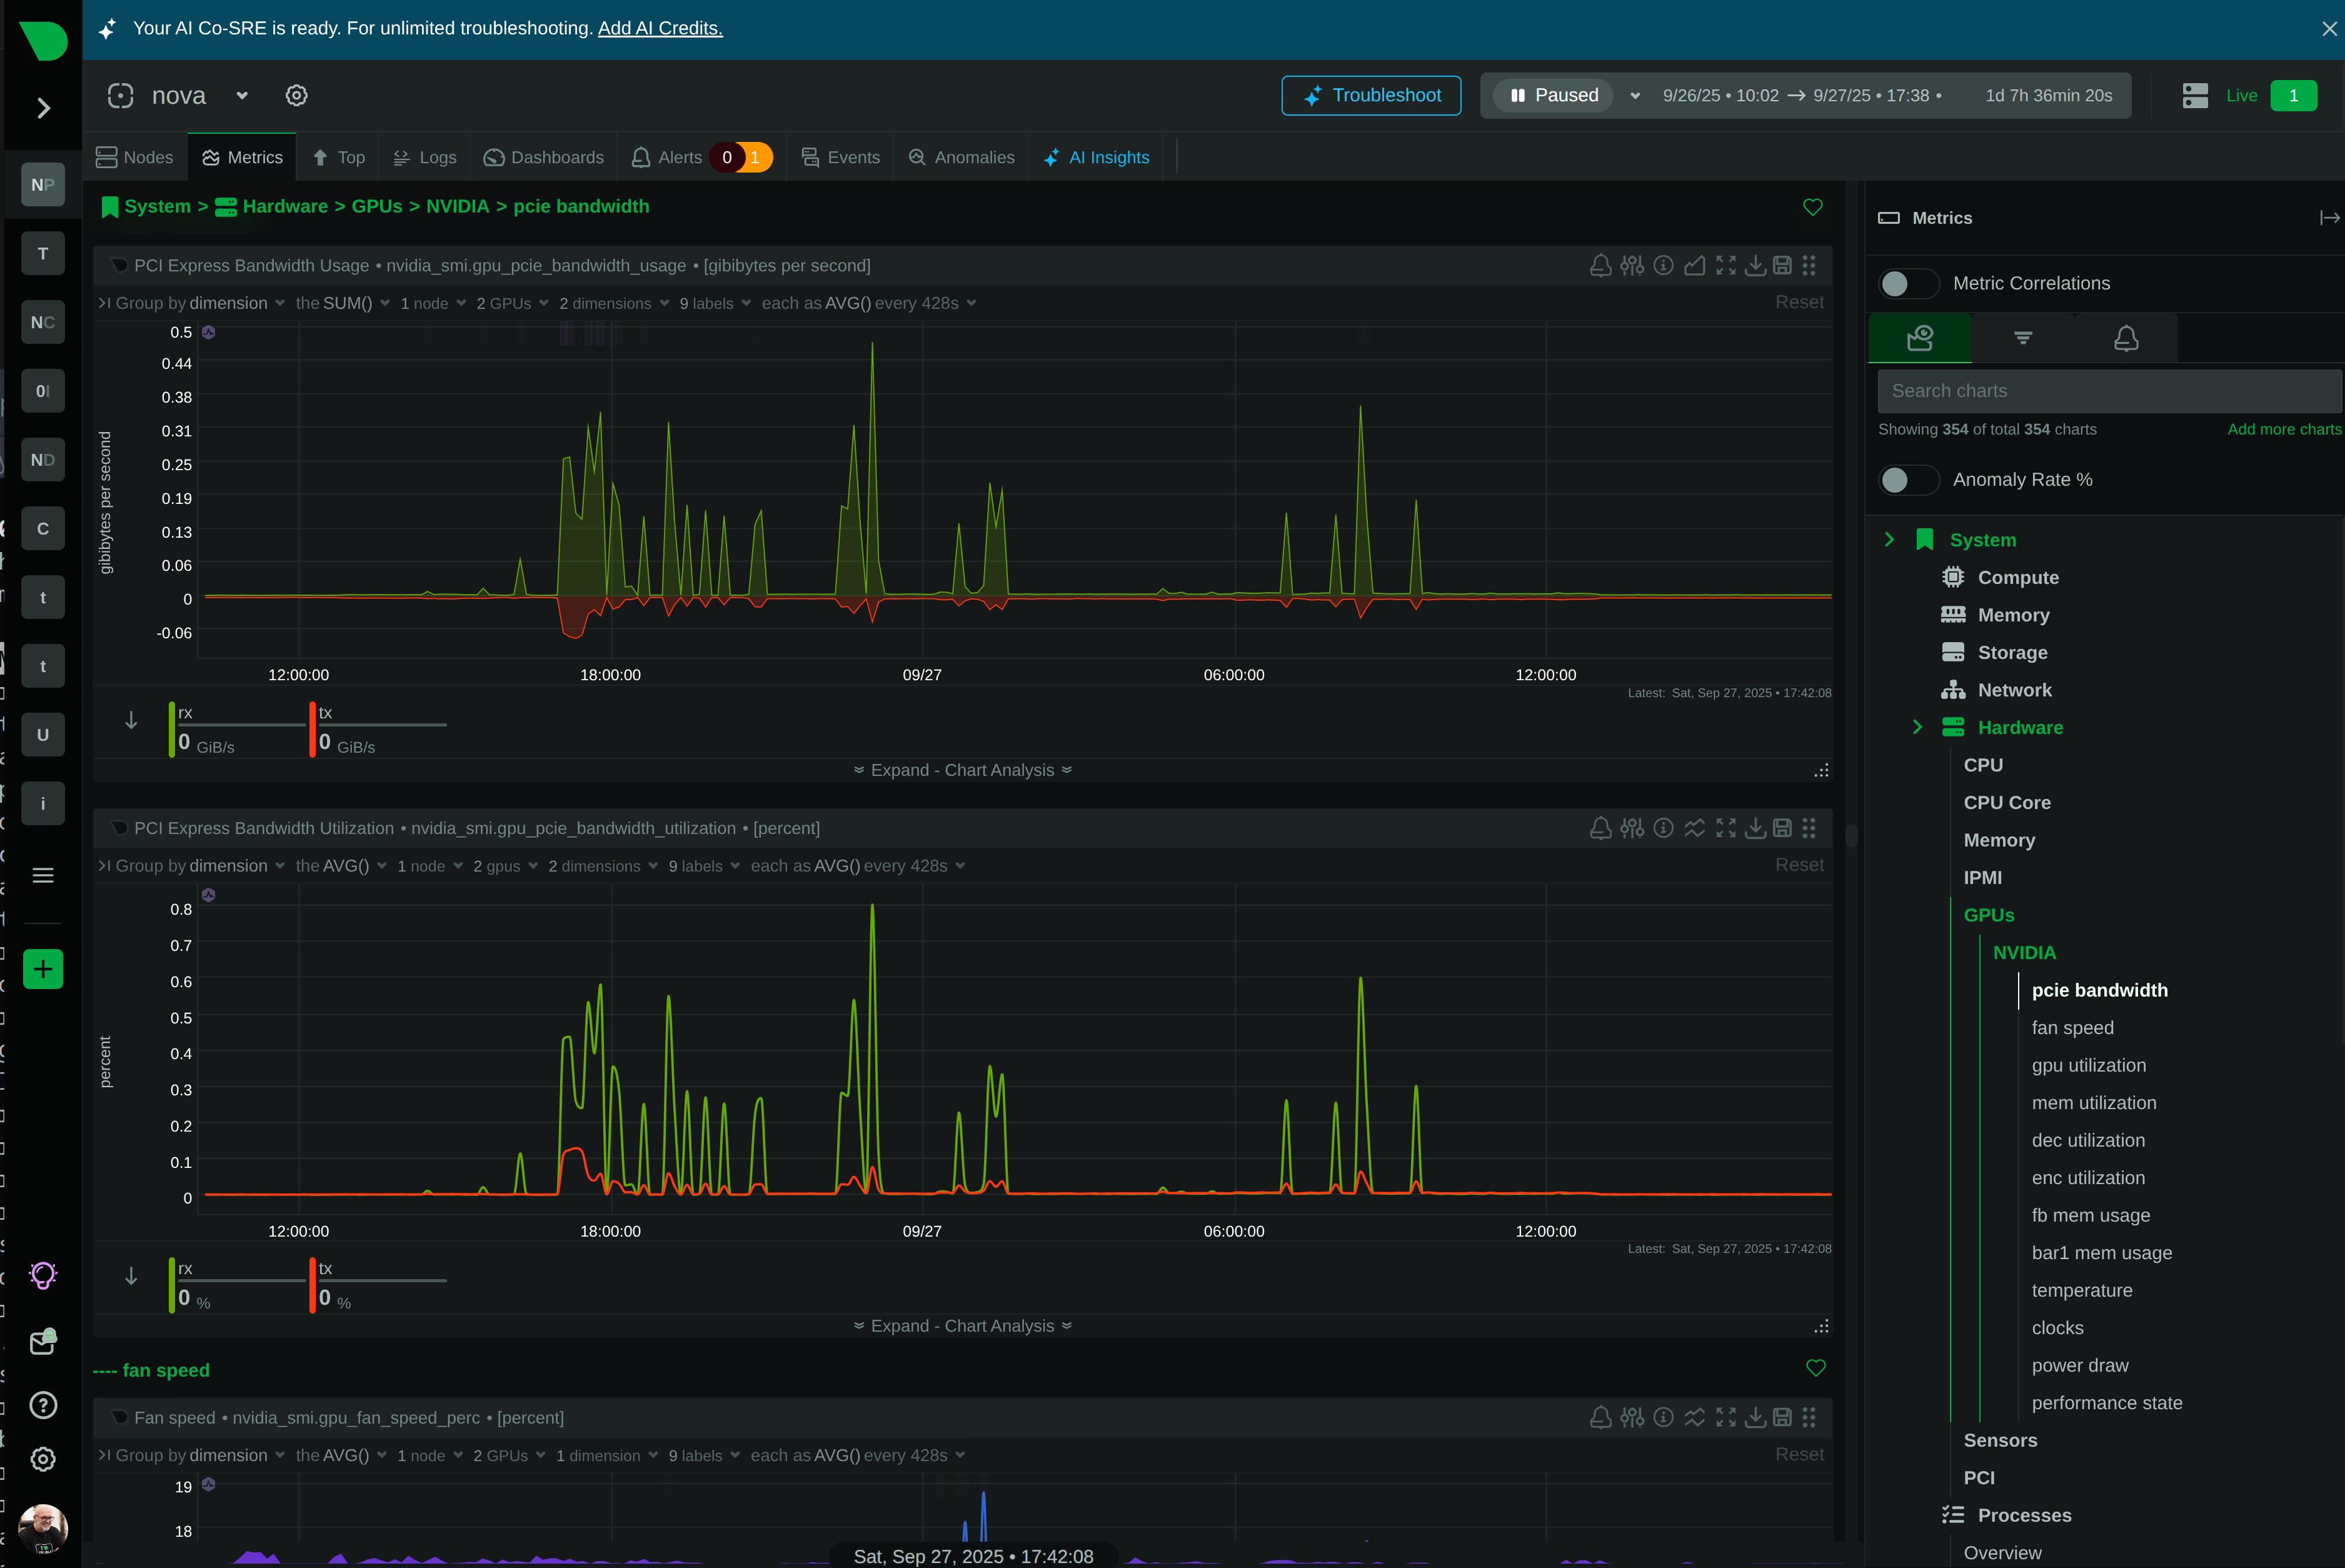
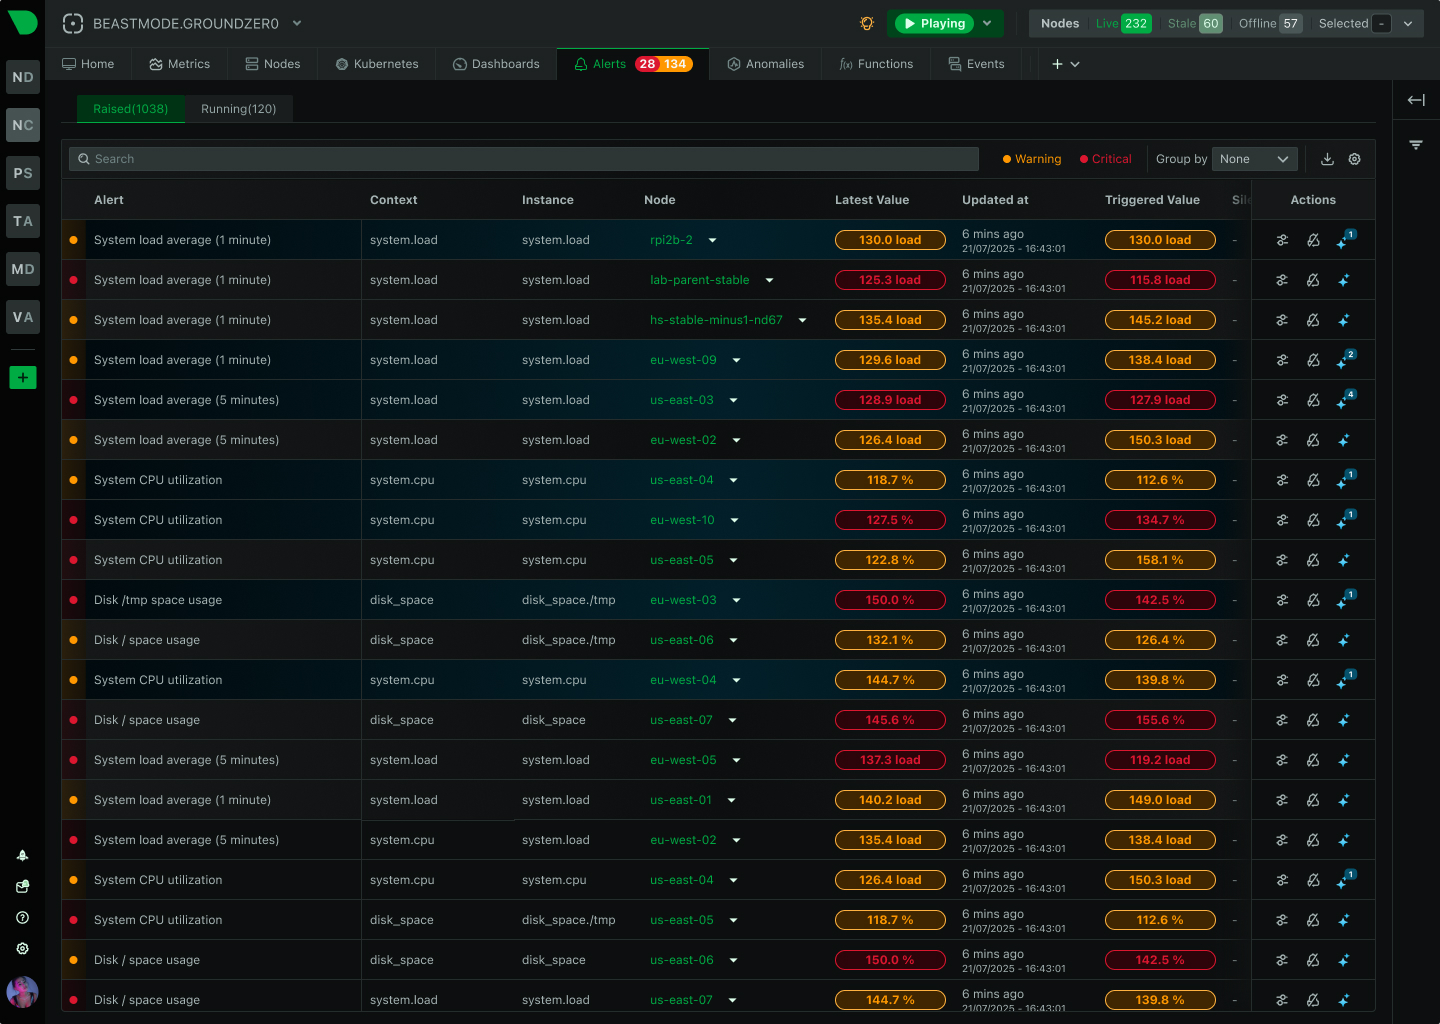
Autonomous Monitoring with self-learning AI built-in, operating independently across your entire stack.
Aggregate metrics from multiple agents into centralized Parent nodes for unified monitoring across your infrastructure.
Access your monitoring data from anywhere with our SaaS platform. No infrastructure to manage, automatic updates, and global availability.
Run the full Netdata Cloud platform on-premises for complete data sovereignty and compliance with your security policies.
Modern, responsive UI built for real-time troubleshooting with customizable dashboards and advanced visualization capabilities.
Native iOS and Android apps bring full monitoring capabilities to your mobile device with real-time alerts and notifications.
Best energy efficiency
True real-time per-second
100% automated zero config
Centralized observability
Multi-year retention
High availability built-in
Zero maintenance
Always up-to-date
Enterprise security
Complete data control
Air-gap ready
Compliance certified
Millisecond responsiveness
Infinite zoom & pan
Works on any device
Native performance
Instant alerts
Monitor anywhere
800+ collectors and notification channels, auto-discovered and ready out of the box.
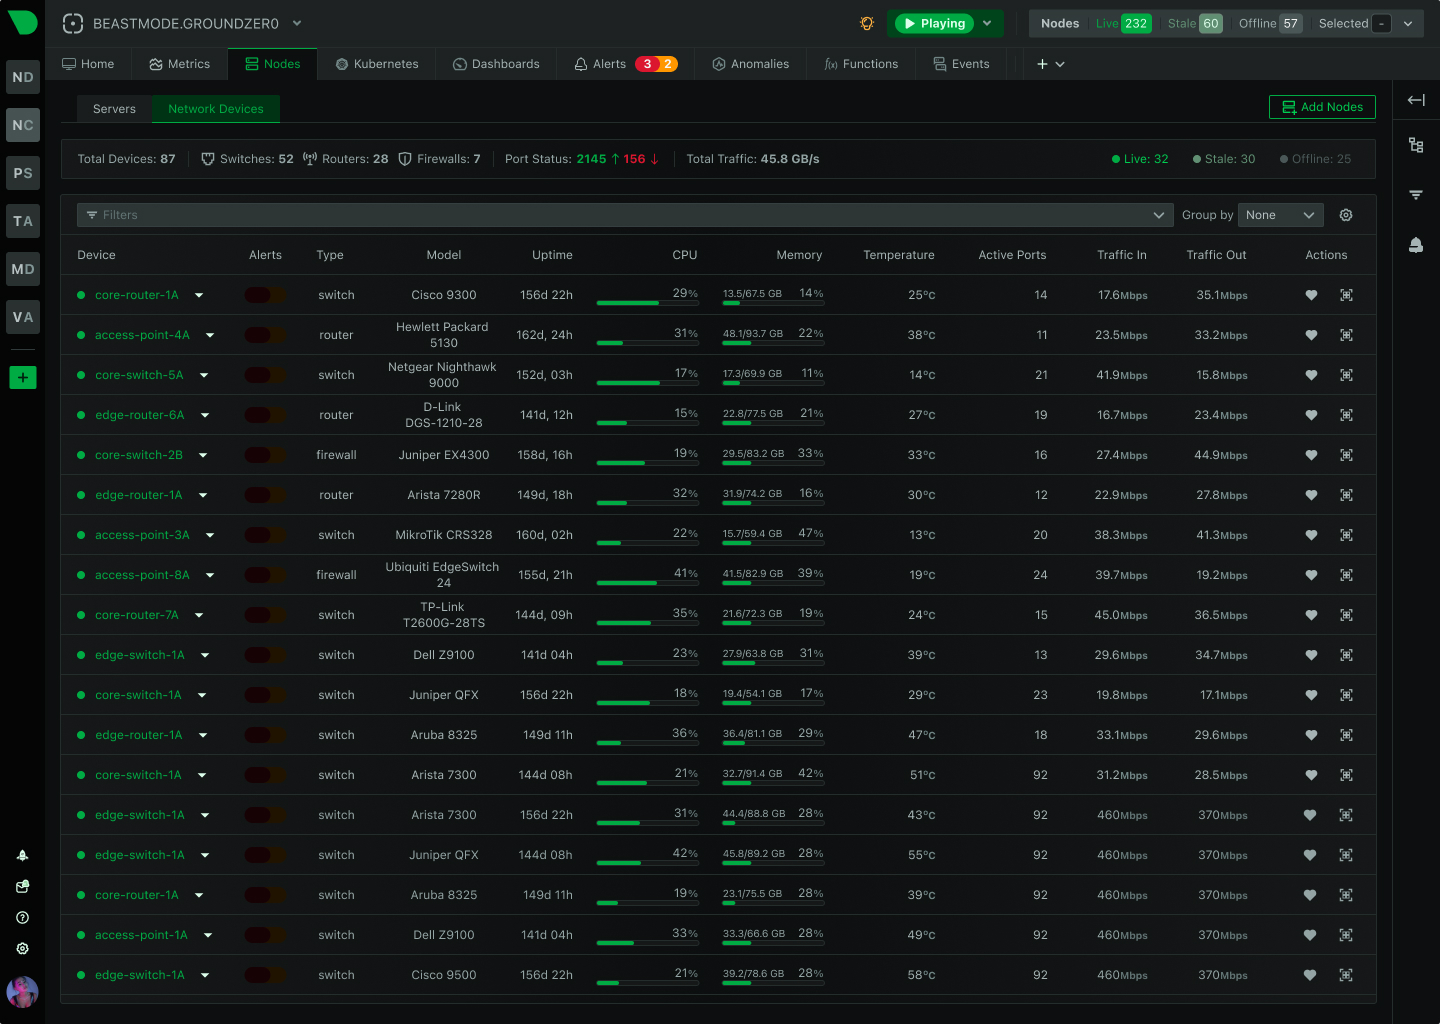
Connect any MCP-compatible AI to your observability data. Automate workflows, playbooks, and incident response.
AWS, GCP, Azure—unified observability across all providers.
On-prem and cloud infrastructure in a single view.
Your metrics stay on your infrastructure. Always.
Reduced monitoring costs by 46% while cutting staff overhead by 67%.
— Leonardo Antunez, Codyas
No data shipping. No central storage costs. Query at the edge.
So many out-of-the-box features! I mostly don't have to develop anything.
— Simon Beginn, LANCOM Systems
Point-and-click troubleshooting. No PromQL, no LogQL, no learning curve.
Enterprise efficiency without enterprise complexity—real ROI from day one.
Zero data egress. Only metadata reaches the cloud. Your metrics stay on your infrastructure.
Auto-discovered and configured. No manual setup required.
Slack, PagerDuty, Teams, email, webhooks—all built-in.
Government
99% less downtime, 30% cloud cost reduction
Transportation
"A rare unicorn that obeys the Pareto rule"
Gaming
Troubleshooting in 30 seconds, not 3 minutes
Technology
46% cost reduction, 67% less monitoring staff
Netdata gives more than you invest in it. A rare unicorn that obeys the Pareto rule.
— Eduard Porquet Mateu, TMB Barcelona
Reduced website downtime by 99% and cloud bill by 30% using Netdata alerts.
— Falkland Islands Government
Optimized resource allocation based on Netdata alerts cut cloud spending by 30%.
Reduced monitoring staff by 67% while cutting operational costs by 46%.
— Codyas
Netdata has agent capacity or a plugin for everything, including Windows and Kubernetes.
From 2-3 minutes to 30 seconds—instant visibility into any node issue.
— Matthew Artist, Nodecraft
20% less downtime and 40% budget optimization from out-of-the-box monitoring.
One price per node. Unlimited metrics, logs, users, and retention. No per-GB surprises.
Most teams overpay by 40-60%. Let's find out why.
Because monitoring 10 nodes is different from monitoring 10,000.
Deploy in minutes. Impress clients in hours. Earn recurring revenue for years.
Same engine, same dashboards, same ML. Just priced for tinkerers.
Your colleagues get 10% off. You get 10% commission. Everyone wins.
"Netdata's significant positive impact" — LANCOM Systems
Compare vs Datadog, Grafana, Dynatrace
"Cut costs by 46%, staff by 67%" — Codyas
"Reduced cloud bill by 30%" — Falkland Islands Gov
"Better observability with Netdata than combining other tools." — TMB Barcelona
DPA, SLAs, on-prem, volume pricing
One command, 30 seconds, real data—no sandbox needed
Auto-config + per-node pricing = predictable profit
"We tested every monitoring system under the sun." — Benjamin Gabler, CEO Rocket.Net
3rd most starred monitoring project
Customers report 40-67% cost cuts, 99% downtime reduction
Free tier lets them try before they buy
Dec 2025
Netdata has an incredibly powerful alerting …
Bullshit and nonsense. But let’s take …
Nov 2025
The observability market is facing a paradox. …
When a critical alert fires at 2 AM, the last …
Docs, community, and expert help—pick your path to resolution.
One command to install. Zero config. 850+ integrations documented.
Watch real-time monitoring in action—demos, tutorials, and engineering deep dives.
See why teams switch from Datadog, Prometheus, Grafana, and more.
"Troubleshooting in 30 seconds instead of 2–3 minutes" — Nodecraft
2k+ members, real-time help
Copy, paste, monitoring in 60 seconds
Every collector documented
Full platform in one video
Install to dashboard in 2 minutes
PostgreSQL, NGINX, K8s, and more
Maturity model and implementation
76k+ stars and growing daily
Engineers helping engineers
Netdata is modern, fast, full-stack observability with per-second metrics, AI-powered troubleshooting, and predictable pricing.
One of the most popular open-source monitoring projects
Enterprise-grade security and compliance
Your metrics stay on your infrastructure
"Most energy-efficient monitoring solution" — ICSOC 2023, peer-reviewed
"Doesn't miss alerts—mission-critical trust for safety software"
Global community improving monitoring for everyone
Trusted by teams worldwide
Free forever, fully open source agent
Work from anywhere, async-friendly culture
Your work helps millions of systems
Dec 9–11, Las Vegas · Booth #636
Audited security controls
Data stays on your infrastructure
Netdata delivers real-time AIOps with per-second insights, edge-native ML, and AI-driven root cause analysis without configuration or surprises. Read more!
Get 400+ intelligent alerts in 60 seconds with component-level precision, edge-native reliability, and AI-accelerated investigations. Read more now!
Get instant, automated infrastructure visibility with per-second metrics, built-in ML, and zero manual configuration for any environment. Read more now!
Netdata’s Anomaly Advisor detects issues in seconds with 18-model ML, sub-2-second analysis, and precise root-cause insights for any scale. Read more now!
Transform AWS monitoring with real-time visibility, anomaly detection, and transparent pricing that eliminates CloudWatch surprises. Book a demo now!
Per-second Azure monitoring with real-time insights, AI guidance, and predictable pricing that cuts TCO by 90%. Transform your observability. Book a demo!
Get real-time blast radius intelligence, automated root cause detection, and per-second insights to resolve incidents faster with Netdata. Read more now!
Achieve full-stack cloud observability with per-second metrics, zero configuration, and AI-driven root cause detection. Faster insights and lower costs!
Achieve 24/7 operational excellence with per-second visibility, AI-powered troubleshooting, and predictable costs. Netdata delivers sub-2-second detection and 80% faster resolution for always-on infrastructure.
Monitor every database in real time with per-second precision, AI root-cause detection, and 60-second deployment for full visibility. Book a demo now!
Boost performance and reduce complexity with Netdata’s per-node observability, real-time metrics, and autonomous edge intelligence. Read more now!
Monitor Docker & Kubernetes in real time with per-second precision, zero config, and ML insights. Cut costs by 90% and fix issues instantly. Book a demo!
Netdata’s eBPF monitoring delivers real-time network metrics, ML anomaly detection, and AI-assisted root cause analysis for teams of any size. Read more!
Real-time observability for distributed edge infrastructure with local processing, minimal overhead, and complete autonomy - even when networks fail.
Keep your gaming platform fast and stable with real-time visibility, ML detection, and AI-powered root cause analysis for 99.9% uptime. Book a demo now!
Get per-second GCP monitoring, ML anomaly detection, and predictable per-node pricing with Netdata for complete real-time visibility. Book a demo now!
Get true real-time HPC observability with per-second metrics, accurate anomaly detection, and GPU/InfiniBand monitoring built for scale. Book a demo now!
Get real-time hybrid cloud observability with per-second metrics, edge-based ML, and unified visibility across any environment. Book a demo now!
Get per-second monitoring, instant root-cause analysis & full data sovereignty for every production line. Cut downtime and costs with Netdata. Book a demo!
Cut costs, speed up MTTR, and gain real-time visibility with Netdata’s MSP-ready monitoring platform built for scale, accuracy, and control. Book a demo!
Simplify multi-cloud monitoring with per-second insights, automatic anomaly detection, and transparent per-node pricing at scale. Book a demo now!
Cut AWS monitoring costs by 90% with Netdata’s per-second visibility, ML anomaly detection, and predictable per-node pricing that scales. Learn more now!
Compare Netdata and Catchpoint for infrastructure monitoring. Discover how Netdata provides per-second visibility, ML anomaly detection, and complete internal infrastructure monitoring to complement external performance monitoring.
Deploy Netdata for real-time, per-second infrastructure monitoring with zero query language, fast rollout & predictable P90 per-node pricing. Learn more!
Get true per-second visibility, zero-config setup, and predictable pricing, powerful infrastructure monitoring without enterprise costs. Learn more now!
Compare Netdata vs Dynatrace for real-time, per-second infrastructure monitoring with full data sovereignty and predictable pricing. Learn more now!
Netdata goes beyond Fluentd with real-time monitoring, ML-powered anomaly detection, AI insights, and predictable pricing for teams at scale. Learn more!
See how Netdata outperforms Instana with per-second visibility, unlimited scale, flat pricing, and instant deployment for any team size. Learn more now!
Enhance Lansweeper with real-time monitoring from Netdata. Get per-second visibility, ML anomaly detection, and AI-powered troubleshooting. Learn more now!
Compare Netdata vs Logz.io to cut observability costs, boost real-time visibility, and deploy in minutes with full data sovereignty. Learn more now!
Compare Netdata vs N-able with real-time per-second monitoring, ML anomaly detection, and transparent pricing for modern DevOps teams. Learn more now!
Discover why modern teams choose Netdata for per-second visibility, automated root cause analysis, and predictable monitoring costs. Learn more now!
Get real-time monitoring with 1-second visibility, edge-based ML, and predictable per-node pricing. Skip delays & surprise bills with Netdata. Learn more!
Compare Observium vs Netdata: full-stack coverage, per-second granularity, AI insights, & zero-config deployment for true real-time visibility. Learn more!
Netdata delivers faster insights, smarter anomaly detection, and simpler deployment than Rakuten SixthSense for modern infra teams. Learn more now!
Skip complex setups. Netdata gives instant per-second insights, zero-config deployment, and major cost savings compared to StackState. Learn more now!
See why teams switch from WhatsUp Gold to Netdata for real-time insights, faster troubleshooting, and AI-powered monitoring at scale. Learn more now!
Netdata replaces Zabbix’s heavy setup with real-time, zero-config monitoring in 60 seconds & 90% lower costs. See why modern teams switch today. Read more!
Ship faster with real-time, per-second observability, AI troubleshooting, and seamless IDE integration. Boost dev velocity with zero config. Book a demo!
Transform Proxmox monitoring with per-second visibility, AI insights, and 400+ intelligent alerts, without complexity or high costs. Book a demo now!
Monitor Envoy, Istio, Linkerd, and Consul with zero config, instant insights & 90% lower observability costs using Netdata’s real-time platform. Read more!
Get real-time observability, per-second metrics, ML anomaly detection, and predictable costs. Cut MTTR by 80% and scale instantly. Book a demo now!
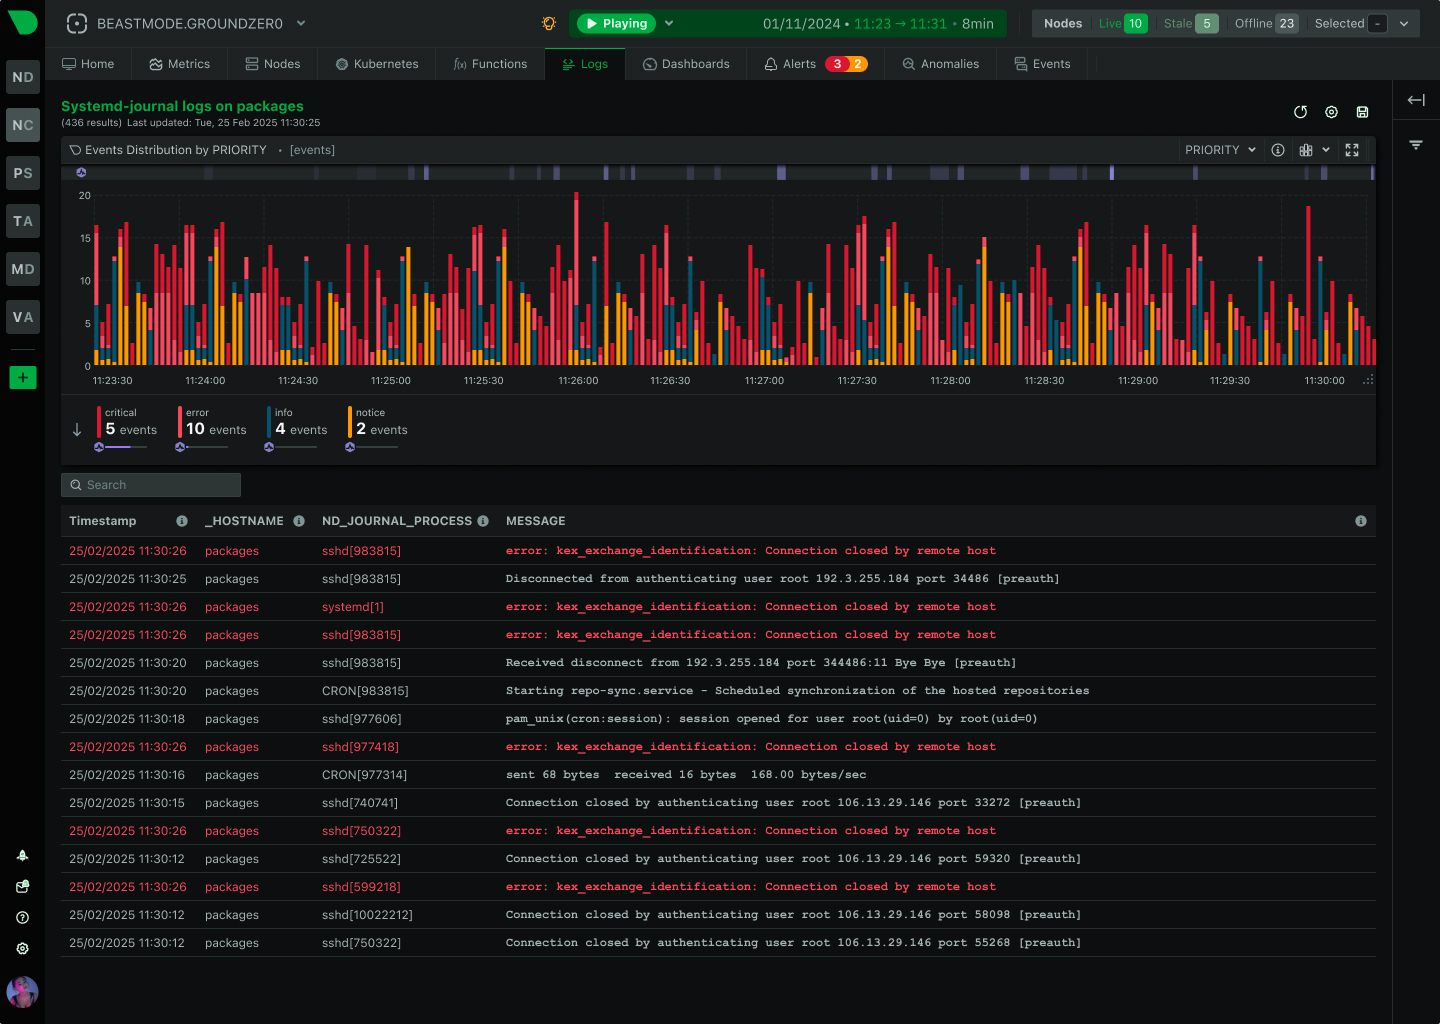
Get sub-2-second queries, AI-powered troubleshooting, and zero-pipeline systemd-journal log management with full data sovereignty. Book a demo now!
Real-time telecom monitoring with per-second precision, ML anomaly detection, and predictable per-node pricing for 5G and edge networks. Book a demo now!
Get per-second VMware monitoring, AI-powered troubleshooting, and predictable per-node pricing for complete visibility across hybrid clouds. Book a demo!
Monitor Apache, Nginx & IIS with per-second precision, instant dashboards, and ML-driven insights that cut troubleshooting time dramatically. Book a demo!
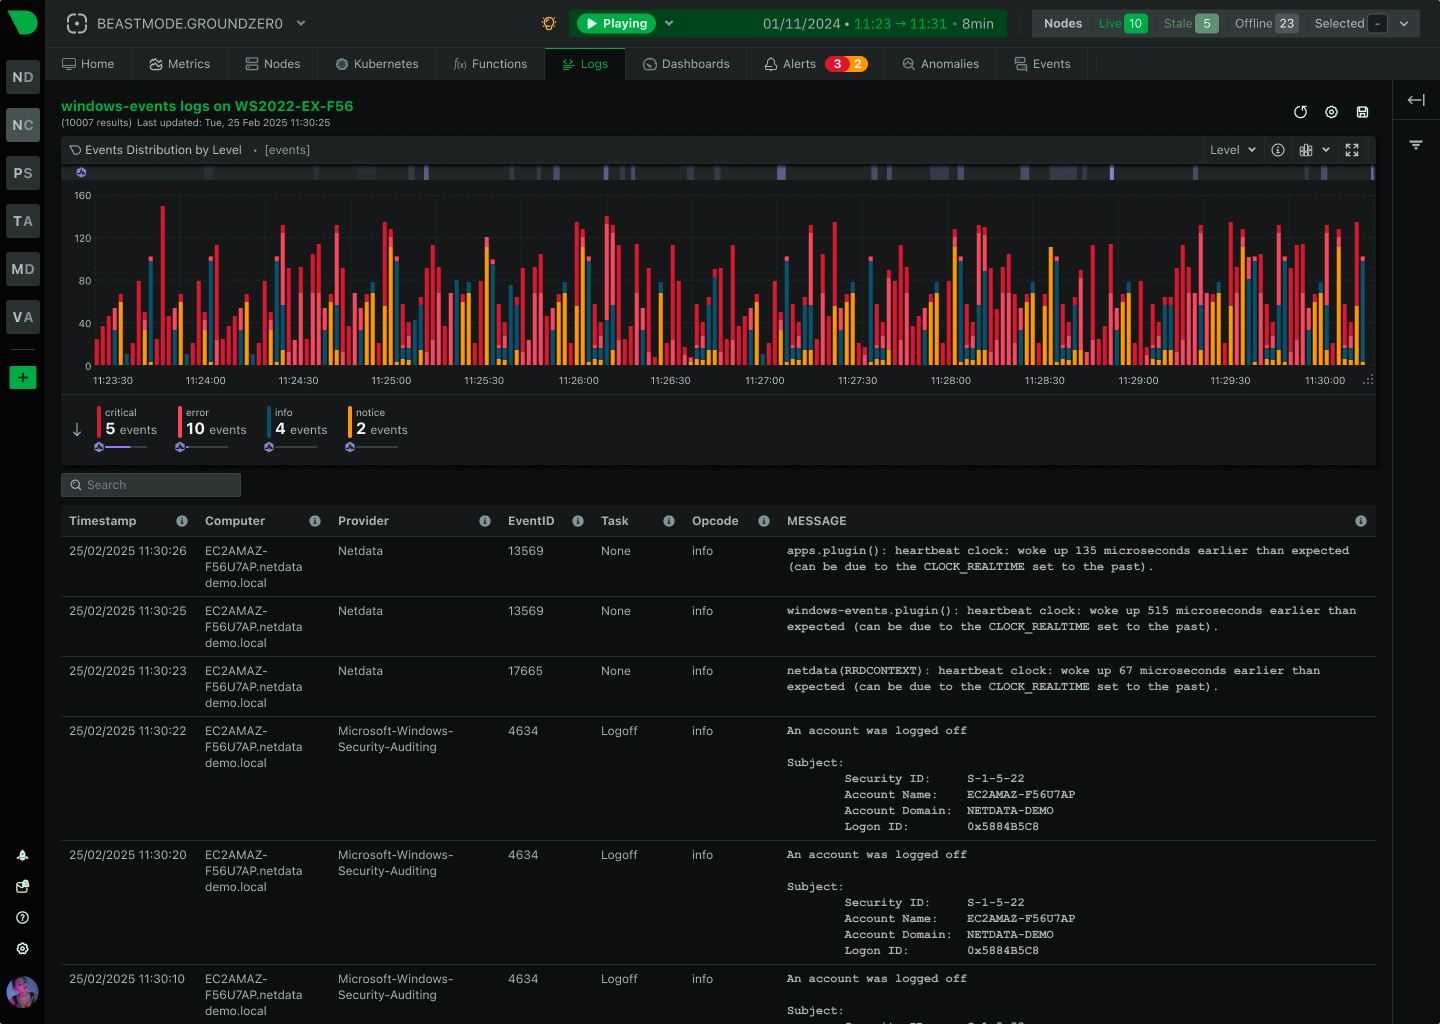
Get real-time Windows Event Log observability with per-second metrics, ML anomaly detection, and AI-powered troubleshooting at lower cost. Book a demo now!
Monitor Windows Servers with per-second metrics, ML anomaly detection, and instant troubleshooting for IIS, SQL, and AD, no complexity. Book a demo now!
Cut log costs by 90% with edge-first architecture, sub-2-second queries, and zero pipeline overhead. Gain full visibility in minutes. Read more now!
Ensure operational continuity with autonomous agents, automatic failover, and ML-powered anomaly detection for real-time deployments. Read more now!
Deep insights into real-time monitoring with Costa Tsaousis
Choose Netdata over Chronosphere for instant deployment, per-second monitoring, edge ML, and full data sovereignty with clear pricing. Learn more now!
Netdata delivers per-second monitoring, ML anomaly detection & predictable pricing, catching issues Site24x7 misses while cutting costs by 90%. Learn more!
See how Netdata can improve visibility, reduce downtime, and simplify monitoring — no commitment required.