Real-Time Infrastructure Intelligence for Modern Tech Teams
Deploy comprehensive observability in 60 seconds. Per-second metrics, ML-powered insights, and 90% cost reduction - without query languages, complex configuration, or surprise bills.


Deploy comprehensive observability in 60 seconds. Per-second metrics, ML-powered insights, and 90% cost reduction - without query languages, complex configuration, or surprise bills.
Comprehensive observability without the complexity tax
Zero configuration required. Auto-discovers 800+ integrations, generates dashboards automatically, and starts ML training immediately - from install to insights in under a minute.
Catch microbursts and transient issues invisible to minute-based monitoring. Sub-2-second latency from event to insight reveals what’s actually happening right now.
18 unsupervised models per metric train locally at the edge. Significantly reduces false positives through consensus detection - no tuning, no cloud dependency, no blind spots.
Predictable per-node pricing eliminates surprise bills. No cardinality explosions, no data volume charges, no per-user fees. Predictable costs that scale linearly with infrastructure.
Point-and-click analysis replaces PromQL, LogQL, and SQL. Each chart is a complete analytical tool - slice, dice, and correlate any dataset without specialized skills.
All metrics and logs stay on-premises. Only metadata travels to Cloud for unified dashboards. GDPR, HIPAA, and PCI compliance by architectural design.
Trusted by technology teams worldwide
400+ pre-configured alerts
Explore Alerting

80% MTTR reduction
See AI Features

Console replacement
View Functions

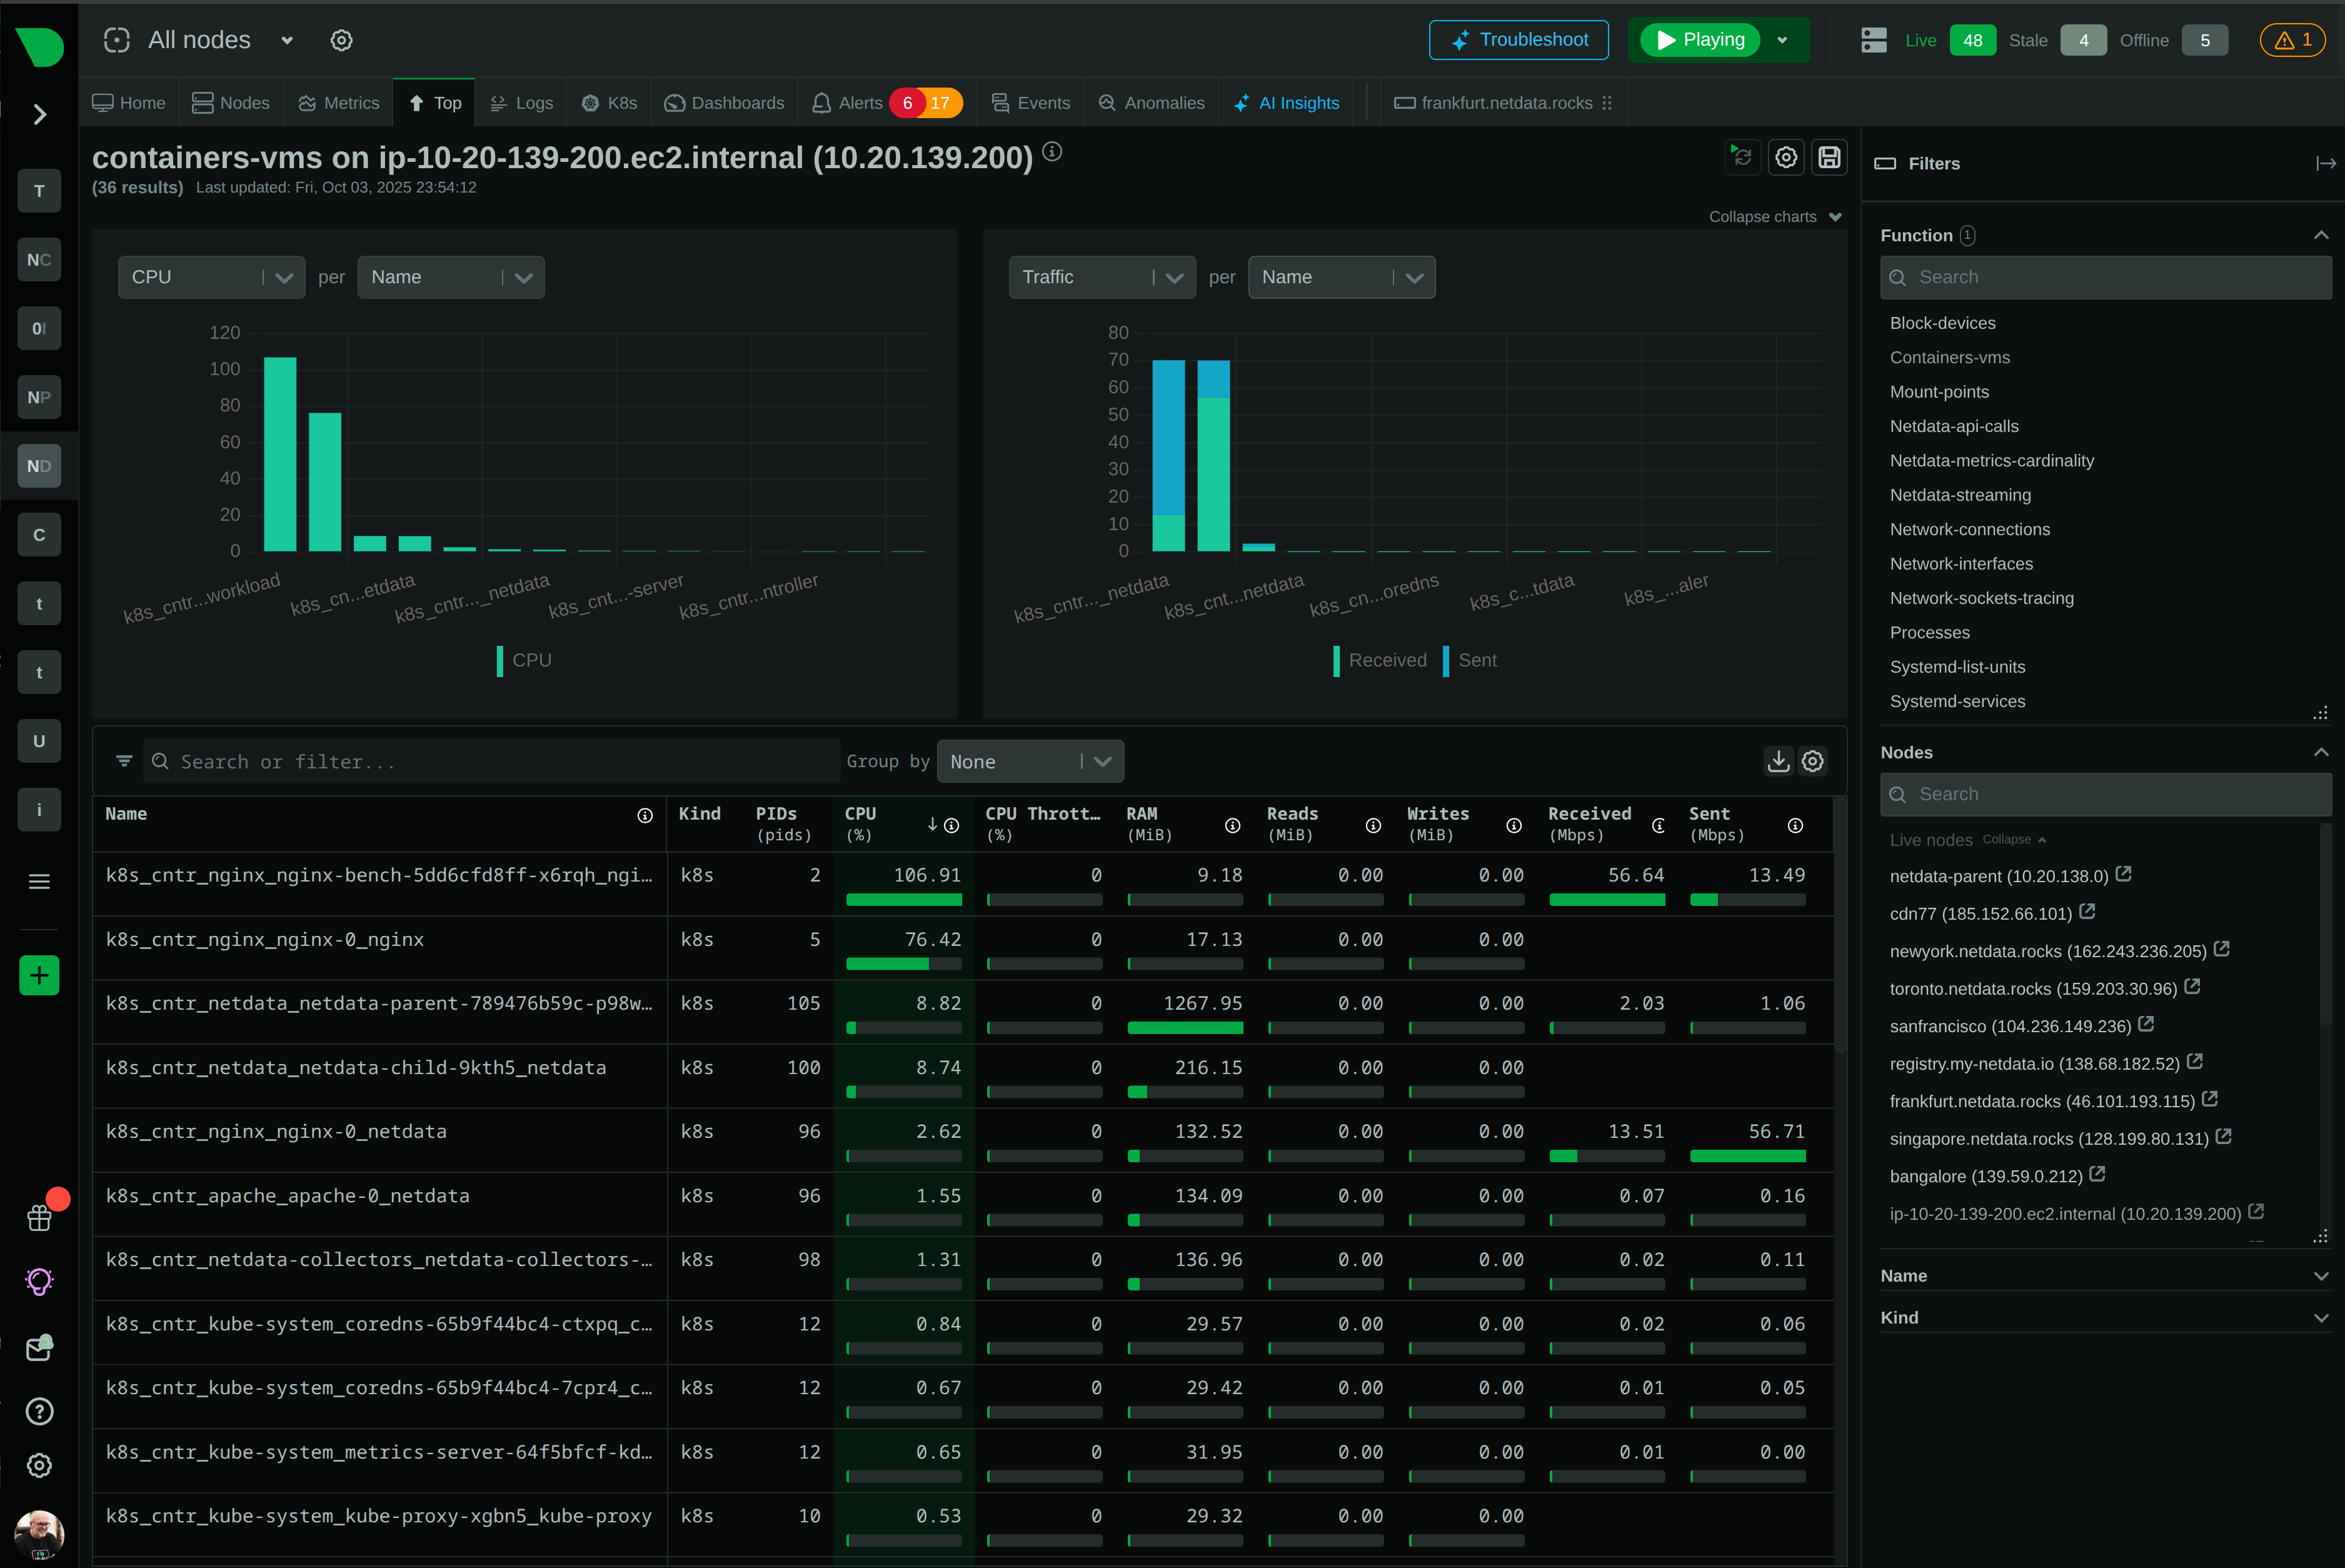
Zero K8s configuration
Kubernetes Monitoring

90% logs cost reduction
Logs Management

Unlimited scalability
Architecture Details

Technology Industry Observability Comparison
See how Netdata’s edge-native architecture solves the cost, complexity, and visibility challenges facing modern technology organizations.
Capability
Netdata
Traditional Monitoring
Data Granularity
✅ Per-Second
Catch microbursts and transient issues
⚠️ Per-Minute or Worse
Averages hide critical patterns
Time to Value
✅ 60 Seconds
Install to full dashboard instantly
⚠️ Days to Weeks
Complex setup and configuration
Query Language
✅ None Required
Point-and-click NIDL framework
❌ PromQL/LogQL/SQL
Steep learning curve required
ML Anomaly Detection
✅ Every Metric
18 models per metric, edge-trained
⚠️ Selected Metrics
Manual configuration, cloud-based
Cost Model
✅ Predictable Per-Node
Fixed pricing, unlimited metrics
❌ Volume-Based
Surprise bills from cardinality explosions
Data Sovereignty
✅ 100% On-Premises
Metrics and logs never leave infrastructure
⚠️ Centralized Cloud
Data egress and compliance concerns
Logs Management
✅ Zero Pipeline
Direct journal access, 90% cost reduction
❌ Complex Pipelines
Elasticsearch/Splunk infrastructure required
Alert Configuration
✅ 400+ Pre-Configured
Component-level, work immediately
⚠️ Build from Scratch
Manual threshold tuning required
Scalability
✅ Linear
1 to 100,000+ nodes, no bottlenecks
❌ Exponential Complexity
Central database becomes bottleneck
Resource Efficiency
✅ <5% CPU, 150-200MB RAM
Most energy-efficient (U. Amsterdam)
⚠️ 10-30% CPU Overhead
Significant infrastructure impact
Monitor AWS, Azure, GCP, and hybrid environments with unified visibility. Auto-discovers Kubernetes pods, containers, and services with zero configuration. Per-second metrics across all cloud resources.
Native cloud integration
Cloud MonitoringThe observability platform built for speed, scale, and simplicity
Zero configuration required. Auto-discovers infrastructure, generates dashboards, and starts ML training immediately. From install to insights in under 60 seconds.
Predictable per-node pricing eliminates surprise bills. No cardinality explosions, no data volume charges. 90% cost reduction vs traditional monitoring.
Per-second metrics with sub-2-second latency. Catch microbursts and transient issues invisible to minute-based monitoring. See what’s happening right now.
18 unsupervised models per metric train automatically at the edge. Significantly reduces false positives through consensus detection. No tuning, no cloud dependency.
Point-and-click NIDL framework replaces PromQL, LogQL, and SQL. Each chart is a complete analytical tool. Junior engineers operate at senior level.
All metrics and logs stay on-premises. GDPR, HIPAA, and PCI compliance by architectural design. Only metadata travels to Cloud for unified dashboards.
Anomaly Advisor surfaces root cause in top 30-50 results. AI explains alerts in natural language. Blast radius detection shows cascading failures.
Distributed edge-native architecture eliminates bottlenecks. 1 to 100,000+ nodes with same performance. Proven at 4.5+ billion metrics per second globally.
Query systemd-journal and Windows Event Logs directly. No Elasticsearch, no Splunk, no ingestion infrastructure. 90% cost reduction with complete history.

July 15, 2026
Netdata's latest release brings native macOS logs and hardware telemetry: unified logs through OSLog, battery and power, SMC/HID sensors and thermals, Apple-silicon GPU, per-application metrics, NVMe SMART, and network topology — all read through Apple's own frameworks at per-second resolution.

June 24, 2026
See Netdata's NPM-class network monitoring: live topology, NetFlow and sFlow analysis, SNMP across 200+ profiles, and trap handling. Read the guide now!

June 23, 2026
Discover the 5 best SolarWinds alternatives for 2026, built for the cloud-native, dynamic infrastructure legacy tools can't handle. Read the guide now!