
See Every Signal in Your Network Infrastructure
Real-time observability for telecommunications operators transitioning to cloud-native 5G. Monitor infrastructure at per-second precision with predictable per-node pricing and zero configuration.

Real-time observability for telecommunications operators transitioning to cloud-native 5G. Monitor infrastructure at per-second precision with predictable per-node pricing and zero configuration.

Complete infrastructure visibility without the complexity
Catch 2-10 second anomalies invisible to minute-based monitoring. Real-time visibility reveals true network behavior.
Per-node pricing with unlimited metrics and logs. No surprise bills from data volume spikes.
Auto-discovery of infrastructure, containers, and applications. Zero configuration from installation to full dashboards.
18 models per metric detect issues automatically. Edge-based intelligence with consensus-based detection.
200+ SNMP profiles for Cisco, Juniper, Huawei, Nokia, Arista. Single agent monitors all vendors.
Native Kubernetes monitoring with per-pod visibility. Complete observability for containerized 5G infrastructure.
Trusted by operations teams worldwide
100% visibility in days, not months
See Auto-Discovery

80% MTTR reduction
Explore AI Features

Predictable per-node pricing
View Pricing

One platform for all vendors
See Integrations

Autonomous operation at <5% CPU
Learn Edge Architecture

Zero-config Kubernetes monitoring
Explore Kubernetes

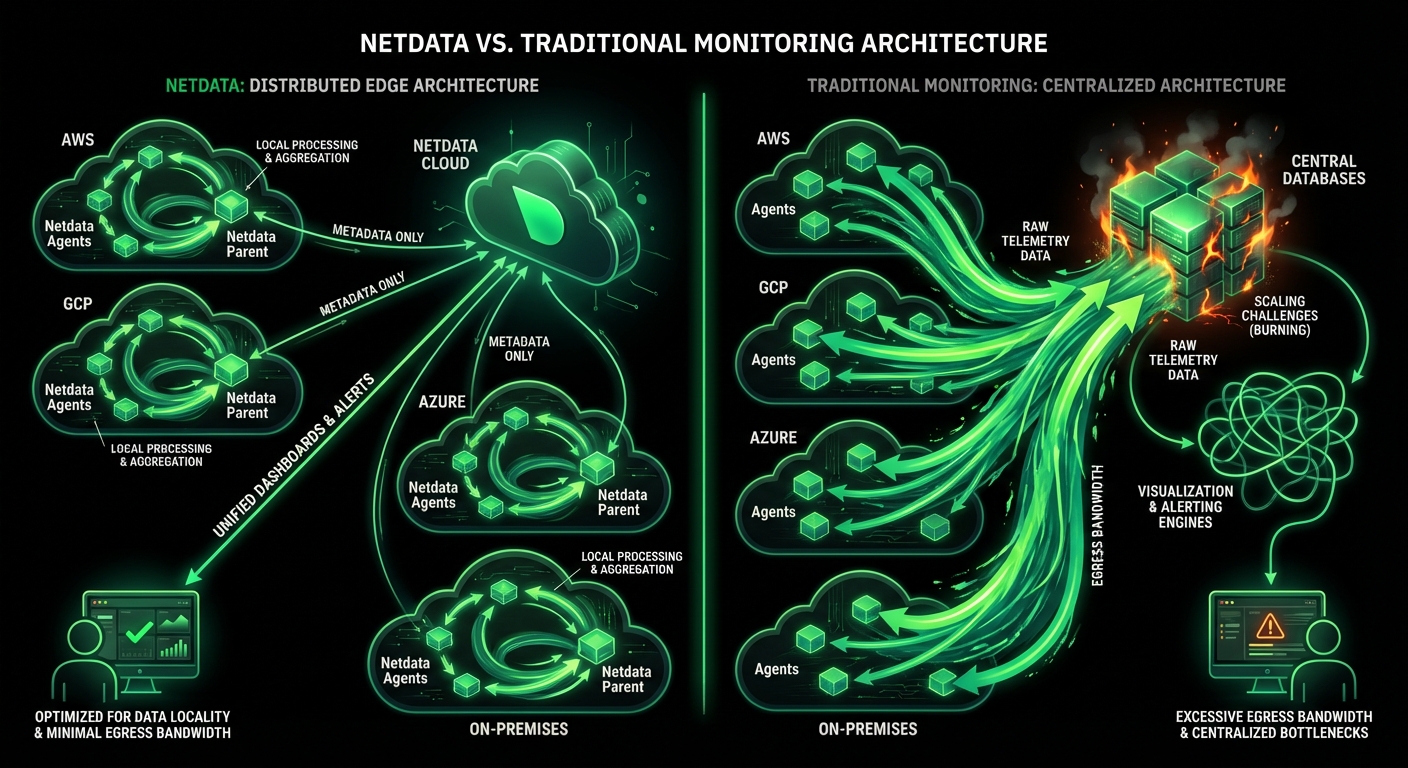
Netdata vs Traditional Telecom Monitoring
Compare Netdata’s distributed edge architecture against traditional centralized monitoring platforms. See how per-second precision, zero-configuration deployment, and predictable costs transform telecom operations.
Capability
Netdata
Traditional Monitoring
Data Granularity
✅ Per-Second
Catches 2-10 second anomalies others miss
⚠️ Per-Minute
Averages hide critical performance patterns
Deployment Time
✅ 60 Seconds
Auto-discovery to full dashboards instantly
⚠️ Weeks to Months
Manual configuration and dashboard building
Pricing Model
✅ Per-Node Pricing
Unlimited metrics and logs included
⚠️ Volume-Based
Unpredictable bills from data growth
ML Anomaly Detection
✅ 18 Models per Metric
Edge-based with consensus detection
⚠️ Cloud-Based Selective
Additional cost and latency
Multi-Vendor Support
✅ 200+ SNMP Profiles
Cisco, Juniper, Huawei, Nokia, Arista
⚠️ Limited Coverage
Vendor-specific agents required
Data Sovereignty
✅ 100% On-Premises
Zero metrics leave infrastructure
⚠️ Cloud-Centric
Data egress charges and compliance risks
Resource Efficiency
✅ <5% CPU, 150MB RAM
Most energy-efficient validated
⚠️ 10-30% CPU Overhead
Significant system impact
MTTR Impact
✅ 80% Reduction
Per-second visibility and AI-powered RCA
❌ Increasing
82% report MTTR over 1 hour in 2024
Storage Efficiency
✅ 0.6 Bytes per Sample
Years of retention in gigabytes
⚠️ 2-16 Bytes per Sample
Months of data in terabytes
Query Language
✅ None Required
Point-and-click NIDL framework
⚠️ PromQL/SQL Required
Weeks of training needed
Native Kubernetes monitoring with auto-discovery of pods, services, and deployments. Per-second visibility into containerized 5G core components, service mesh traffic, and API performance without instrumentation.
Zero-config K8s observability
Explore Kubernetes Monitoring
Essential features that transform telecom infrastructure monitoring
Per-second data collection with sub-2-second latency from event to insight. Catch anomalies traditional minute-based monitoring misses.
18 unsupervised models per metric train locally. Consensus-based detection without cloud dependency.
200+ device profiles for Cisco, Juniper, Huawei, Nokia, Arista. Auto-discovery with SNMPv1/v2c/v3 support across all vendors.
Auto-discovery of pods, services, deployments. Per-container resources, service mesh observability, and API performance monitoring.
60-second installation to full dashboards. Auto-discovers infrastructure, generates dashboards, and activates 400+ pre-configured alerts.
100% on-premises data storage. Zero metrics leave infrastructure. GDPR, HIPAA, PCI DSS compliance by design.
Per-node pricing with unlimited metrics and logs. No surprise bills from data volume spikes or metric cardinality.
Correlates anomalies across all metrics. Surfaces root cause in top 30-50 results. 80% MTTR reduction.

Browser-based access to processes, connections, logs, and systemd units. Same precision as SSH with history and ML.

June 24, 2026
See Netdata's NPM-class network monitoring: live topology, NetFlow and sFlow analysis, SNMP across 200+ profiles, and trap handling. Read the guide now!

September 26, 2023
Learn how Netdata monitors Linux QoS classes with per-class traffic visibility to understand and troubleshoot network shaping. Read the full guide now!

May 2, 2023
Track server health & reduce downtime with Netdata’s real-time uptime monitoring. Optimize performance & improve system reliability with ease. Learn more!