Google Cloud Monitoring

Monitor and optimize your Google Cloud infrastructure with real-time, per-second insights, AI-powered anomaly detection, and automated alerts to prevent downtime, reduce costs, and enhance performance.

Trusted by Global Enterprises.

nvidia
sap
netflix
intel

Master Your Google Cloud Environment with Netdata

High-resolution metrics, intelligent analysis, and immediate troubleshooting for your entire GCP infrastructure

  • Gain Cost Efficiency & Prevent Cloud Waste

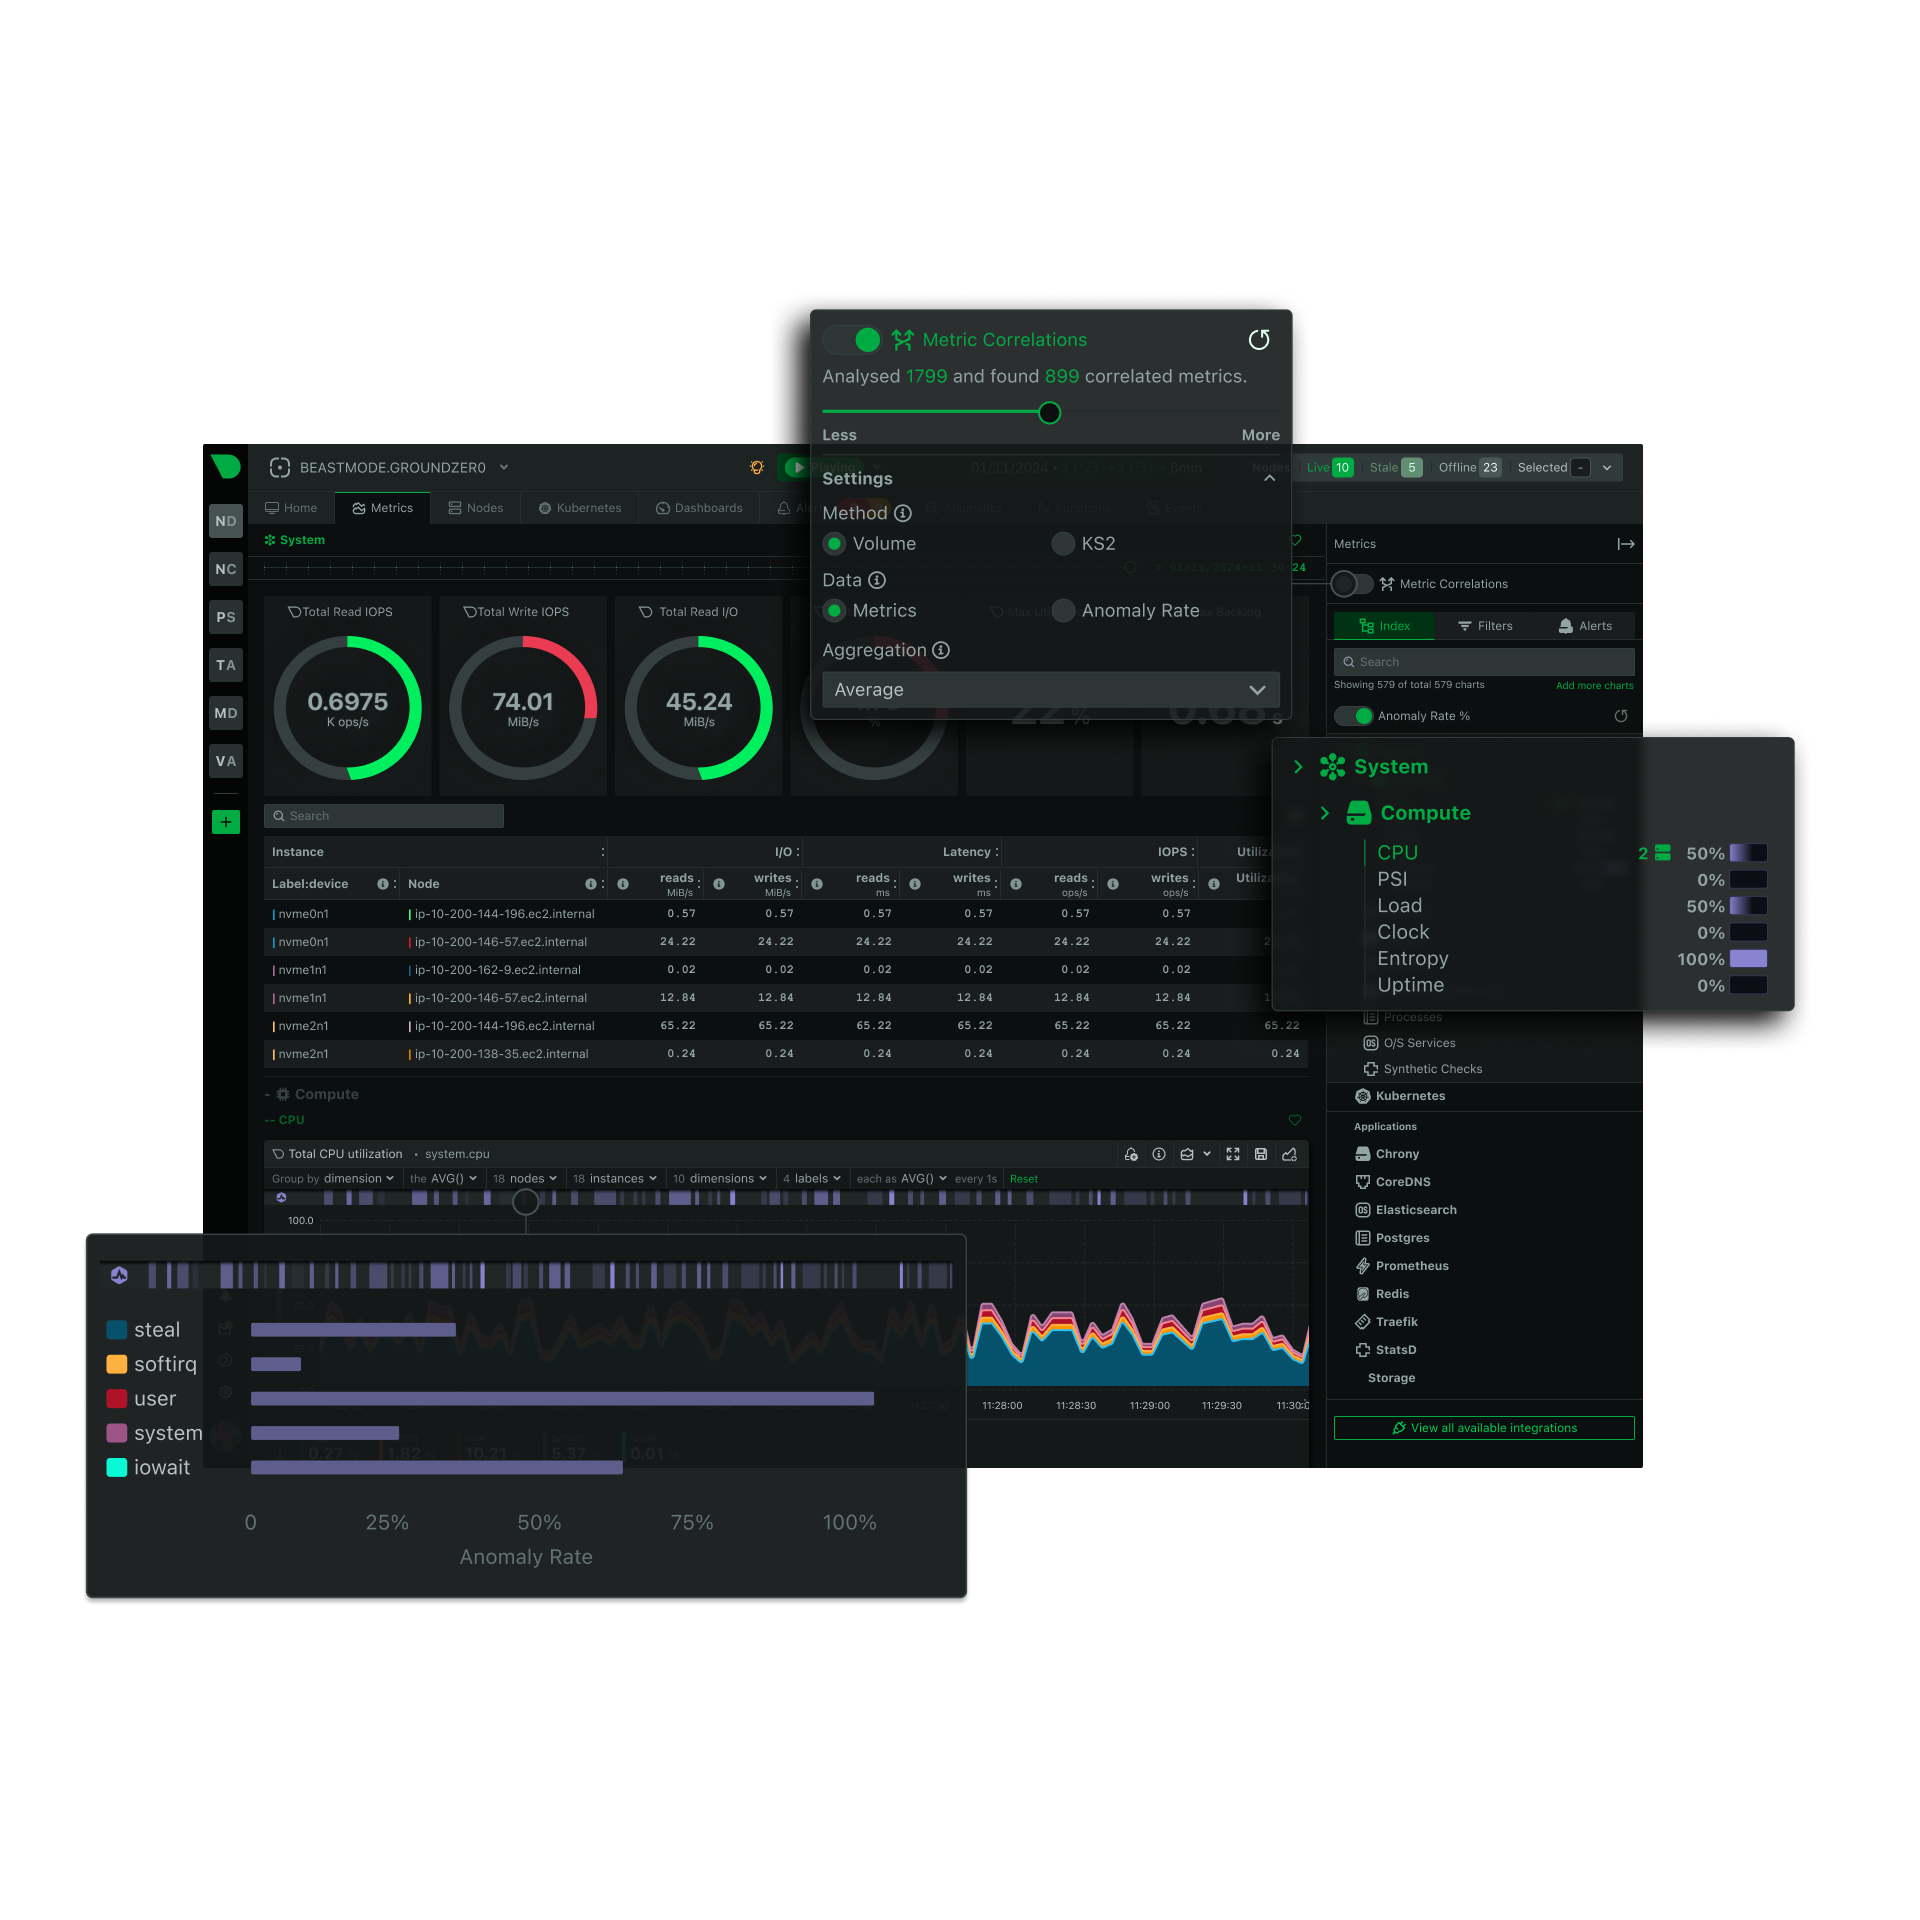
    GCP environments often suffer from over-provisioned virtual machines, idle containers, and inefficient database queries, leading to unexpectedly high bills. Netdata provides real-time insights to reduce waste and optimize resource usage.

    • Track underutilized Compute Engine instances – Identify & right-size overprovisioned VMs
    • Optimize auto-scaling decisions – Prevent unnecessary instance scaling & cut costs
    • Analyze GKE workloads – Identify idle containers & inefficient pod resource allocation
    • Monitor Cloud SQL & managed databases – Detect slow queries that drive up costs
    • Gain visibility into network egress traffic – Prevent unexpected cross-region transfer fees

  • Optimize GKE & Kubernetes Workloads

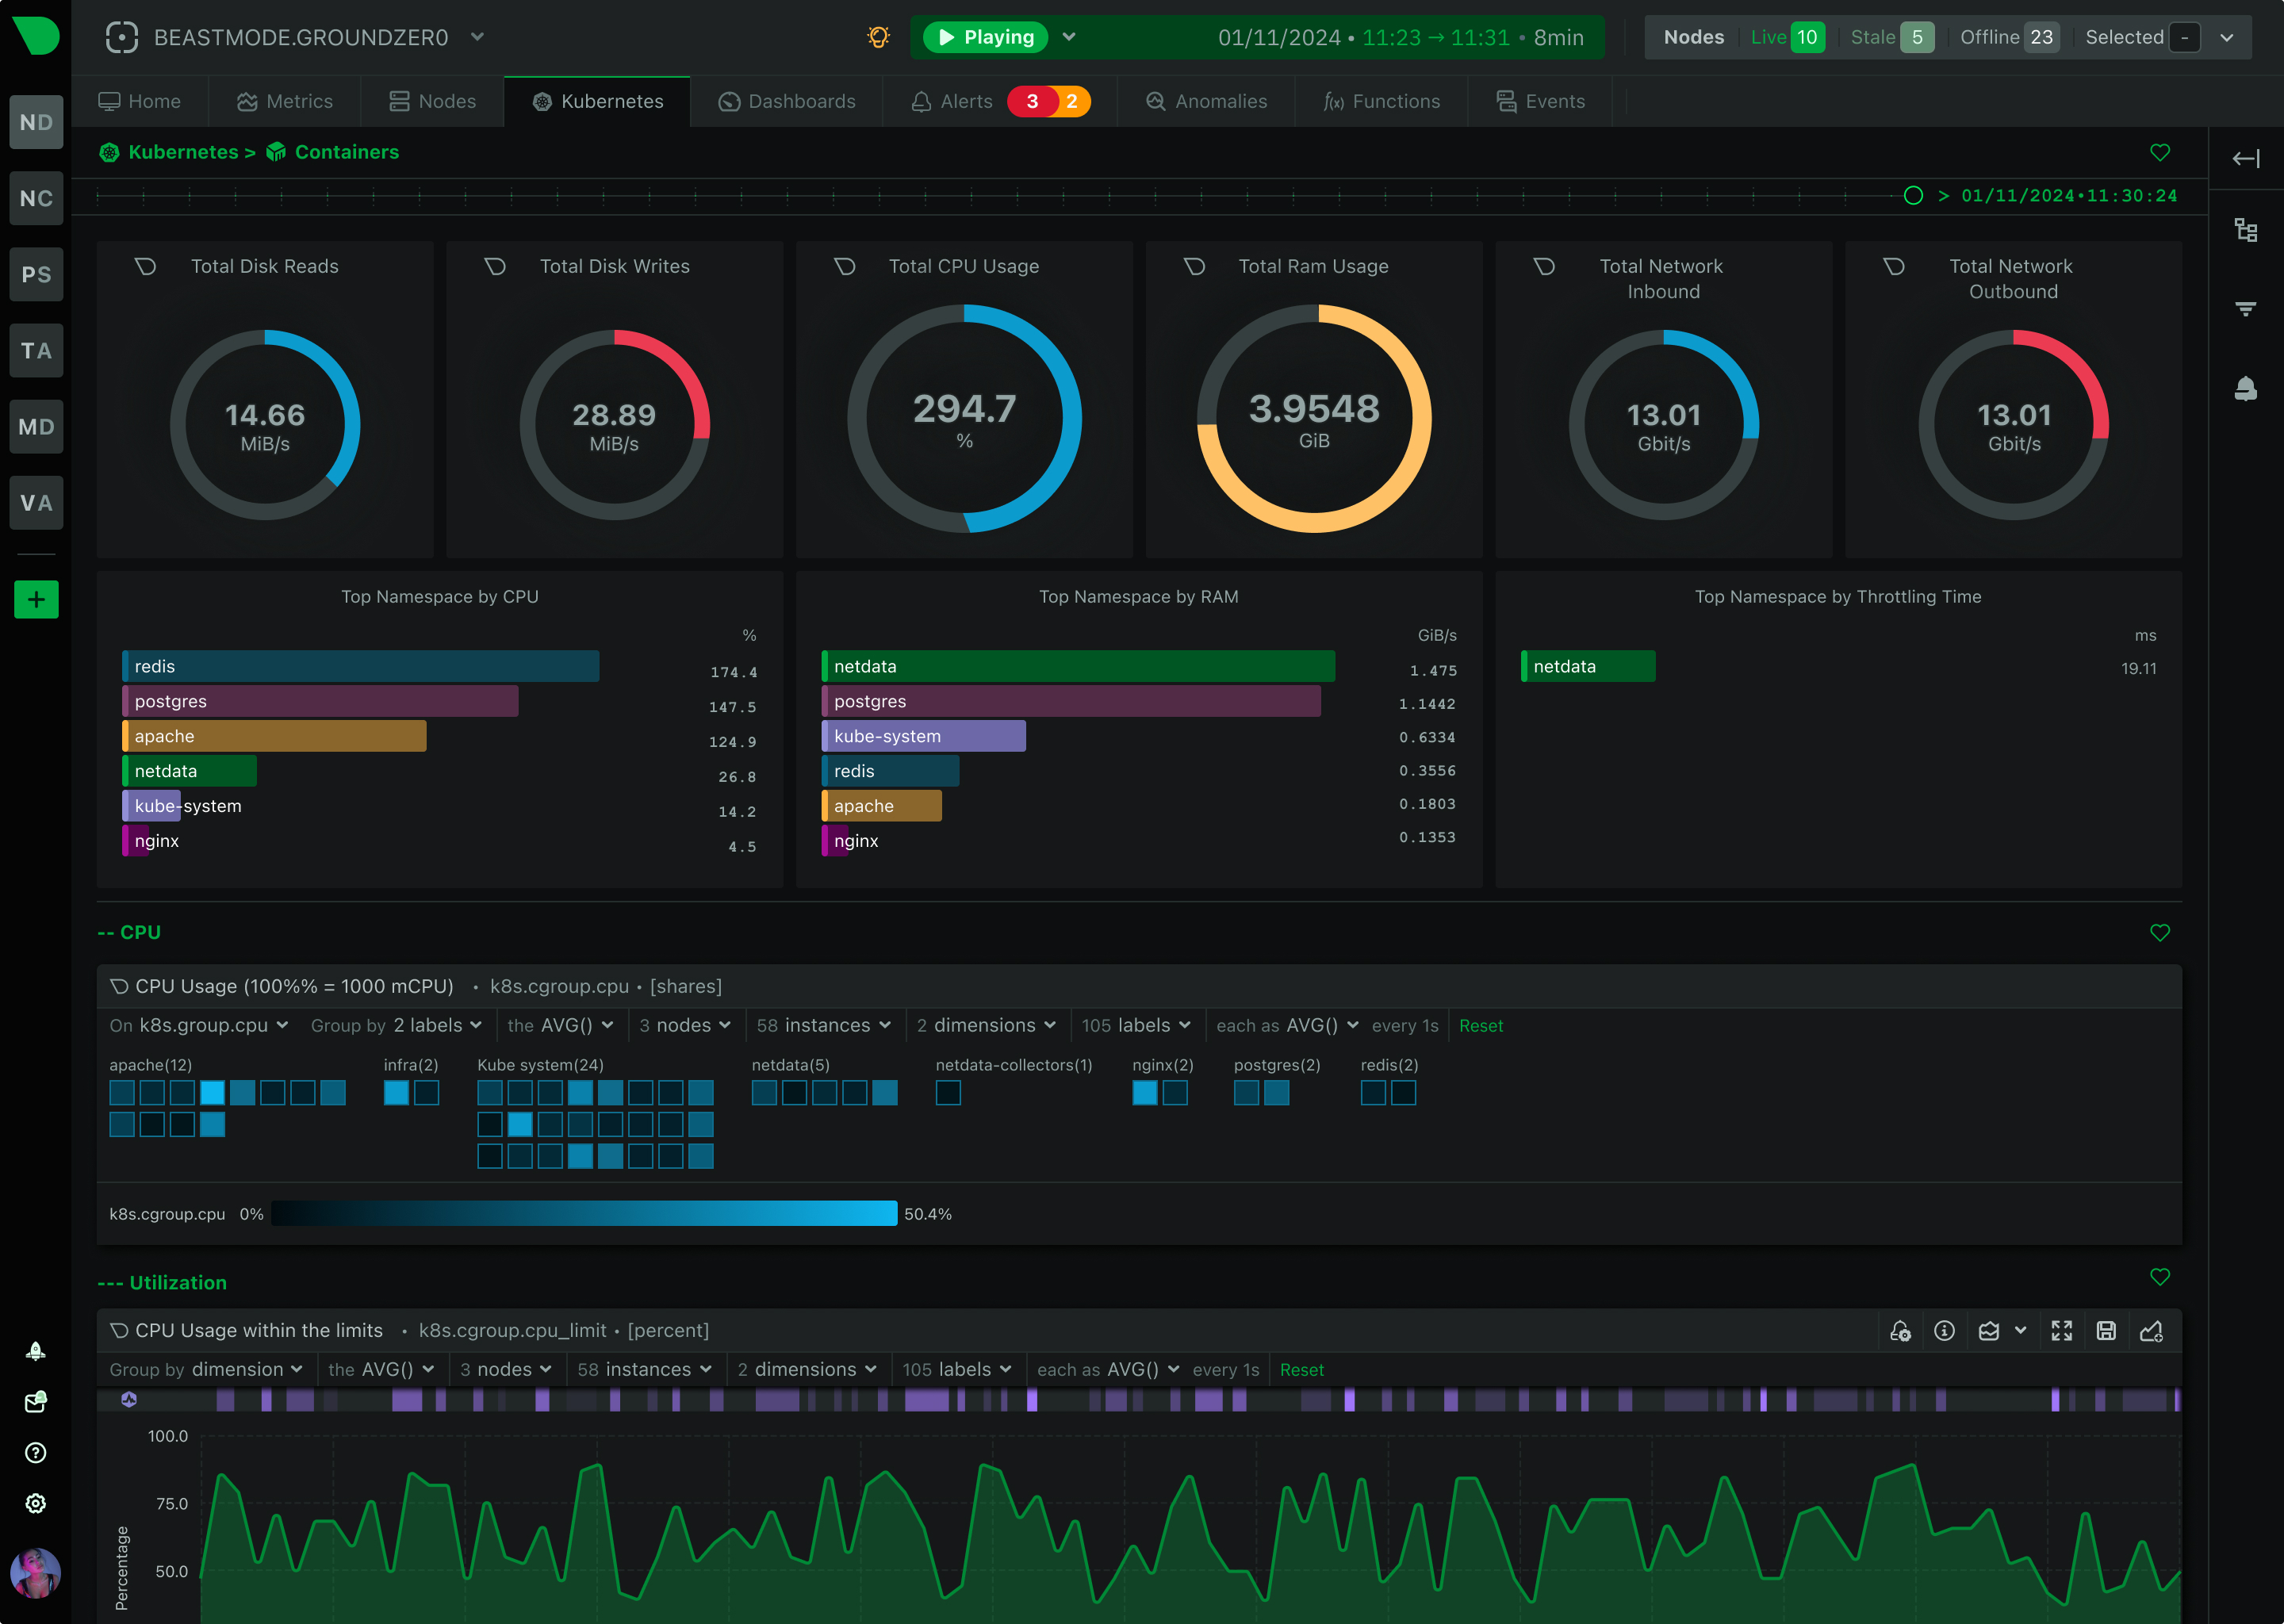
    Running Kubernetes workloads in Google Cloud requires continuous optimization to avoid CPU throttling, pod crashes, and resource contention. Netdata delivers real-time Kubernetes observability to keep workloads running smoothly.

    • Monitor GKE cluster health – Track pod restarts, CPU/memory usage, and node status
    • Prevent pod evictions – Detect memory and resource constraints before failures occur
    • Optimize workload distribution – Identify imbalanced pod scheduling and resource contention
    • Detect Kubernetes network slowdowns – Monitor inter-service communication latency
    • Ensure autoscaler efficiency – Verify horizontal scaling aligns with actual workload demands

  • Detect & Resolve Performance Bottlenecks in GCP Services

    Cloud performance issues can stem from network congestion, high disk latency, or overloaded instances. Netdata pinpoints these issues instantly, helping you eliminate slowdowns before they impact users.

    • Monitor real-time CPU, memory, disk, and network usage – Prevent performance bottlenecks
    • Detect high IOPS & slow disk performance – Prevent Compute Engine storage lag
    • Analyze network traffic spikes – Avoid congestion and detect DDoS-like activity
    • Track load balancer latency & failures – Identify misconfigurations affecting app delivery
    • Auto-discover new instances & services – Gain instant visibility into scaling workloads

  • Strengthen Security Visibility & Prevent Unauthorized Access

    • Monitor real-time SSH access attempts – Detect brute-force attacks and unauthorized logins
    • Prevent SSH access to exposed instances – Use Netdata’s real-time functions to lock down access
    • Track API authentication failures – Identify unauthorized API calls to GCP services
    • Detect unusual network traffic spikes – Spot potential security threats within VPC networks

The observability platform companies need to succeed

Sign up for free

Want a personalised demo of Netdata for your use case?

Book a Demo

Read how businesses are transforming their IT operations with Netdata’s real-time monitoring and AI-powered insights.