Real-Time Application Performance Monitoring

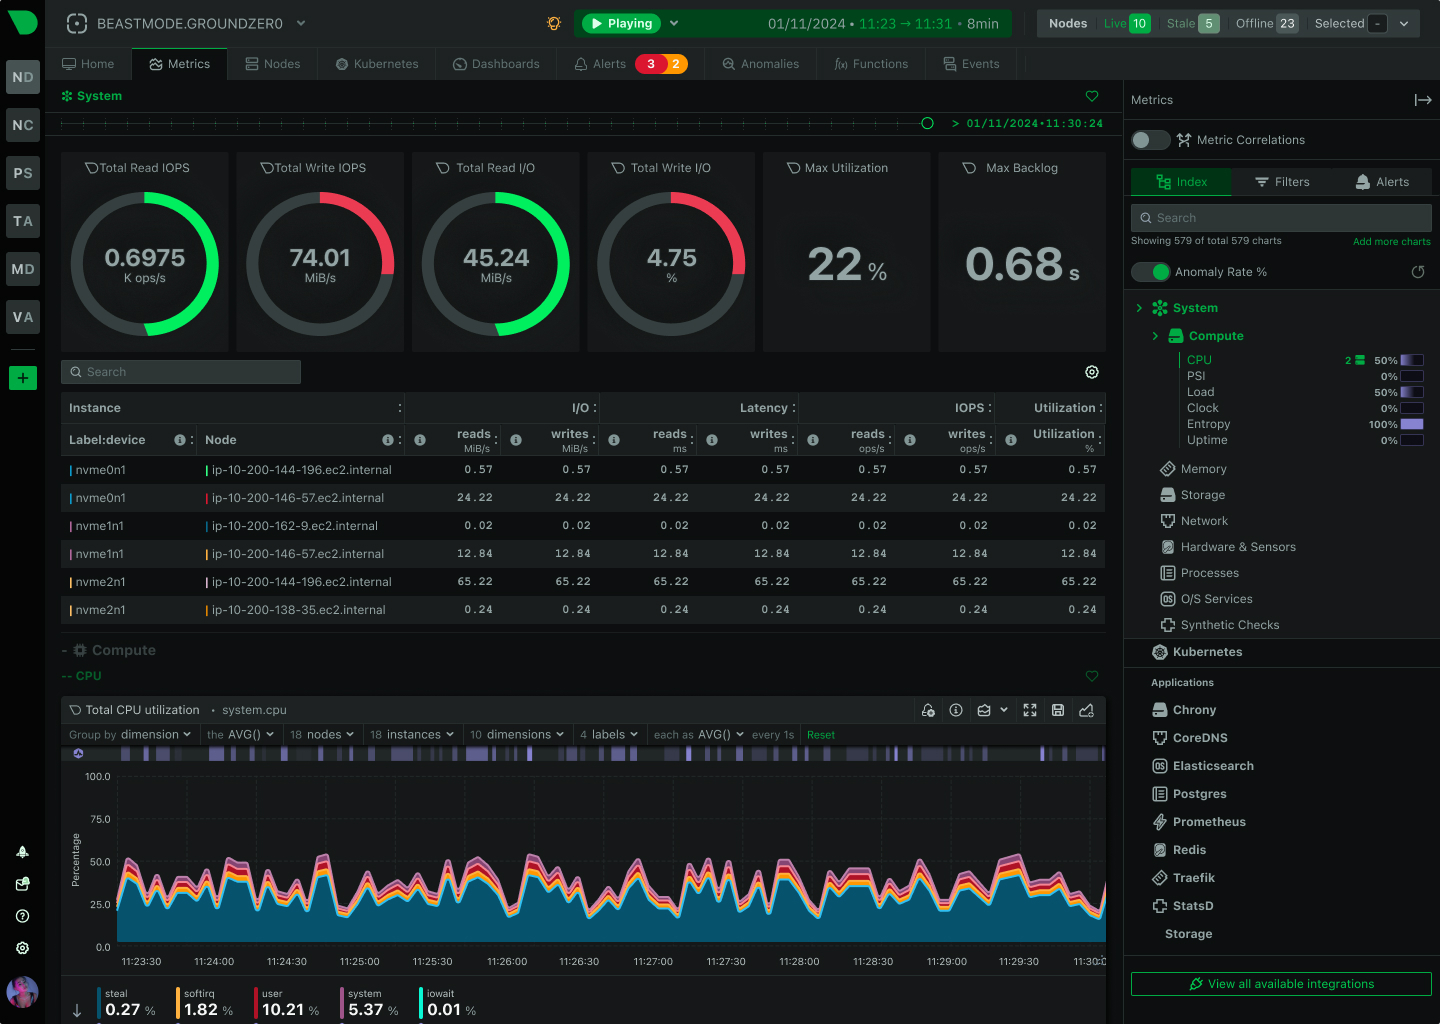
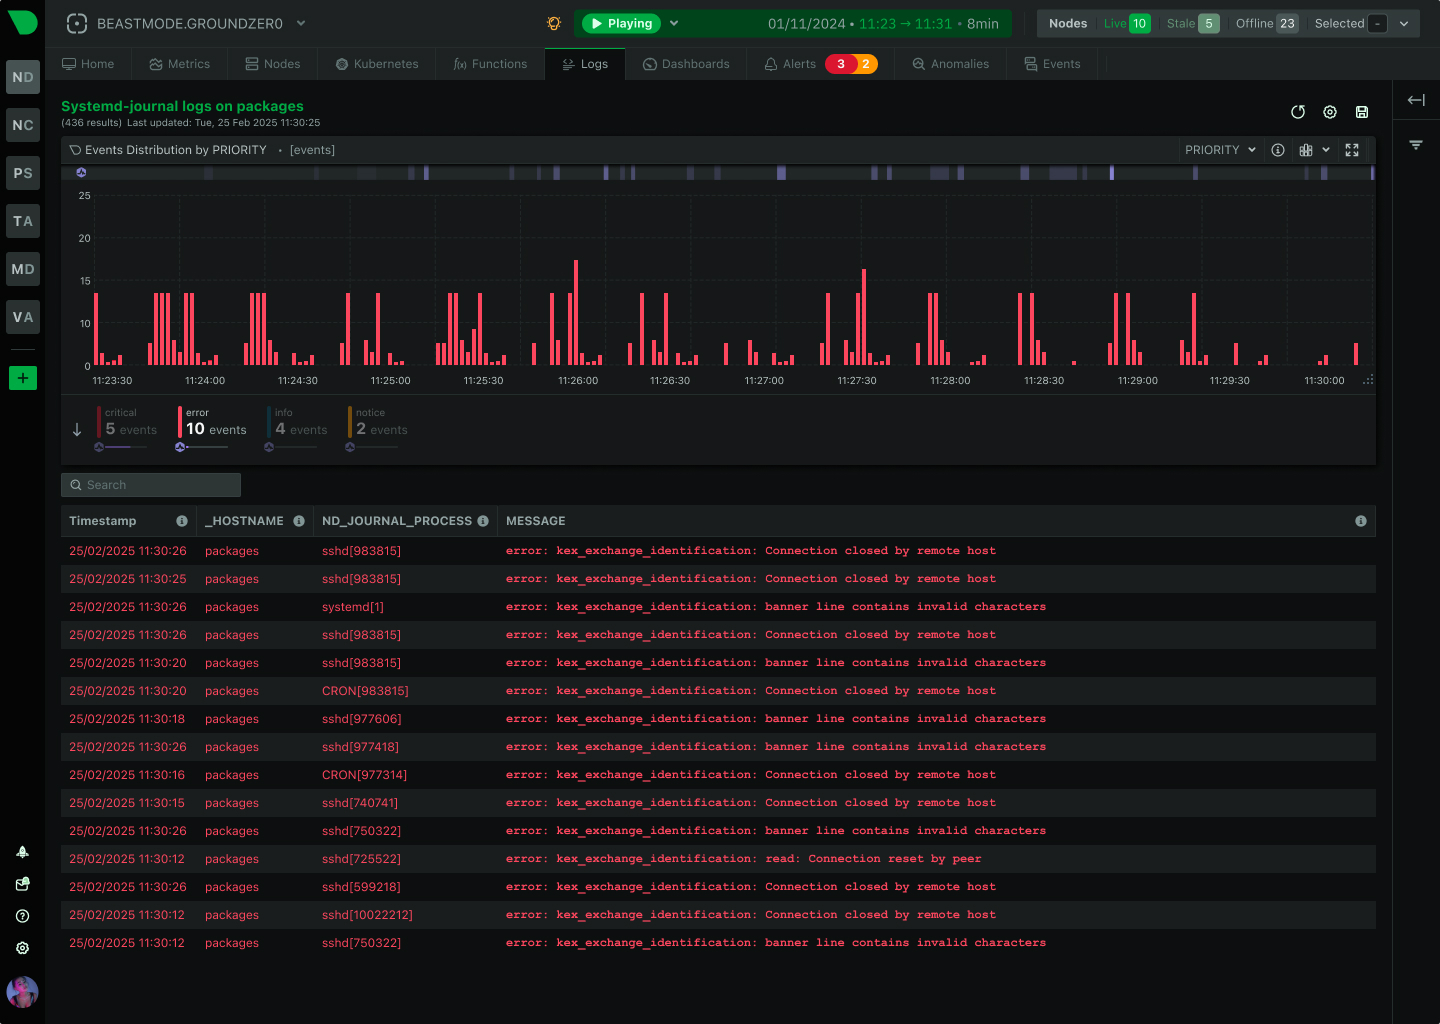
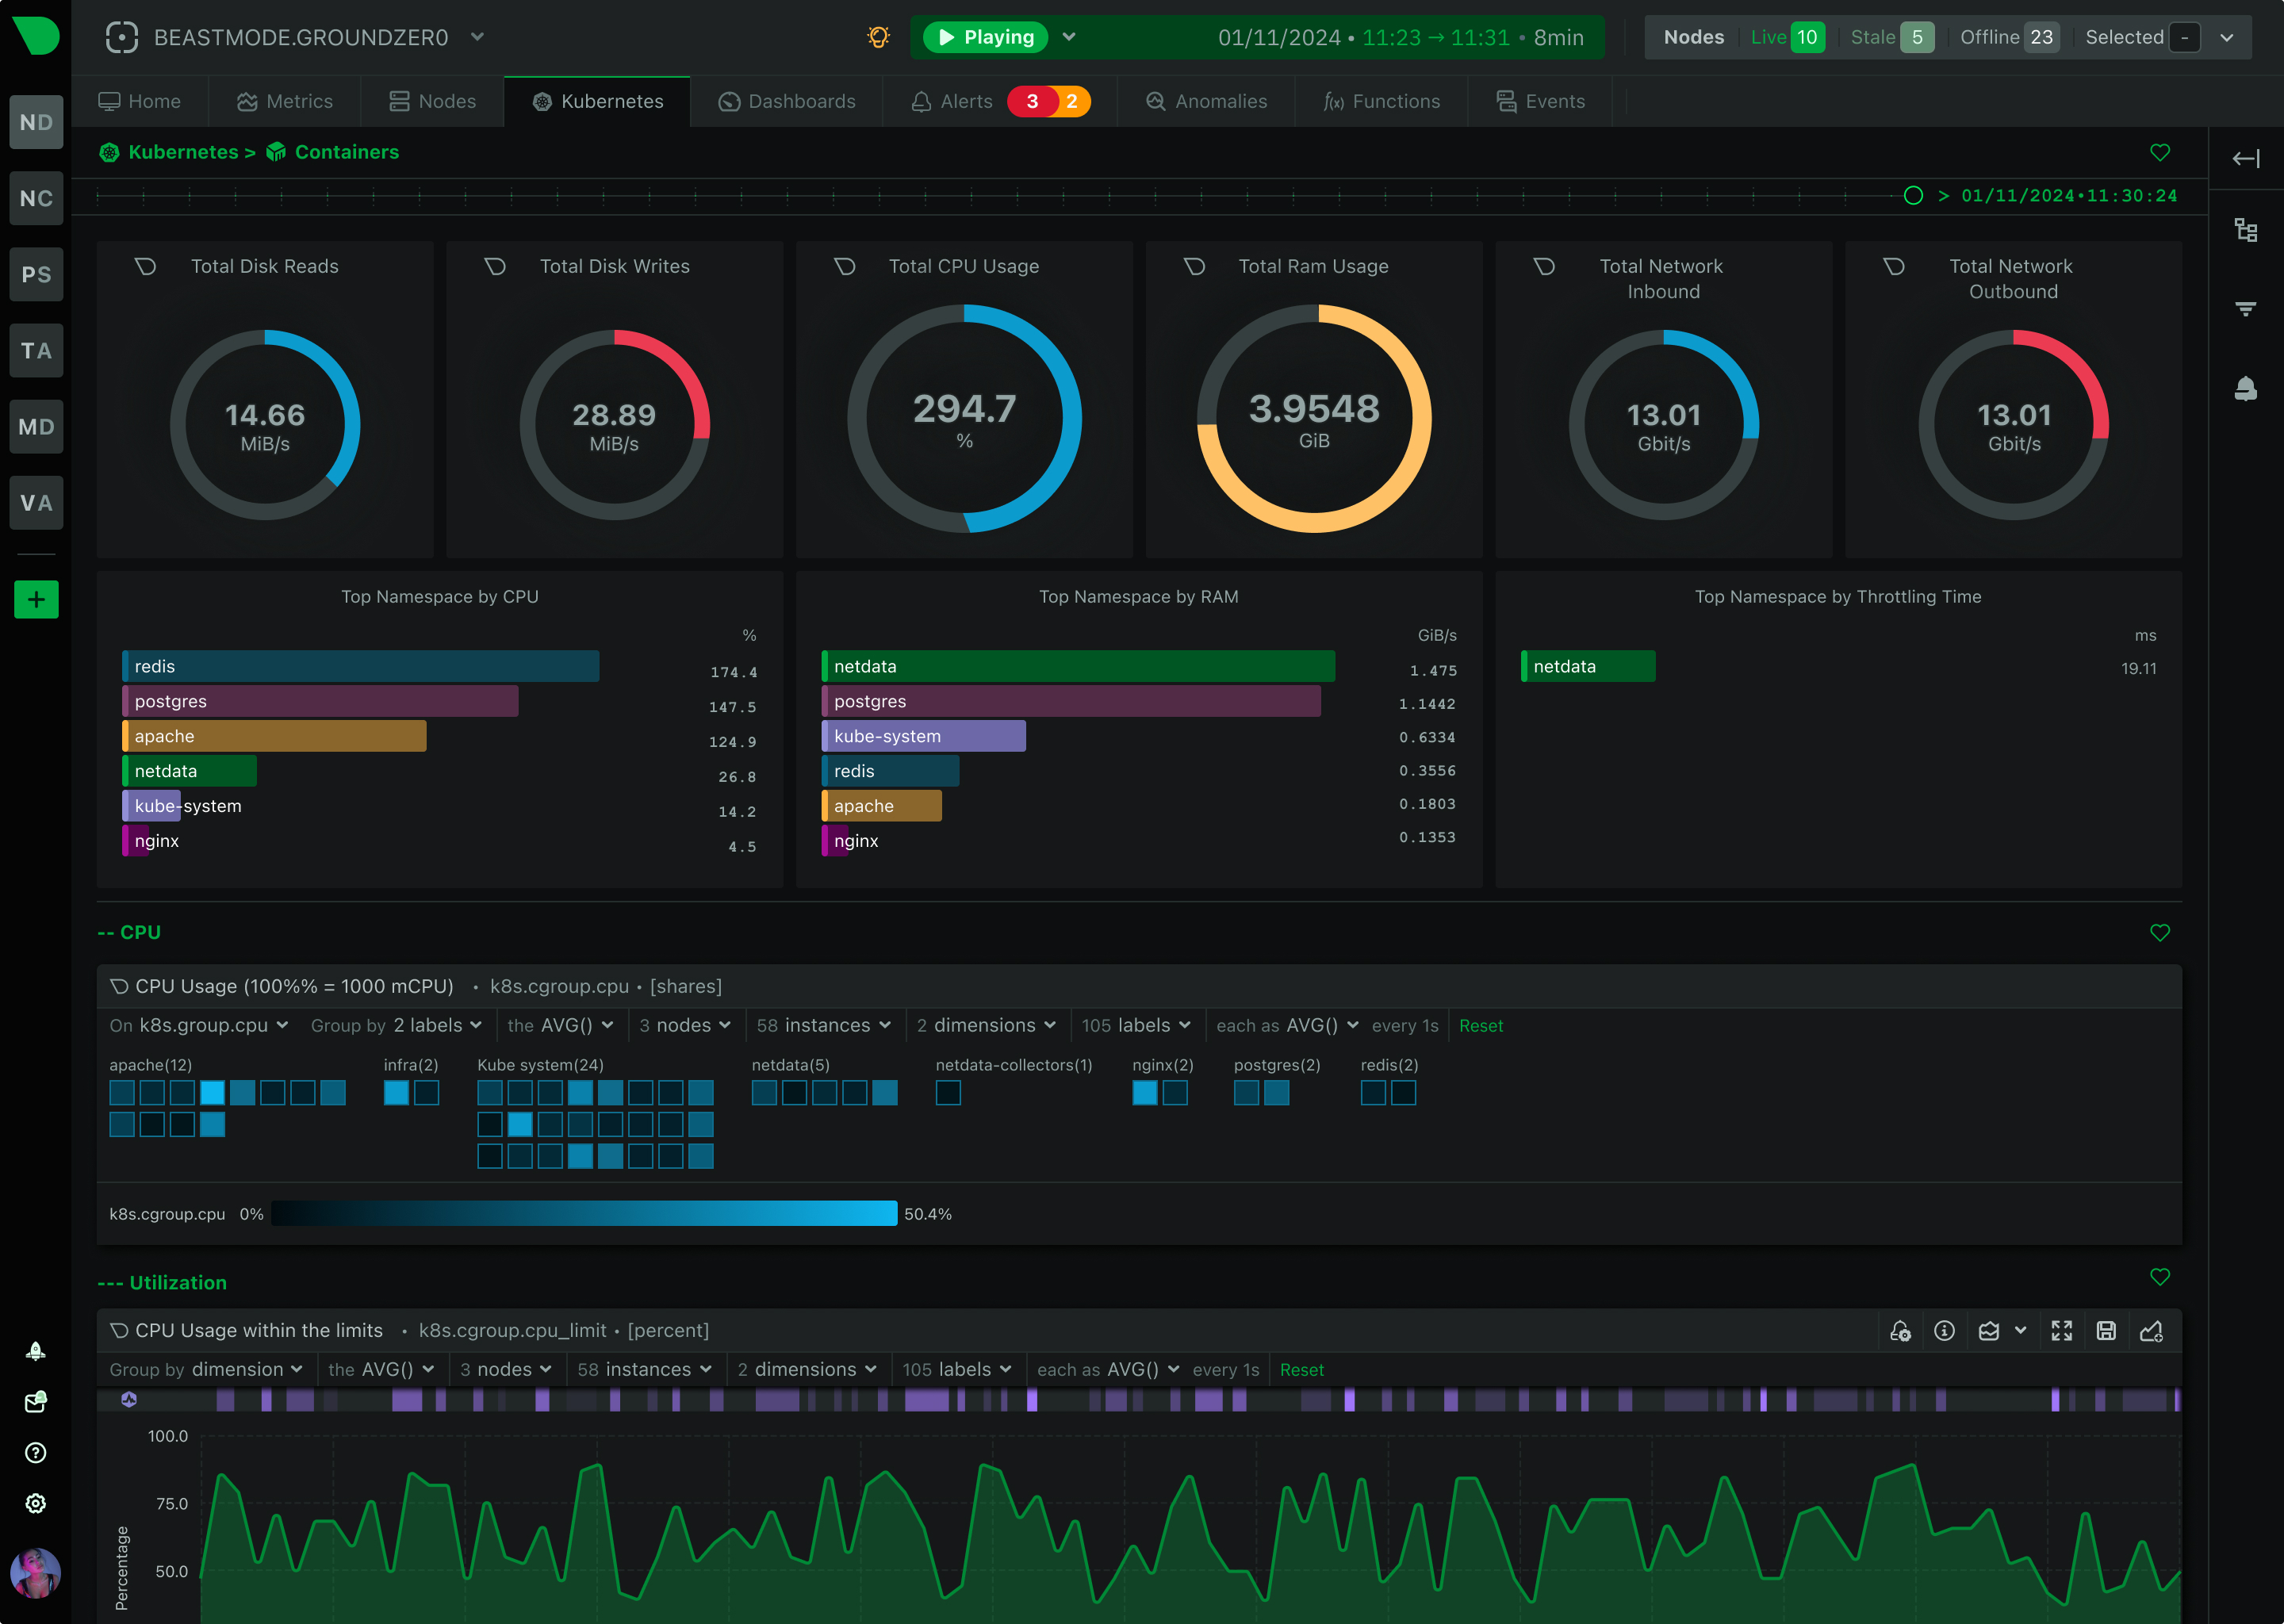
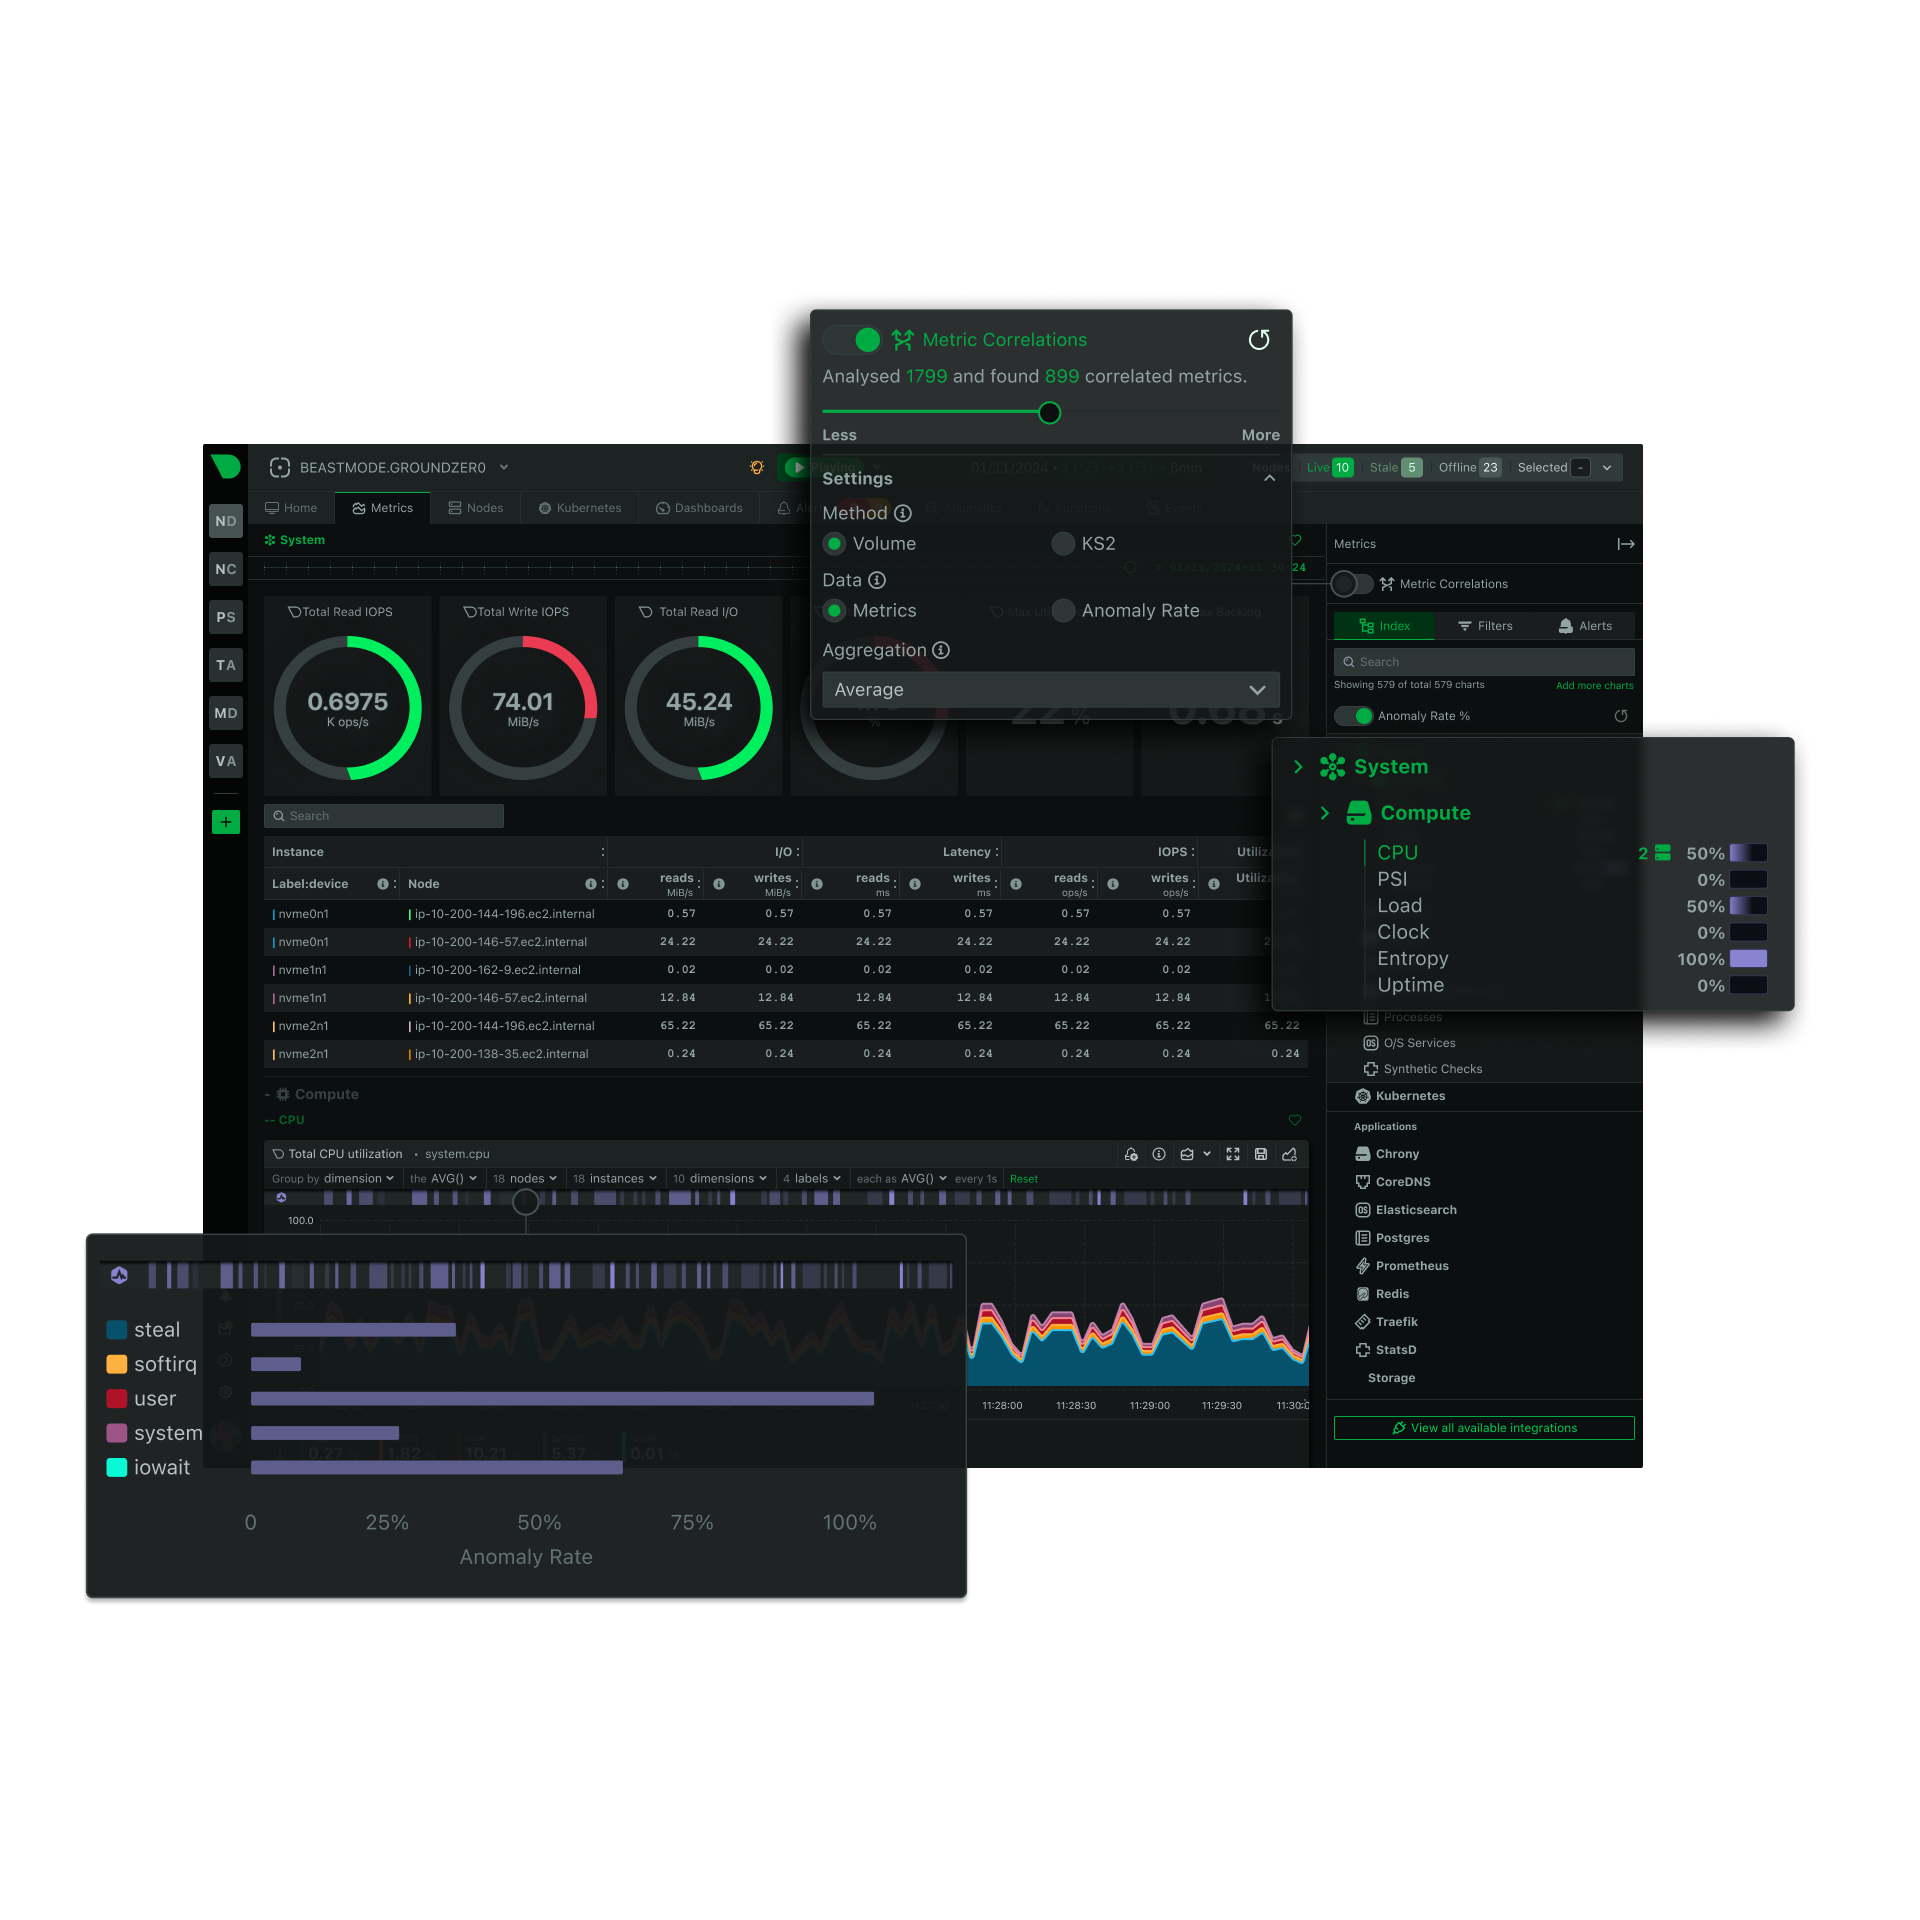
Get comprehensive, real-time insights into your applications, ensuring seamless user experiences and optimal resource utilization.

800+ Out of the Box Integrations

Effortlessly monitor your entire stack with Netdata

Trusted by Global Enterprises.

nvidia
sap
netflix
intel

Application Performance Monitoring Made Effortless

Per-second granularity reveals the intermittent issues other tools can't capture

  • Monitor every layer of your application stack effortlessly

    • Auto-discover every app and component in seconds with 800+ zero-config integrations
    • Monitor applications in real-time with per-second metrics and 1-second latency
    • See beyond averages with high-resolution data that captures every performance spike
    • Explore logs & metrics instantly using unified dashboards for apps and infrastructure
    • Real-Time Anomaly Detection: AI powered anomaly detection learns normal behavior for every metric enabling you to identify anomalies before they impact users.
    • Pre-configured alerts detect 100+ common issues out-of-the-boxR

  • Troubleshoot Faster Than Ever, cut MTTR in half

    • Interactive dashboards visualize requests end-to-end across distributed systems
    • Metric correlation engine surfaces related anomalies automatically
    • Live log analysis with systemd-journal and Windows Event integration
    • Historical replay lets you “scroll back time” to diagnose intermittent issues

  • Monitor at Scale Without Breaking the Bank

    • Resource Consumption Analysis: Identify applications and services consuming excessive resources, and adjust allocations to maintain optimal performance
    • Predictive Capacity Planning: Leverage historical data and trends to forecast future resource needs, preventing outages and ensuring scalability
    • Observability Industry’s lowest energy footprint enables you to monitor aggressively without the performance tax
    • Distributed edge storage reduces cloud data transfers and movement of data, bringing significant savings

  • Effortlessly Scale from Startup to Enterprise

    • Distributed metric processing – Scale horizontally without central bottlenecks
    • Automatic adaptation – Self-adjusts collection frequency based on system load
    • Flexible deployment options – Run anywhere from bare metal to containers to serverless
    • Multi-tenancy support – Isolate monitoring by team, application, or environment
    • 40x storage efficiency vs Prometheus for long-term metric retention

The observability platform companies need to succeed

Sign up for free

Want a personalised demo of Netdata for your use case?

Book a Demo

Read how businesses are transforming their IT operations with Netdata’s real-time monitoring and AI-powered insights.