The only agent that thinks for itself
Autonomous Monitoring with self-learning AI built-in, operating independently across your entire stack.
Centralized metrics streaming and storage
Aggregate metrics from multiple agents into centralized Parent nodes for unified monitoring across your infrastructure.
Fully managed cloud platform
Access your monitoring data from anywhere with our SaaS platform. No infrastructure to manage, automatic updates, and global availability.
Deploy Netdata Cloud in your infrastructure
Run the full Netdata Cloud platform on-premises for complete data sovereignty and compliance with your security policies.
Powerful, intuitive monitoring interface
Modern, responsive UI built for real-time troubleshooting with customizable dashboards and advanced visualization capabilities.
Monitor on the go
Native iOS and Android apps bring full monitoring capabilities to your mobile device with real-time alerts and notifications.
The future of infrastructure observability
See our strategic direction across AI-native observability, full-stack signals, operational intelligence, and enterprise platform maturity.
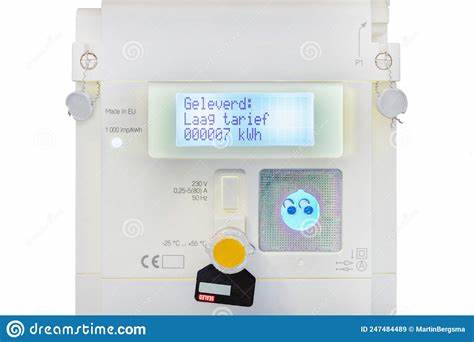
Best energy efficiency
True real-time per-second
100% automated zero config
Centralized observability
Multi-year retention
High availability built-in
Zero maintenance
Always up-to-date
Enterprise security
Complete data control
Air-gap ready
Compliance certified
Millisecond responsiveness
Infinite zoom & pan
Works on any device
Native performance
Instant alerts
Monitor anywhere
AI-native observability
Continuous delivery
Open source foundation