Real-Time Container Monitoring

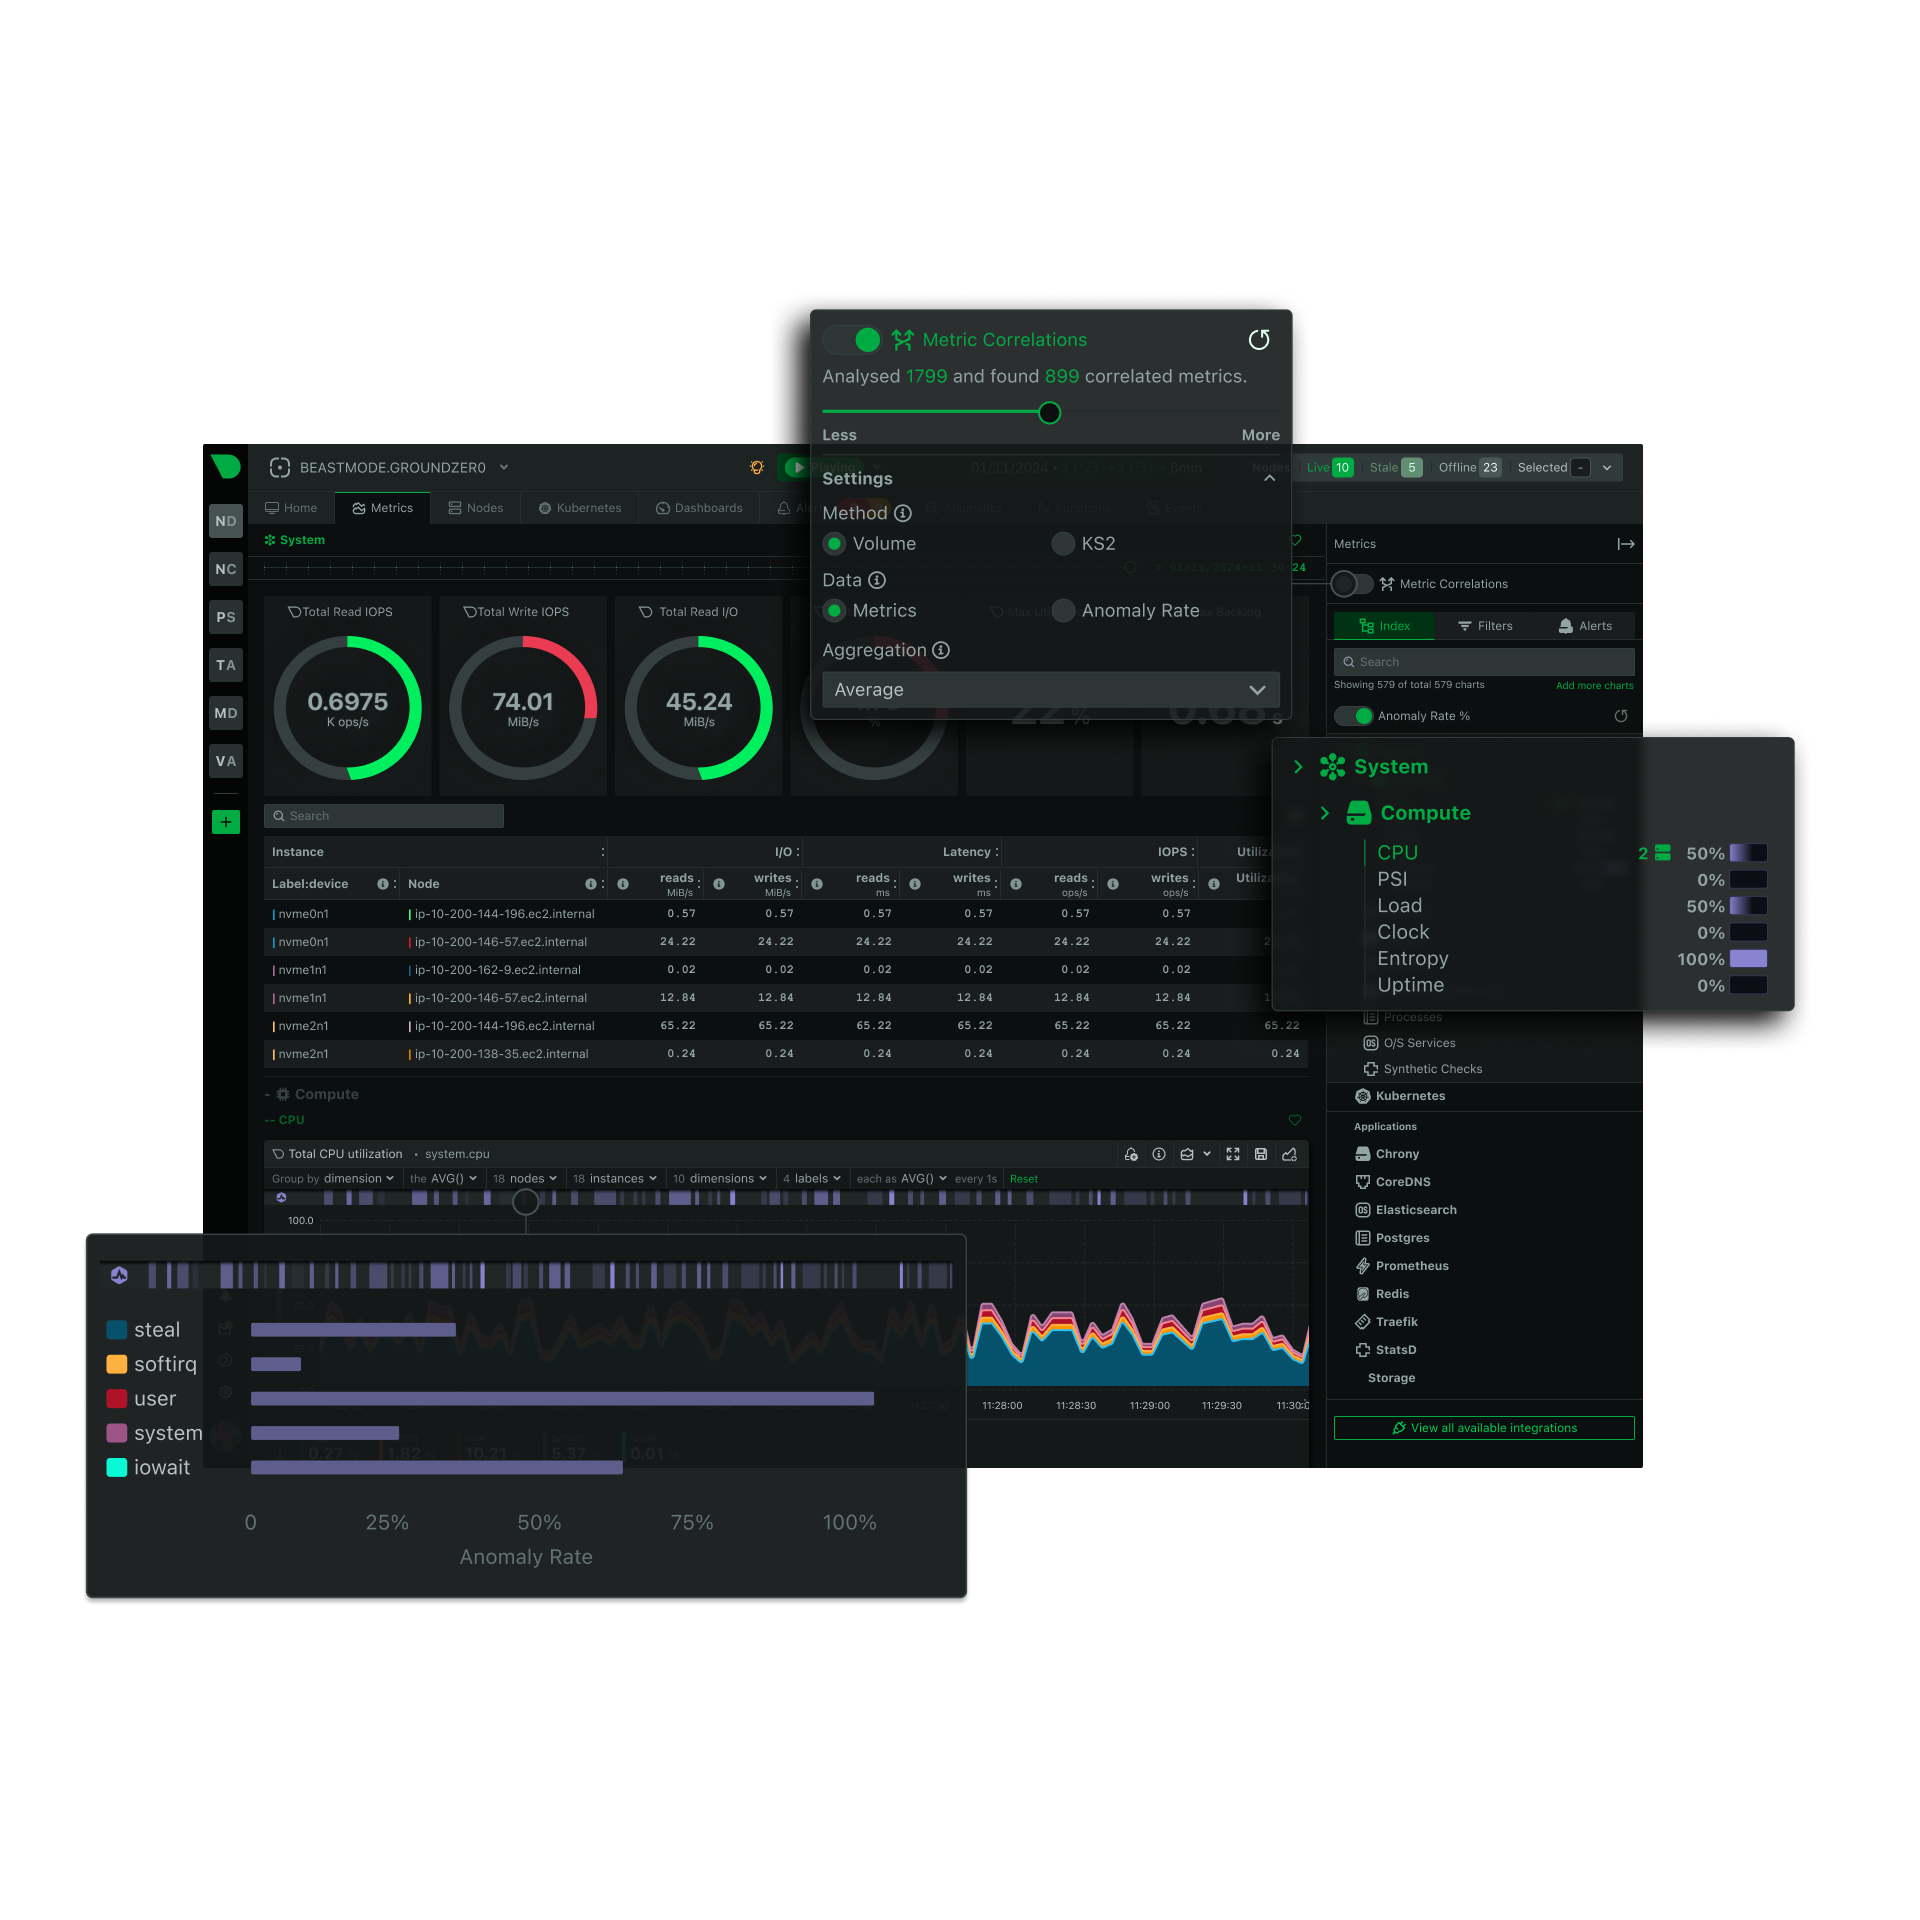
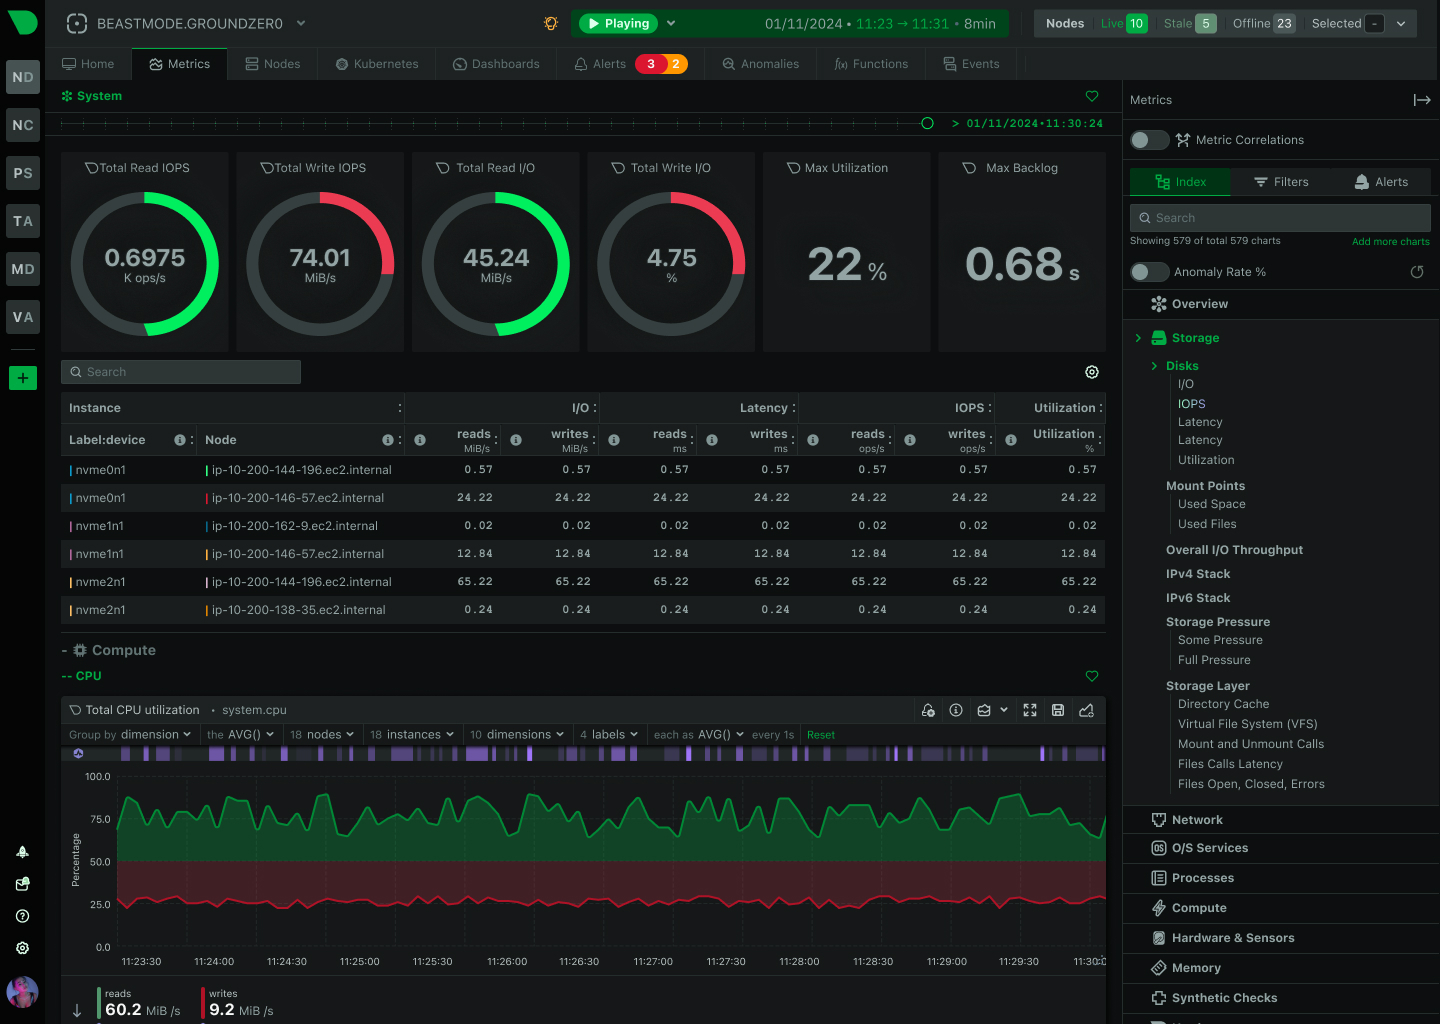
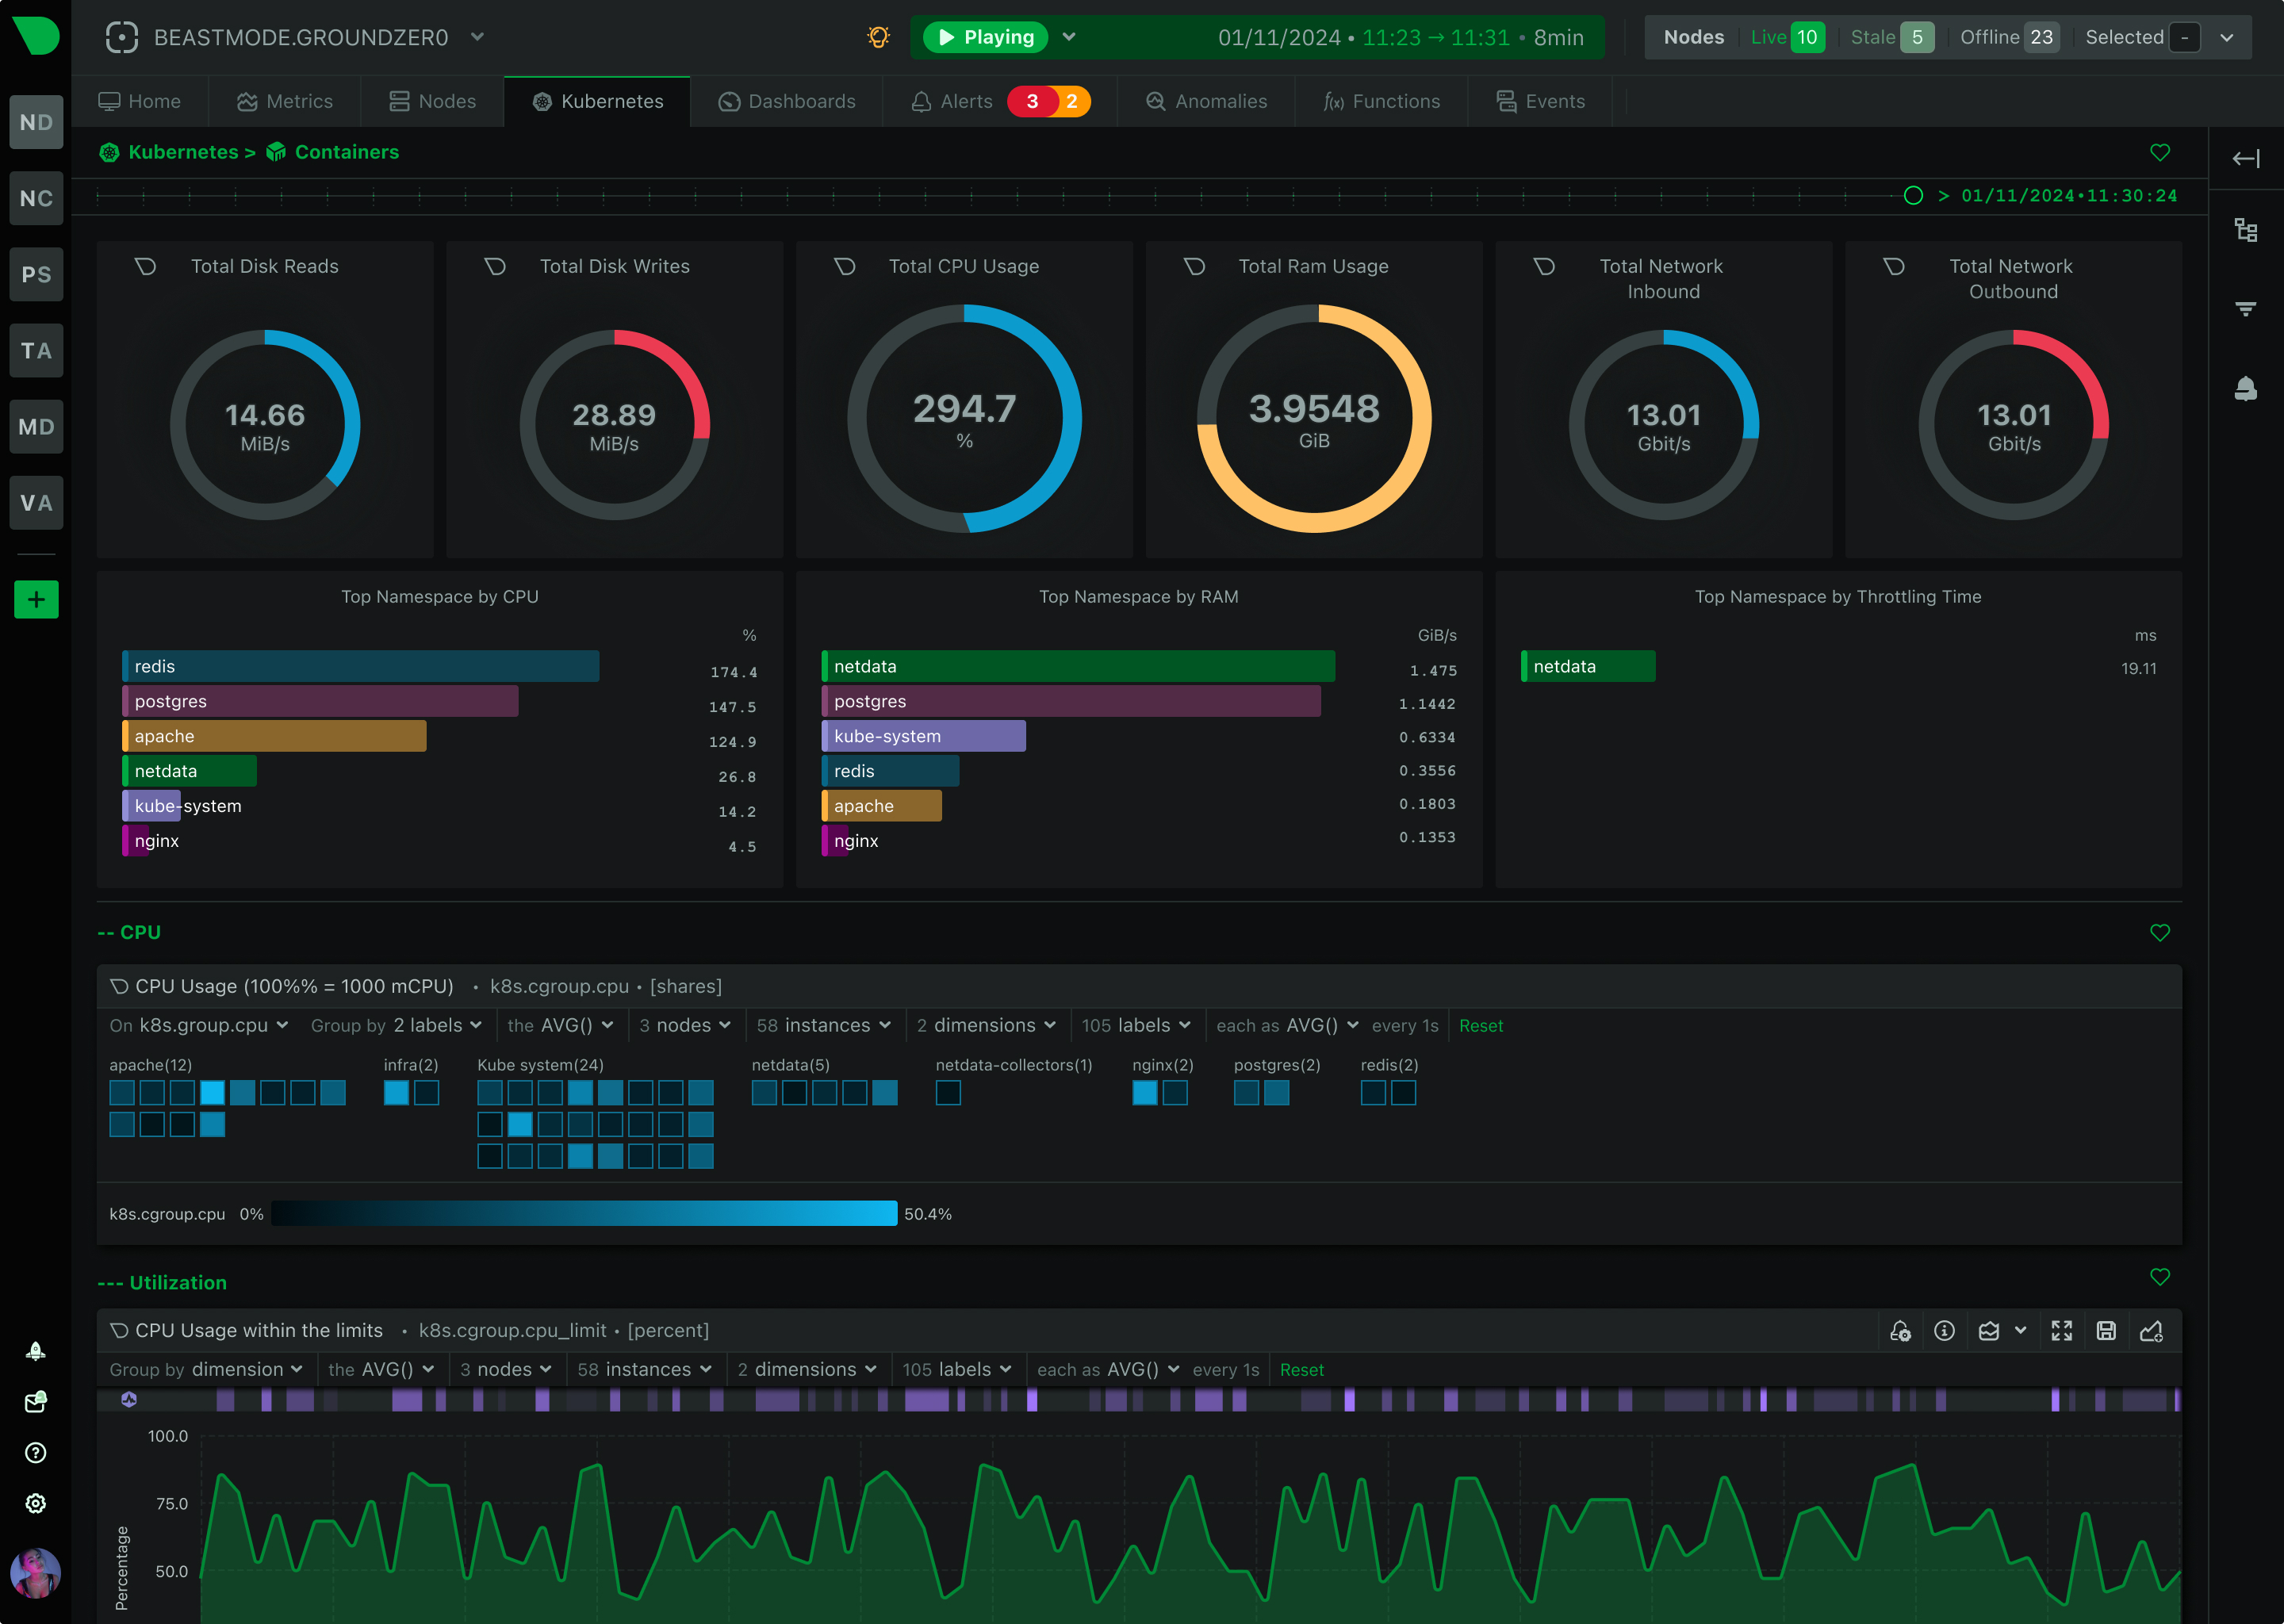
Real-Time Visibility from Docker to Kubernetes – See Everything in Your Containerized Environment with Per-Second Precision

Seamless Integrations with Your Stack.

Monitor Docker, Kubernetes, containerd and every container workload with zero configuration

Trusted by Global Enterprises.

nvidia
sap
netflix
intel

Troubleshoot Container Issues Before They Impact Users

  • Instantly Identify Resource Constraints & Performance Bottlenecks

    • Real-time resource visibility – Track CPU, memory, network, and disk metrics per-container with 1-second granularity
    • Throttling detection – Identify CPU cgroup limits affecting application performance
    • Memory pressure insights – Catch OOMKills and container evictions before they crash your services
    • Resource optimization – Fine-tune container requests and limits based on actual usage patterns
    • Cross-node correlation – Connect container performance with underlying infrastructure health

  • Cut MTTR For Container Failures By 70%

    • Container lifecycle monitoring – Track restarts, terminations, and deployment failures in real time
    • Automated anomaly detection – Identify abnormal container behavior before services degrade
    • Root cause analysis – Pinpoint whether issues originate in containers, nodes, or applications
    • Cross-container correlation – Connect related symptoms across distributed microservices
    • Kubernetes event integration – Associate performance issues with control plane events

  • Gain Complete Kubernetes Cluster Visibility

    • Comprehensive Kubernetes metrics – Monitor every layer from cluster to pod to container
    • Control plane monitoring – Track API server, scheduler, and controller manager performance
    • Service mesh integration – Monitor Istio, Linkerd, and Cilium with zero configuration
    • Ingress controller insights – Ensure reliable traffic routing with detailed metrics
    • Multi-cluster visibility – Monitor EKS, GKE, AKS and on-premises clusters from one dashboard

  • Monitor at Scale Without Performance Impact

    • Ultra-lightweight agent – Less than 1% CPU overhead even in high-density environments
    • Edge-native architecture – Process metrics at the source to minimize network overhead
    • Auto-discovery – Instantly detect and monitor new containers and pods as they’re created
    • Adaptive collection – Automatically adjust collection frequency based on system load
    • Horizontal scalability – Monitor from tens to thousands of nodes without bottlenecks

  • Dive Deep Into Container Metrics Without Getting Lost

    • Contextual navigation – Intuitively drill down from clusters to namespaces to pods to containers
    • Topology visualization – Understand complex container relationships at a glance
    • Interactive exploration – Investigate issues with real-time metric correlation
    • Customizable views – Create focused dashboards for different containerized applications
    • Unified metrics and logs – See container performance and log output in a single interface

The observability platform companies need to succeed

Sign up for free

Want a personalised demo of Netdata for your use case?

Book a Demo

Read how businesses are transforming their IT operations with Netdata’s real-time monitoring and AI-powered insights.