The only agent that thinks for itself

Autonomous Monitoring with self-learning AI built-in, operating independently across your entire stack.

Unlimited Metrics & Logs
Machine learning & MCP
5% CPU, 150MB RAM
3GB disk, >1 year retention
800+ integrations, zero config
Dashboards, alerts out of the box
> Discover Netdata agents
Centralized metrics streaming and storage

Aggregate metrics from multiple agents into centralized Parent nodes for unified monitoring across your infrastructure.

Stream from unlimited agents
Long-term data retention
High availability clustering
Data replication & backup
Scalable architecture
Enterprise-grade security
> Learn about Parents
Fully managed cloud platform

Access your monitoring data from anywhere with our SaaS platform. No infrastructure to manage, automatic updates, and global availability.

Zero infrastructure management
99.9% uptime SLA
Global data centers
Automatic updates & patches
Enterprise SSO & RBAC
SOC2 & ISO certified
> View pricing
Deploy Netdata Cloud in your infrastructure

Run the full Netdata Cloud platform on-premises for complete data sovereignty and compliance with your security policies.

Complete data sovereignty
Air-gapped deployment
Custom compliance controls
Private network integration
Dedicated support team
Kubernetes & Docker support
> Contact sales
Powerful, intuitive monitoring interface

Modern, responsive UI built for real-time troubleshooting with customizable dashboards and advanced visualization capabilities.

Real-time chart updates
Customizable dashboards
Dark & light themes
Advanced filtering & search
Responsive on all devices
Collaboration features
> Explore UI features
Monitor on the go

Native iOS and Android apps bring full monitoring capabilities to your mobile device with real-time alerts and notifications.

iOS & Android apps
Push notifications
Touch-optimized interface
Offline data access
Biometric authentication
Widget support
> Download apps

Best energy efficiency

True real-time per-second

100% automated zero config

Learn & Detect
Correlate
Understand & Act
Unsupervised ML
Anomaly Detection
Placeholder
Anomaly Advisor
Root Cause Analytics
Blast Radius Detection
AI Co-Engineer
AI Reporting
AI Chat

AI-Automation

Integrate with AI workflows and playbooks.

Model context protocol

Connect any MCP compatible AI

Automated playbooks

Intelligent incident response

Real-time infrastructure monitoring

Stop fighting your monitoring. Start solving problems.

Netdata delivers per-second visibility across your entire stack with AI-powered insights that help you detect, diagnose, and resolve issues 95% faster.

Background Hero

Monitor everything that matters

Infrastructure

Applications

Networks


Monitor bare metal servers, VMs, containers, and cloud instances with per-second granularity. Netdata automatically discovers your infrastructure and starts monitoring immediately.

Tab Background Infrastructure Dashboard

Why DevOps teams choose Netdata

Netdata helps you reduce downtime, detect problems early, and troubleshoot faster.

Healthcare Technology

Hospital network achieves 99.99% uptime with real-time monitoring

95% faster MTTR

Netdata's AI-powered insights helped us identify and resolve critical issues before they impacted patient care systems.

Enterprise-grade features for modern infrastructure

Everything you need to monitor, troubleshoot, and optimize your systems in real-time.

AI-Powered Anomaly Detection

Machine learning algorithms automatically detect anomalies and correlate them across your infrastructure to identify root causes.

Pre-Built Dashboards

800+ integrations with pre-configured dashboards. Start monitoring immediately without complex setup.

Multi-Cloud Support

Monitor AWS, GCP, Azure, and on-premises infrastructure from a single pane of glass.

SOC 2 Compliant

Enterprise-grade security and compliance. Your data stays in your infrastructure with edge processing.

Solving DevOps pain points at the source

Kubernetes complexity? Solved.

See everything—from bare metal to multi-cloud—in real time. Netdata automatically discovers pods, services, and nodes, providing instant visibility.

40% of DevOps teams cite Kubernetes as their #1 monitoring challenge.

> Explore Kubernetes monitoring

Kubernetes complexity? Solved.

Alert fatigue? Eliminated.

AI-powered anomaly detection reduces false positives by 90%. Only get alerted when it matters.

DevOps engineers spend 30% of their time managing monitoring alerts.

> Learn about AI monitoring

Alert fatigue? Eliminated.

The Real Cost of CheckMK's Limitations

CheckMK's architectural decisions create cascading operational problems that impact incident response, resource efficiency, and team productivity.

1-minute default intervals

(60-second granularity)

Miss 90% of operational anomalies

Lasting 2-10 seconds - microbursts, transient issues, short-lived spikes invisible

Centralized architecture

With manual configuration

Exponential complexity at scale

Performance degrades, resources multiply, operational overhead increases

Manual alert configuration

Requires expert knowledge

Alert fatigue and blind spots

Teams spend hours tuning thresholds while critical issues go undetected

Limited ML capabilities

Basic threshold-based alerting

Reactive firefighting mode

No predictive insights, only notifications after problems occur

Resource-intensive agents

High CPU and memory overhead

Infrastructure tax grows with scale

Monitoring itself becomes a performance bottleneck

Netdata vs. Prometheus

Independent performance testing results

Testing at 4.6 million metrics/second demonstrates Netdata's superior efficiency.

Metric

Netdata Parent

Prometheus

Netdata Advantage

CPU usage

~9.4 cores

~14.8 cores

36% less CPU

Memory usage

~6.3 GB

~9.7 GB

35% less RAM

Storage efficiency

0.6 bytes/sample

1.5 bytes/sample

60% less storage

> View full comparison
Gartner Peer Insights

Validated by experts, chosen by engineers

> See all reviews

Netdata has transformed our monitoring approach. The AI-powered insights have reduced our MTTR by 80%.

See full review

Gartner Digital Markets Badge

Best monitoring solution we've ever used. Zero-configuration deployment got us up and running in minutes.

See full review

Frequently asked questions

Deep dive into Netdata capabilities

Per-second visibility across your entire stack

Netdata collects metrics every second from 800+ integrations, providing unparalleled granularity. Unlike traditional tools that sample every 60 seconds, you'll never miss critical events.

1-second granularity

> Explore monitoring features
Real-Time Monitoring Dashboard

Experience Netdata at upcoming events

Live demos of AI-powered troubleshooting

Meet our engineering team

Exclusive swag and prizes

> View our events calendar

Join us at KubeCon, AWS re:Invent, and more industry events.

Per-Second Visibility

See metrics update in real-time as we demonstrate live infrastructure monitoring.

AI in Action

Watch Anomaly Advisor automatically identify root causes across distributed systems.

Zero Configuration

See how quickly you can deploy Netdata with our live installation demos.

Netdata Enterprise

Ready to transform your monitoring?

Join thousands of DevOps teams using Netdata to achieve faster MTTR, reduce costs, and gain unprecedented infrastructure visibility.

As we are close to the end of this year, we are thrilled to announce that Netdata has been recognized with multiple “Best of” badges from Gartner Digital Markets brands: Capterra, Software Advice, and GetApp, leading software recommendation search engines.

This “Best of” badges program is an independent assessment that evaluates user reviews to help buyers identify the highest-rated software companies in specific categories that offer the most popular solutions.

“Receiving these badges is truly honorable and reinforces the value we deliver to our users every day. At Netdata, we are proud to offer the simplest, fastest, and significantly easier real-time and low-latency monitoring system that sets the standard for infrastructure monitoring and observability. This recognition reflects the incredible feedback and support of our global community.”

— Costa Tsaousis, CEO

Check out what our customers have to say about their experience with us

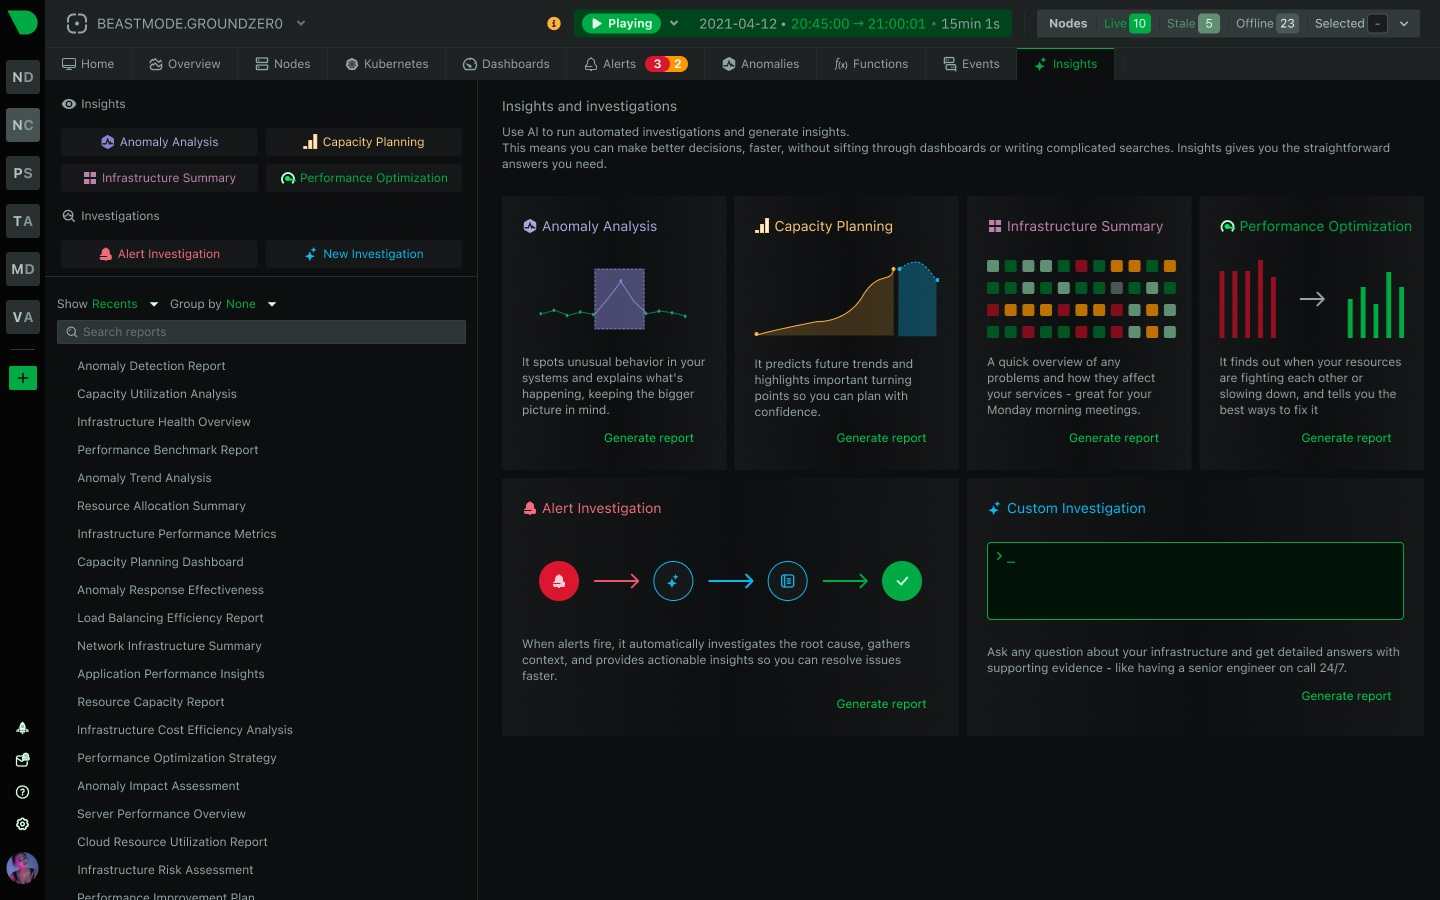
With per-second metric granularity, edge-based machine learning for anomaly detection, and a powerful Agentic AI for automated root cause analysis, Netdata streamlines troubleshooting and transforms reactive firefighting into proactive engineering. It offers a single, integrated solution for data collection, storage, visualization, and alerting, eliminating the complexity of stitching together multiple tools.

What is Last9?

Last9 is a Site Reliability Engineering (SRE) platform focused on improving software reliability. It is not a primary monitoring tool but rather an analysis layer that sits on top of your existing observability data, typically from sources like Prometheus. Last9’s core strengths lie in its ability to help teams define, manage, and track Service Level Objectives (SLOs) and error budgets.

Its “Change Intelligence” feature connects software deployments and configuration changes to shifts in system behavior, helping engineers understand the impact of their work. Last9 is built for SRE teams who have an established monitoring pipeline and need a specialized tool to formalize their reliability practices and reduce alert fatigue by focusing on user-impactful issues.

Key Features of Last9

Last9 provides several capabilities designed specifically for SRE teams:

  • SLO Management: Define and track service level objectives across your infrastructure
  • Error Budgets: Monitor error budgets to balance feature velocity with reliability
  • Change Intelligence: Connect deployments to performance impacts
  • Alert Correlation: Reduce noise by correlating related alerts

Why Choose Real-Time Monitoring?

Real-time monitoring is essential for modern infrastructure management. Traditional monitoring tools that sample metrics every 60 seconds miss critical events and anomalies that occur between sampling intervals.

Netdata’s per-second granularity ensures you never miss important events, providing the visibility needed to:

  1. Detect issues immediately before they cascade
  2. Understand system behavior during critical incidents
  3. Optimize performance with accurate, high-resolution data
  4. Reduce MTTR through faster problem identification