The moment of truth arrives. You’ve tested the new version of your application, the container image is pushed, and the deployment pipeline is ready. You click “deploy,” and a wave of anxiety hits. Will this be a smooth, zero-downtime rollout, or will your dashboards soon light up with 502 Bad Gateway and 504 Gateway Timeout errors? For many teams using advanced deployment strategies like Blue-Green or Canary, this fear is all too real.
These strategies are designed to de-risk releases by controlling how and when new code is exposed to users. NGINX is a phenomenal tool for directing traffic in these scenarios, but a simple traffic shift is not enough. Without a deep, real-time understanding of what’s happening at the NGINX gateway and within the new application instances, you’re deploying blind. A misconfigured health check or a hidden performance bottleneck in the new code can quickly turn a seamless deployment into a user-facing outage.
Success hinges on observability. By monitoring the right metrics and setting up intelligent alerts, you can build a safety net that automatically validates the health of a release and enables confident, error-free deployments.
Blue-Green vs. Canary Deployments with NGINX
Before diving into metrics, let’s quickly recap how these strategies work with NGINX as the traffic cop.
- Blue-Green Deployment: You maintain two identical, parallel production environments: “Blue” (the current version) and “Green” (the new version). All live traffic goes to Blue. When you’re ready to deploy, you route 100% of the traffic from Blue to Green. NGINX simply updates its
proxy_passtarget from the Blue upstream group to the Green one. This is fast and simple, but it’s an all-or-nothing switch. - Canary Deployment: This is a more gradual approach. The new version, the “canary,” is deployed alongside the stable version. NGINX is configured to send a small percentage of traffic (e.g., 1%) to the canary. You then monitor its performance. If it’s healthy, you progressively increase its traffic weight—5%, 20%, 50%, and finally 100%—until the canary has fully replaced the old version. Tools like Flagger or Argo Rollouts often automate this
traffic_shift_nginxlogic.
Both strategies promise to reduce deployment risk, but they introduce a critical moment of transition where things can go wrong.
The Root Causes of 502 and 504 Errors During Deployments
A spike in 5xx errors during a rollout is a clear signal that something is wrong. The specific error code gives you a clue about where to look.
Why You Get a 502 Bad Gateway
A nginx 502 deploy error means NGINX successfully connected to the network, but the upstream service (your new Green or Canary instance) gave it an invalid response or closed the connection. Common causes during a deployment include:
- Premature Traffic Shift: The new application container has started, but the application process inside it hasn’t fully initialized, bound to its port, or become ready to accept connections. NGINX sends a request, and nothing is there to answer it correctly.
- Failed Health Checks: Your
deployment health_checkmight be too simple. It might just check if a port is open, but not if the application is truly healthy and connected to its database and other dependencies. - Connection Refused: The new pods might be crash-looping, or a misconfigured Kubernetes service or firewall rule is preventing NGINX from connecting to the new application pods.
Why You Get a 504 Gateway Timeout
A nginx 504 deploy error means NGINX connected to the upstream service, but the service didn’t respond within NGINX’s timeout period. This points to a performance problem in the new version.
- Application Slowness: The new code could have a performance regression, a slow database query, or a memory leak that causes it to respond slowly under load.
- Resource Contention: The new deployment might be starved for CPU or memory, especially if it’s running on a shared Kubernetes node.
- Cold Starts & Cache Warming: The first few requests to a new instance can be slow as it warms up caches, establishes database connection pools, and JIT-compiles code. If traffic is shifted too quickly, these initial slow responses can stack up and cause timeouts.
The Essential Deployment KPIs for NGINX Success
To catch these issues before they impact users, you need to monitor a core set of deployment KPI metrics. This observability_metrics dashboard becomes your single source of truth during a rollout.
NGINX Gateway Metrics: The User’s Perspective
These metrics tell you what the end-user is experiencing. They are your most important rollback_metric indicators.
- 5xx Error Rate: This is your primary health signal. Any increase in the
5xx_spikeduring a canary analysis is a critical failure. The goal is to keep this rate at or near zero. - Upstream Latency (P95/P99): How long is NGINX waiting for a response from your application? Compare the latency of the canary version against the stable version. A significant increase indicates a performance regression that needs investigation.
- Request Rate: Monitor the traffic volume being served by the canary. Does a 10% traffic weight in your configuration translate to roughly 10% of the total requests being handled by the new instances? If not, there could be a connection or configuration problem.
Application & System Metrics: The Canary’s Health
These metrics give you insight into the internal state of your new application instances.
- CPU & Memory Utilization: Is the new code more resource-intensive? A canary deployment is the perfect time to catch unexpected spikes in CPU or memory leaks before they affect the entire user base.
- Application-Specific Error Rate: Look inside your application. Are you seeing an increase in logged exceptions, authentication failures, or other business-logic errors that don’t result in a 5xx response?
- Pod/Container Restarts: In a containerized environment, are the new pods stable, or are they crash-looping? This is a clear sign of a critical startup failure.
Building an Alerting Safety Net for Zero-Downtime Rollouts
Metrics are only useful if they drive action. Setting up automated canary thresholds and alerts is what transforms monitoring data into a robust deployment safety net. Your goal is to define your deployment_slo (Service Level Objective) and configure alerts to enforce it.
Setting error_rate_alert and gateway_error_alert
Your alerting strategy should be multi-faceted.
- Absolute Thresholds: The simplest alert. “Fire an alert if the NGINX 5xx error rate exceeds 1% for more than 60 seconds.” This is a hard line that should never be crossed.
- Relative Change (Anomaly Detection): More sophisticated. “Fire an alert if the P99 latency for the canary upstream is 50% higher than the baseline of the primary upstream.” This catches performance regressions even if the absolute latency is still within an acceptable range.
- Saturation Alerts: “Fire an alert if CPU utilization on canary pods is > 90% for 5 minutes.” This warns you about resource exhaustion before it causes cascading failures.
Automated deployment tools like Flagger are designed to consume these metrics, often via a nginx prometheus exporter. You define your thresholds in the canary analysis spec, and Flagger will automatically halt the rollout and rollback if a threshold is breached.
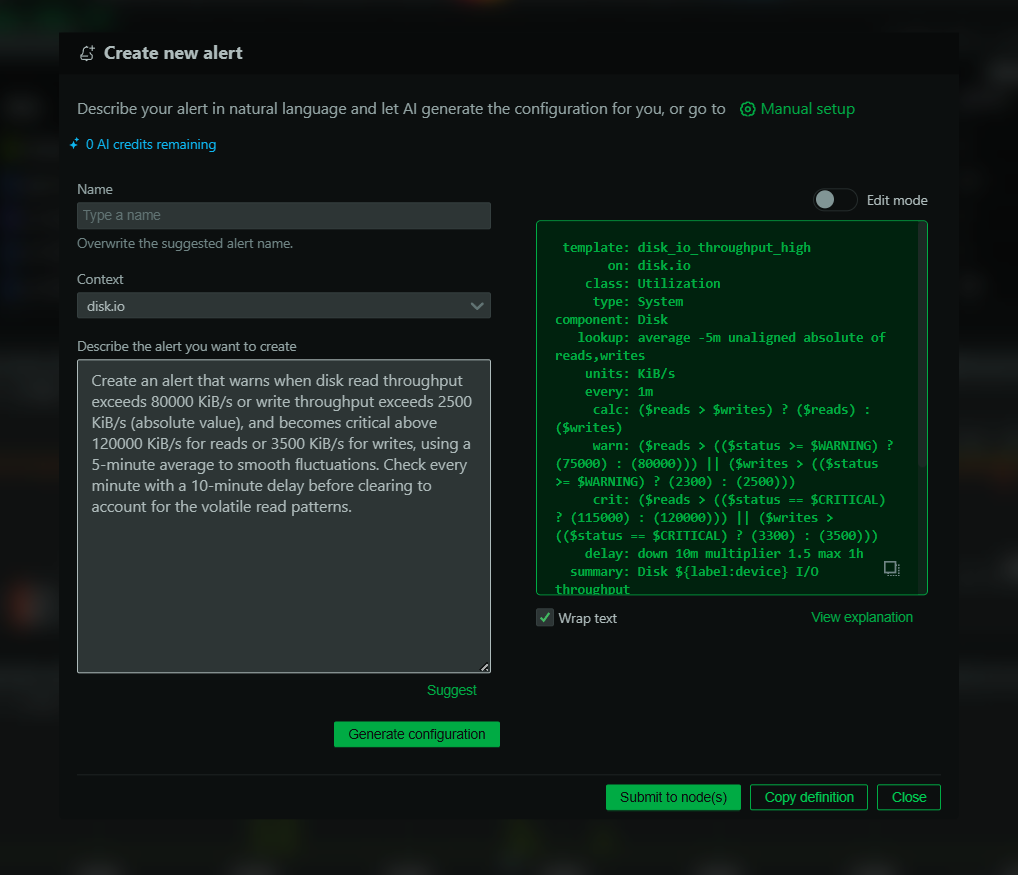
Monitoring all these disparate metrics from NGINX, the kernel, and your application can be complex. Solutions like Netdata simplify this by automatically discovering your services and providing comprehensive, pre-configured nginx dashboards out of the box. You get immediate visibility into NGINX error rates, system resource usage, and application metrics in one place, making it easy to see the full picture during a critical deployment.
By shifting from a “deploy and pray” mentality to a data-driven approach, you can turn risky rollouts into non-events. With the right progressive_delivery strategy, powered by NGINX and backed by comprehensive observability, you can finally hit the deploy button with confidence.
Ready to achieve true zero_downtime deployments? Try Netdata today to get the instant visibility you need to monitor and safeguard your release pipeline.


