What Is Amazon Web Services (AWS)?
AWS, or Amazon Web Services, is an expansive suite of cloud-based computing services that offer businesses of all sizes the ability to build, store, and manage data in the cloud. It is one of the largest and most successful cloud-computing services in the world. With its range of features and capabilities, AWS enables businesses to optimize their data storage and management, enabling them to scale as their needs grow. You can use AWS to store and access your data from anywhere, as well as to quickly deploy applications or databases without having to manage physical hardware.
Why Is AWS Monitoring Important?
As businesses scale their cloud infrastructure, AWS monitoring becomes essential for maintaining system performance, cost efficiency, and security. Without effective monitoring, organizations risk unexpected downtime, resource overuse, and performance bottlenecks that impact end users.
Prevent Downtime & Ensure High Availability
AWS runs on a distributed cloud infrastructure, meaning failures can happen at any level—EC2 instances, databases, storage, or network layers. Monitoring detects early signs of failure, allowing teams to act before an issue escalates.
Example: If an EC2 instance reaches high CPU utilization, monitoring can trigger an autoscaling event to prevent system overload.
Optimize AWS Cost Management
AWS operates on a pay-as-you-go model, meaning unoptimized resource usage can increase cloud costs significantly.
Monitoring tracks idle resources, helping teams downsize underutilized instances or optimize Reserved Instances.
Example: If a Lambda function executes more often than expected, monitoring can identify inefficient code execution causing higher-than-expected costs.
Improve Application Performance
AWS monitoring provides real-time visibility into request latency, network traffic, and API response times.
Analyzing trends in these metrics allows teams to improve load balancing, cache efficiency, and database performance.
Example: If an RDS database query takes longer than normal, monitoring can pinpoint whether the issue is indexing, CPU limits, or high read/write latency.
Strengthen Security & Compliance
AWS monitoring tracks unauthorized access attempts, unusual traffic spikes, and API misuse, which could indicate security threats.
Integrating monitoring with AWS CloudTrail logs allows security teams to detect and investigate suspicious activity.
Example: If a DDoS attack floods an EC2 instance with traffic, monitoring can trigger an auto-scaling event or security alert.
Ensure Compliance With AWS Best Practices
Many industries require compliance with HIPAA, GDPR, SOC 2, and ISO 27001. AWS monitoring provides audit logs and real-time visibility to ensure compliance standards are met.
Example: Tracking S3 bucket access logs helps organizations ensure sensitive data isn’t exposed publicly.
AWS monitoring helps organizations reduce downtime, optimize costs, improve performance, enhance security, and meet compliance requirements. Tools like Netdata enable teams to monitor resources in real time and take proactive actions before issues escalate.
What Are The Benefits Of Real-Time AWS Monitoring?
Real-time monitoring provides instant insights into AWS performance metrics, allowing teams to act quickly when issues arise. Traditional monitoring solutions often collect data in 5-minute intervals, but real-time monitoring detects performance changes immediately.
Faster Issue Detection
Real-time alerts notify teams instantly when a system metric exceeds safe thresholds.
Unlike traditional monitoring, which detects issues after they have already impacted users, real-time monitoring allows for proactive resolution.
Example: A Lambda function exceeds memory limits, causing failures. A real-time alert triggers an auto-scaling adjustment before users are affected.
Optimized Resource Allocation
Cloud resources should scale dynamically based on real-time demand.
Monitoring helps adjust resource provisioning to prevent over-provisioning (wasted cost) or under-provisioning (slow performance).
Example: An EC2 instance hosting a web app spikes to 90% CPU usage. Real-time monitoring triggers an autoscaling event to add more instances before users experience slowdowns.
Reduced Mean Time To Resolution (MTTR)
Faster problem identification equals faster resolution.
Real-time monitoring shortens the troubleshooting process by providing live system data instead of relying on retrospective logs.
Example: If an RDS instance crashes, Netdata’s real-time logs provide immediate cause analysis, helping engineers fix the issue quickly.
Increased Application Uptime & Reliability
AWS-based applications need high availability and fault tolerance.
Monitoring provides early warnings on resource constraints, latency spikes, and API failures.
Example: A load balancer detects uneven traffic distribution. Real-time monitoring triggers a health check and redirects traffic to healthy instances.
Improved Security & Anomaly Detection
AWS monitoring can detect suspicious activity, such as unexpected access attempts, failed login attempts, and sudden traffic spikes.
Real-time alerts allow security teams to act immediately, preventing potential data breaches or service disruptions.
Example: An unauthorized user attempts to modify IAM policies. A real-time security alert flags the suspicious activity and blocks the action before changes take effect.
Real-time AWS monitoring provides faster incident detection, proactive resource scaling, reduced downtime, and enhanced security. With Netdata, businesses can monitor AWS environments per second, ensuring optimal cloud performance.
Install Netdata On AWS (Amazon Web Services)
Netdata is fully compatible with Amazon Web Services (AWS). You can install Netdata on cloud instances to monitor the apps/services running there, or use multiple instances in a parent-child streaming configuration.
- Sign up to https://app.netdata.cloud/
- You will be presented with an empty space, and a prompt to “Connect Nodes” with the install command for each platform
- Select the platform you want to install Netdata to, copy and paste the script into your node’s terminal, and run it
You can add one or more VMs or the entire Elastic Kubernetes Service (AWS EKS) Cluster on Netdata Cloud and monitor 100s of 1000s of system level and application metrics with zero configuration.
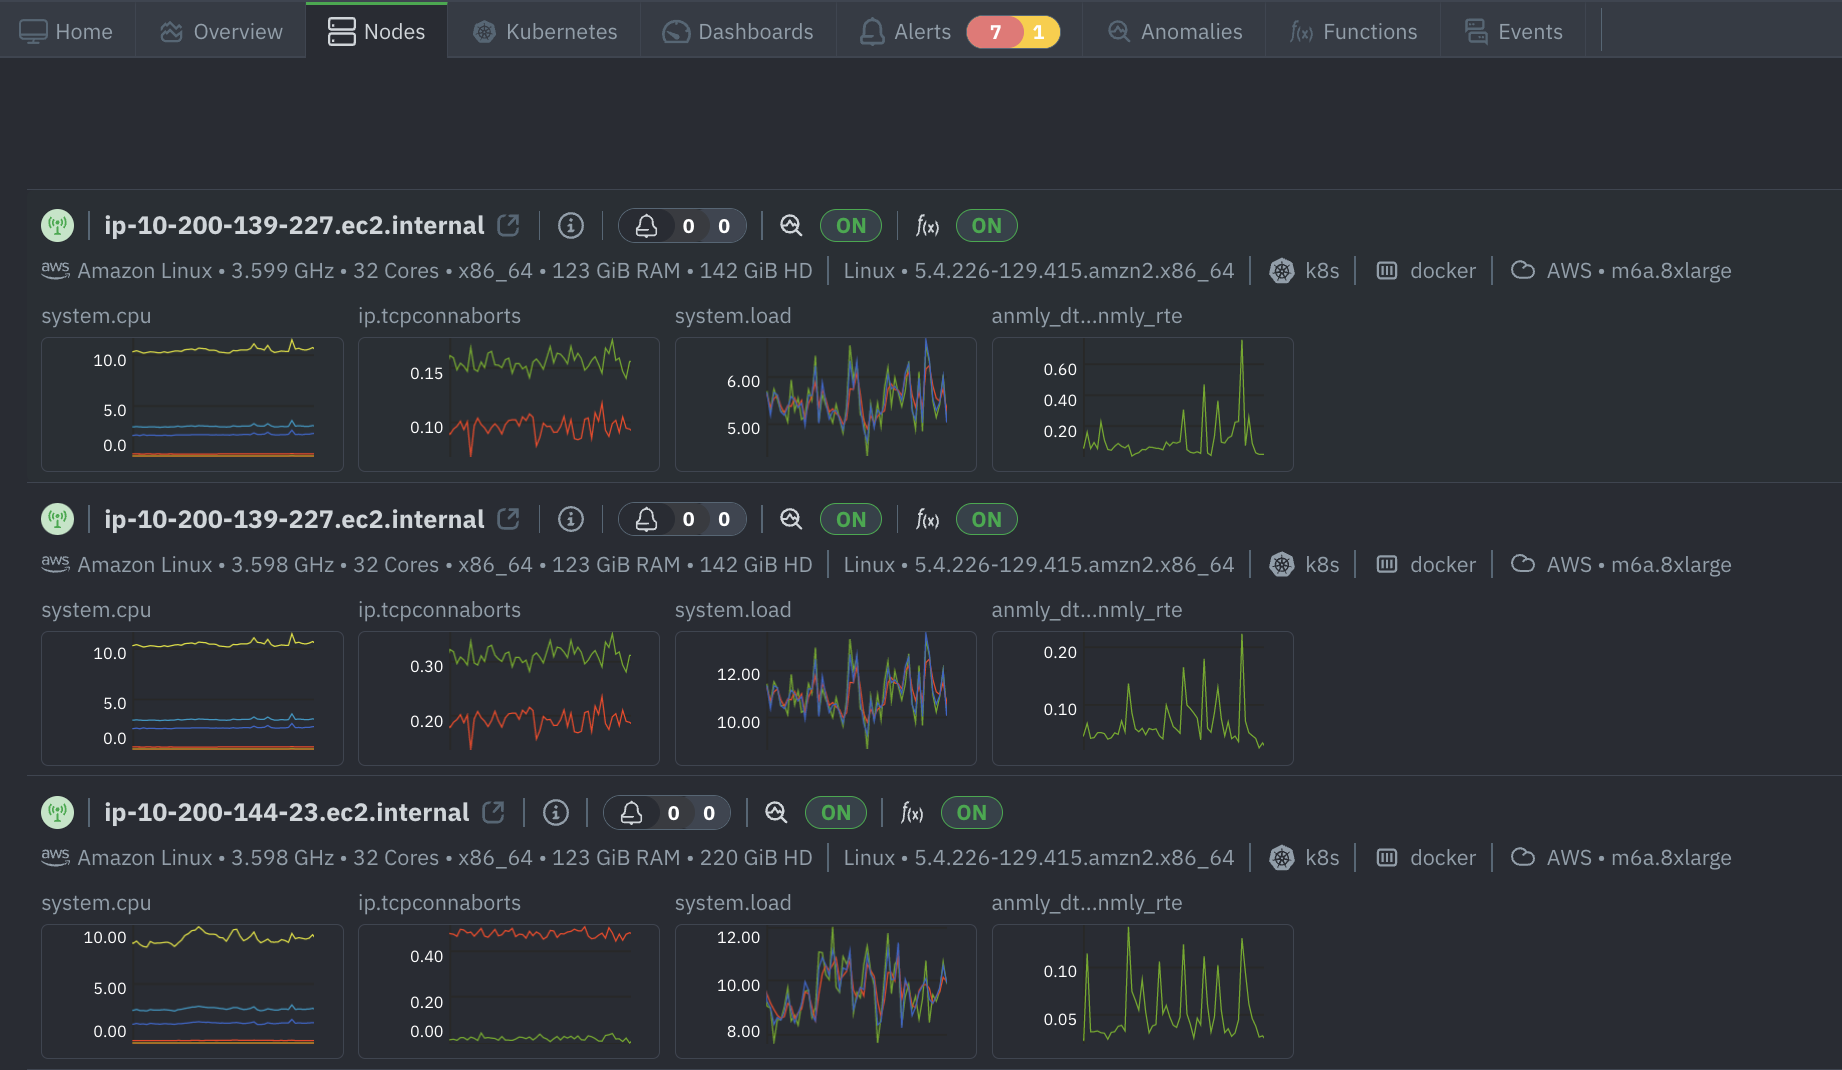
All the AWS EC2 VMs (or the EKS Cluster) will show up on the Nodes tab.
Key Metrics For AWS Monitoring & Why They Are Important
Like with any cloud solution, it is absolutely essential to monitor the AWS system level metrics to keep a tab on the Cloud resources being utilised in addition to Operational and Performance metrics from the applications running on the Cloud.
Infrastructure Monitoring
Monitor the underlying infrastructure of the cloud environment, such as the hardware, software, and networks that make up the cloud.
Availability Monitoring
Ensure that applications and services are available and accessible to users.
Performance Monitoring
Ensure that applications are running smoothly by tracking resource usage over time such as CPU utilization and memory consumption and help optimize the cloud environment for better performance while reducing costs.
Security Monitoring
Cloud security is crucial and thus monitoring for potential threats is a must. Security monitoring tools can help detect malicious activity such as data breaches, unauthorized access attempts, DDoS attacks, and more.
Capacity Monitoring
Ensure that there is enough capacity to handle the workload without any performance issues and handle changes in workloads.
Usage Monitoring
Usage monitoring helps businesses understand how their cloud resources are being used and by whom to make decisions about usage policies, cost optimization strategies, and more.
AWS Monitoring With Netdata Using Cloudwatch
The Amazon Cloudwatch, is a powerful monitoring and logging service provided by Amazon Web Services (AWS). In order to holistically monitor AWS and all its hosted services, it is extremely important to gather and visualise metrics from Cloudwatch.
Netdata is capable of scraping metrics in the OpenMetrics format. There are a number of Prometheus collectors available to collect metrics from Amazon Cloudwatch and the following are the most famous ones:
- Cloudwatch exporter - This is an AWS Java SDK based collector.
- Yet another Cloudwatch exporter - YACE - This is written in Go and uses the official AWS SDK.
The setup and configuration details for these collectors are available in the links above. Once these are setup, you can immediately visualise all the needed AWS metrics with ready to use dashboards without the need to create them manually. You can configure the Netdata Prometheus endpoint collector to define labels, filter out metrics etc.
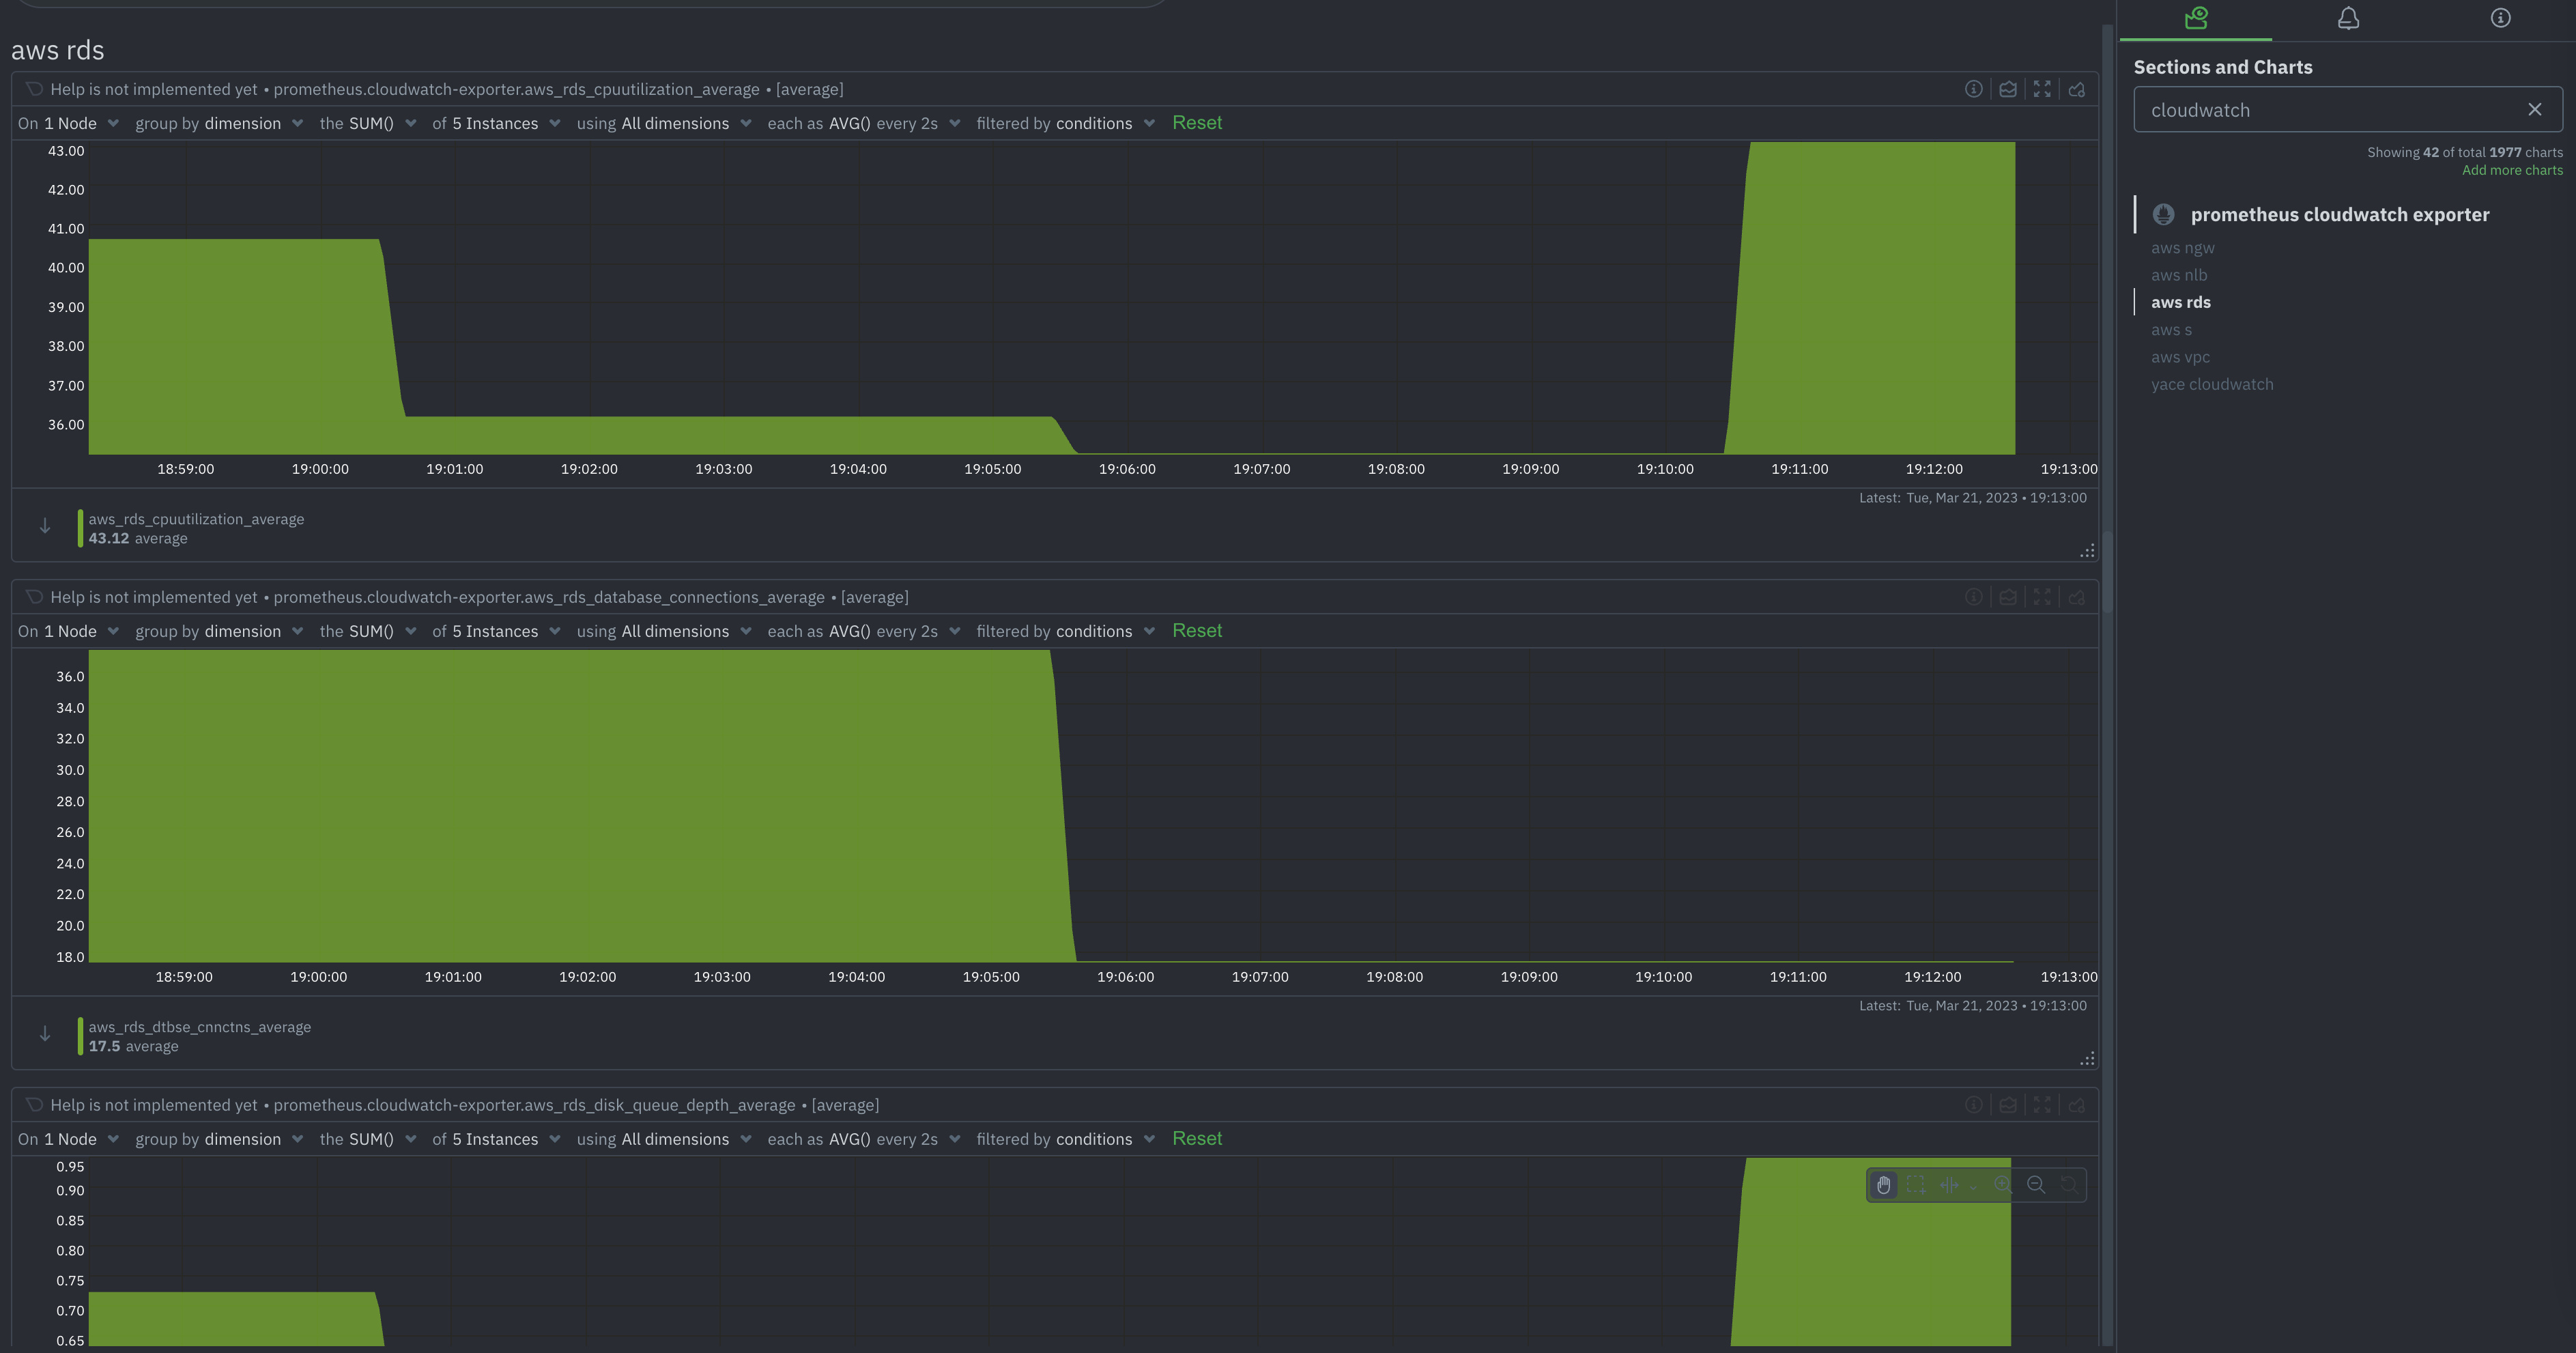
Cloudwatch is a pay-as-you-go service, and the pricing structure can be complex, with different features and metrics having different costs. The users must evaluate their use-case and the costs associated with monitoring their AWS infrastructure and the managed services. And this brings in the need for organizations to look at an alternative monitoring solution without fetching metrics from Cloudwatch.
AWS Infrastructure Monitoring With Netdata
Netdata is a comprehensive monitoring solution and you can monitor and troubleshoot various aspects of your infrastructure including servers, VMs, Network, Disks, K8s, wide variety of applications (databases, gateways, web servers etc) with zero configuration, out of the box.
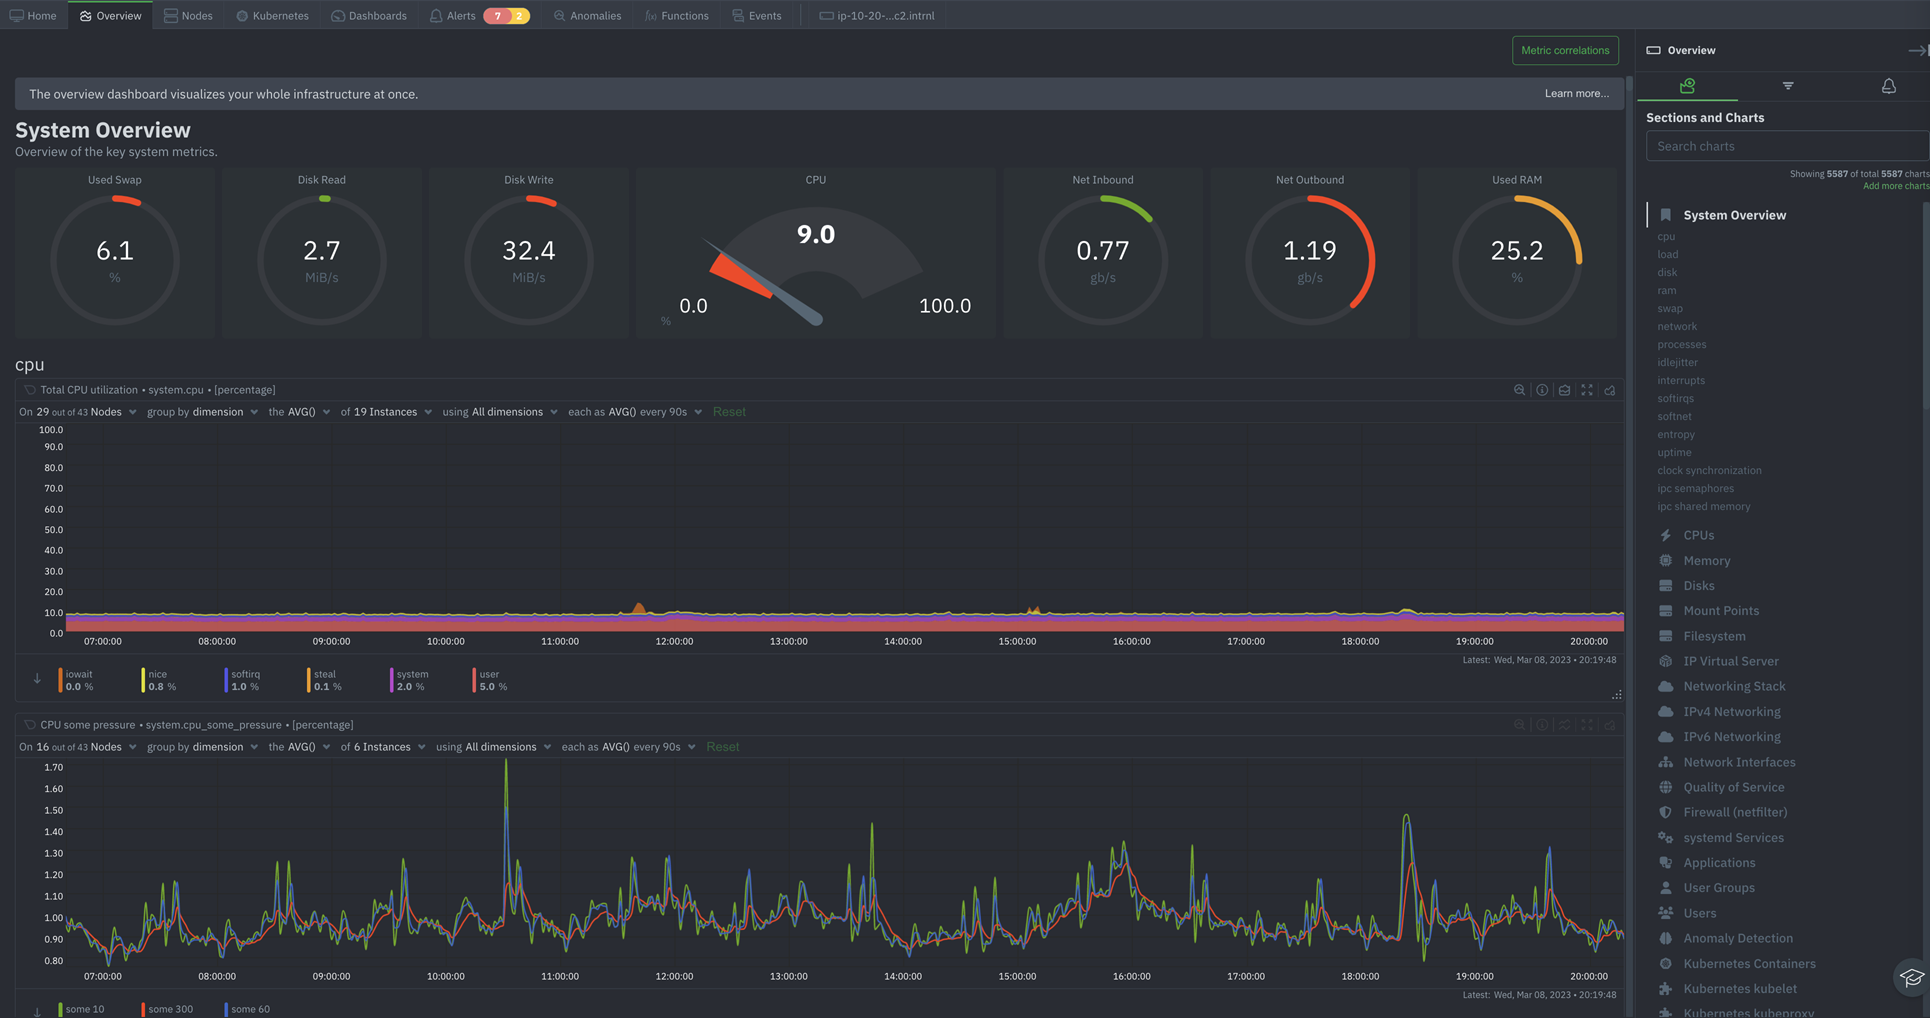
- Automatically gather system level metrics from operating system, containers, network, storage, processes, including the system calls these processes (with eBPF) do and it will automatically organize and correlate all the information in ready to use dashboards. AWS system level metrics from the EC2 VMs show up in the System Overview section on the Overview tab.
- Automatically gather operational and other performance metrics from almost every packaged application available including popular web servers such as Apache, Nginx, and HAProxy, databases like Redis, MongoDB, PostgreSQL, and MySQL/MariaDB etc and these metrics show up on the corresponding application sections on the Overview tab.
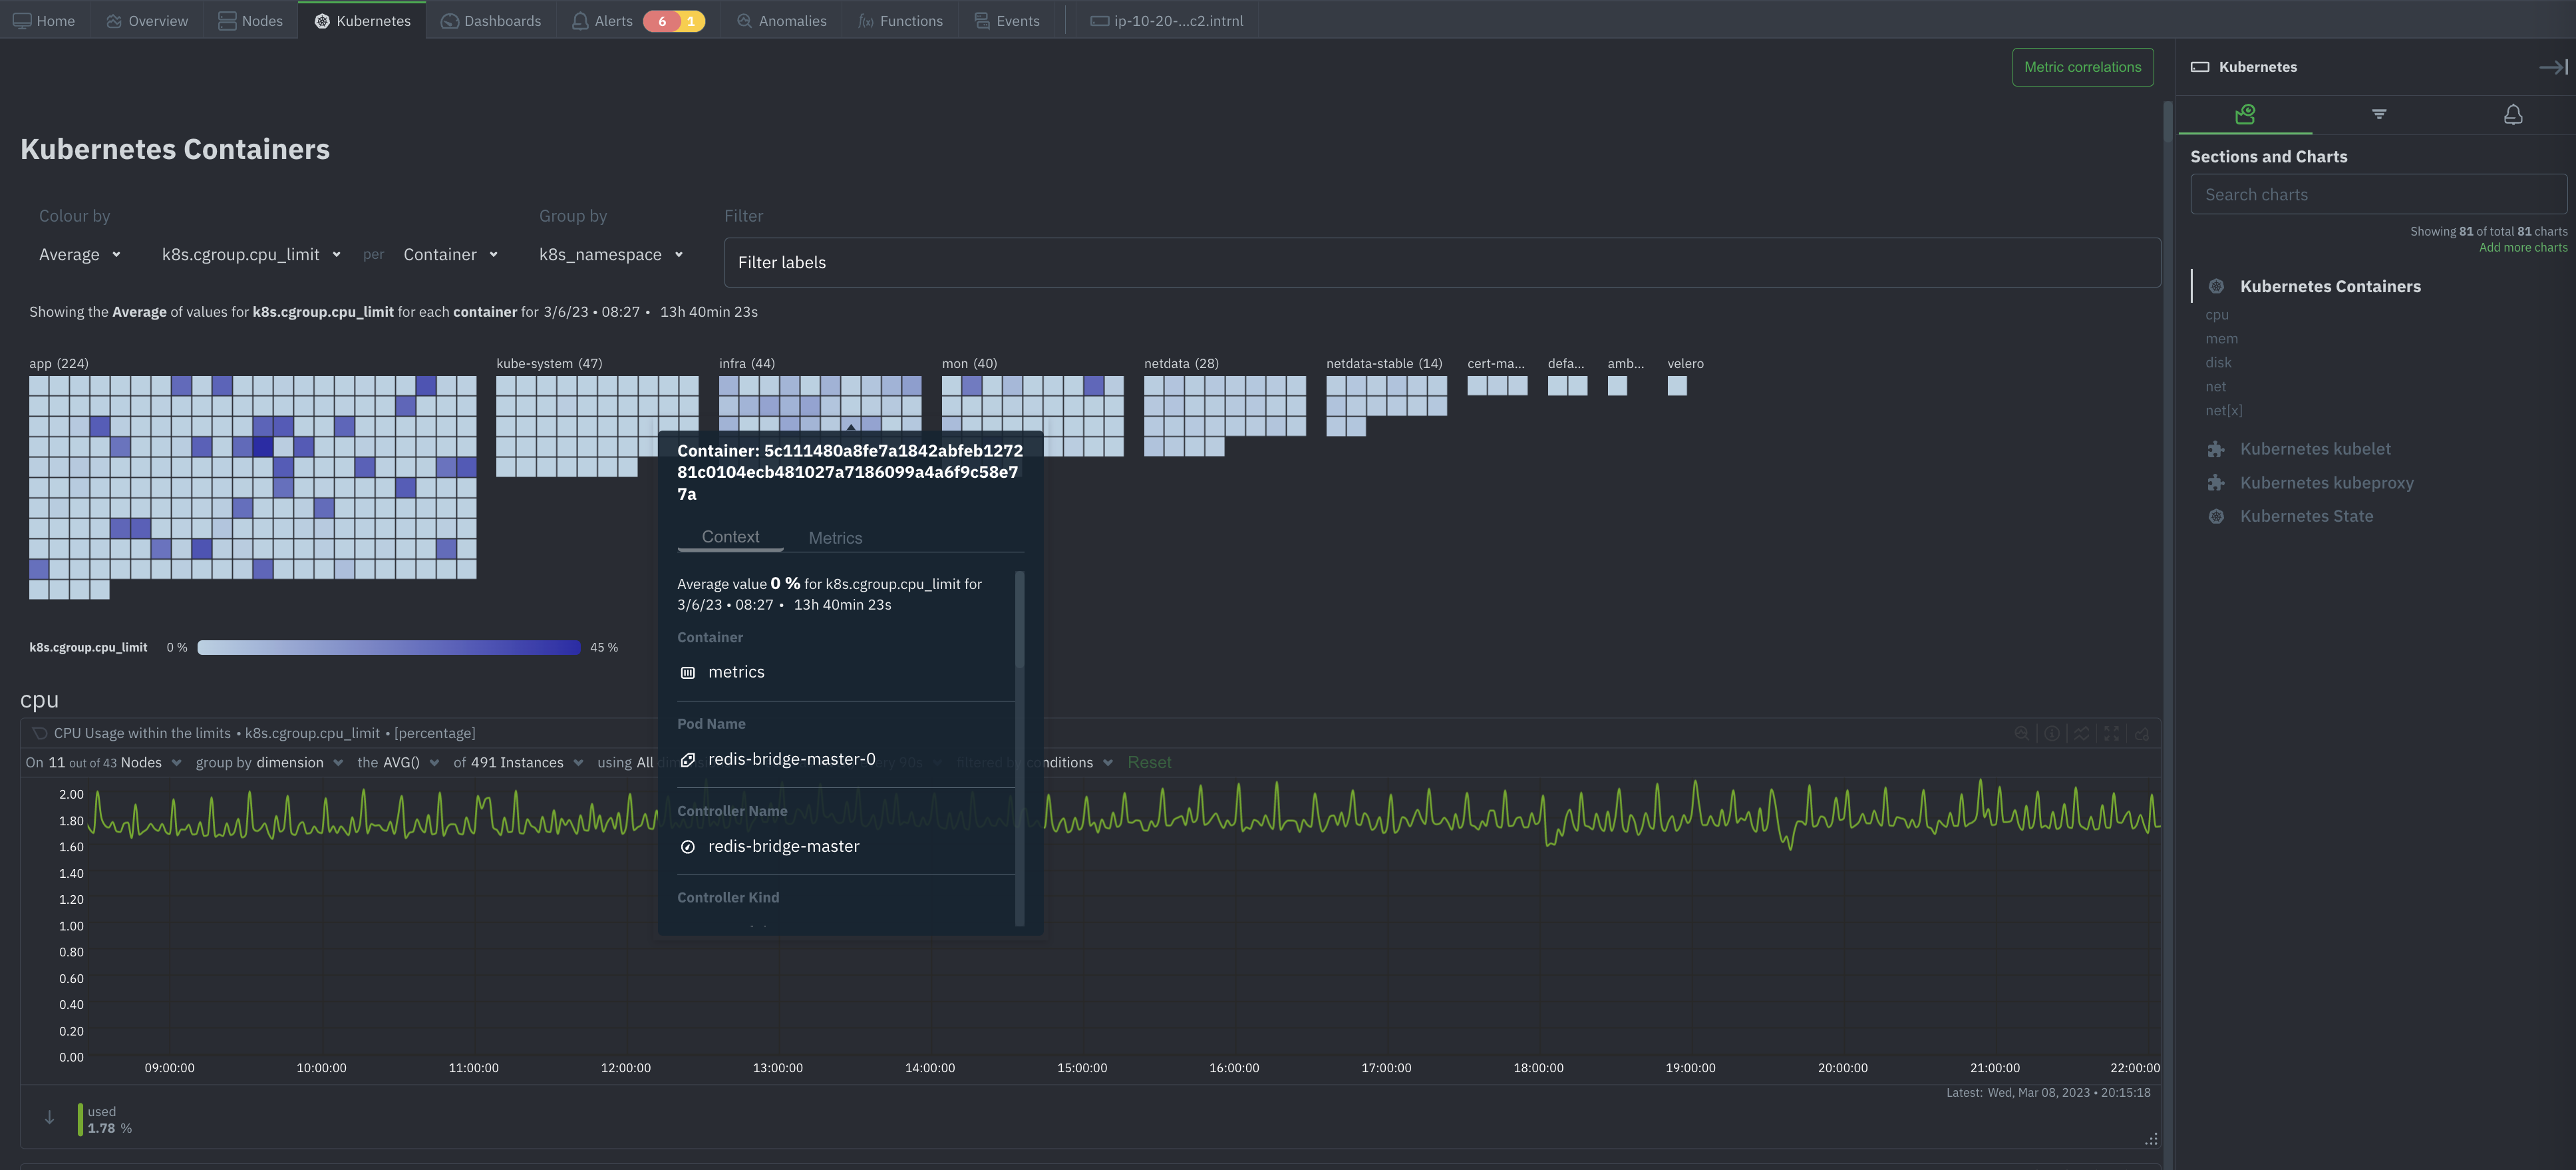
- Automatically gather metrics from your Kubernetes EKS Cluster and visualise all the Kubernetes Containers, States, Kubelet and Kubeproxy related metrics on the Kubernetes tab.
Troubleshooting With Netdata’s Powerful Tools
Netdata offers powerful tools to optimize your troubleshooting and solve your response time issues faster than ever. Finding the proverbial needle in the haystack is a lot easier with Netdata.
Alerts
Alerts, the simplest way of troubleshooting your infrastructute. Netdata comes with 100s of pre-defined Alerts out of the box and allows you to create Custom Alerts based on your requirements and these can be notified through multiple notification mechanisms.
Metrics Correlations
Metrics correlations, a tool that scans all metrics to find how they correlate in a given time-frame. This allows you to highlight an area with a spike or a dive on a chart and let Netdata find which other metrics have changed similarly at the same time.
Anomaly Advisor
Anomaly advisor, a tool that scans all metrics for anomalies during a given time-frame. This allows you to highlight an area with a spike or a dive on a chart and let Netdata find which anomalies were detected during that time-frame, across your infrastructure.
These tools can be of great help identifying and revealing anomalies in your infrastructure and to understand interdependencies among infrastructure components. For example, you can see how CPU utilization affects response time, how disk throughput affects database queries, how network bandwidth affects web requests etc.
You can also see how different applications interact with each other on the same server or across different servers. By correlating application metrics and server metrics you can identify root causes, troubleshoot problems, optimize performance, improve availability, enhance security etc on your infrastructure.