


The Netdata Agent is well-equipped to solve monitoring and troubleshooting challenges for single nodes. We love that the Agent is so valuable to our users, but Netdata Cloud is designed for infrastructure monitoring. That’s why we’re working so hard to offer even more capabilities and help users monitor and troubleshoot infrastructures of all sizes, entirely for free!
With the new Cloud Overview, you get every real-time chart and metric you need to understand the status of your infrastructure, explore, and troubleshoot, in a single view. We designed the Overview on one existing and beloved feature and another entirely new one that we’re very excited to launch for the first time.
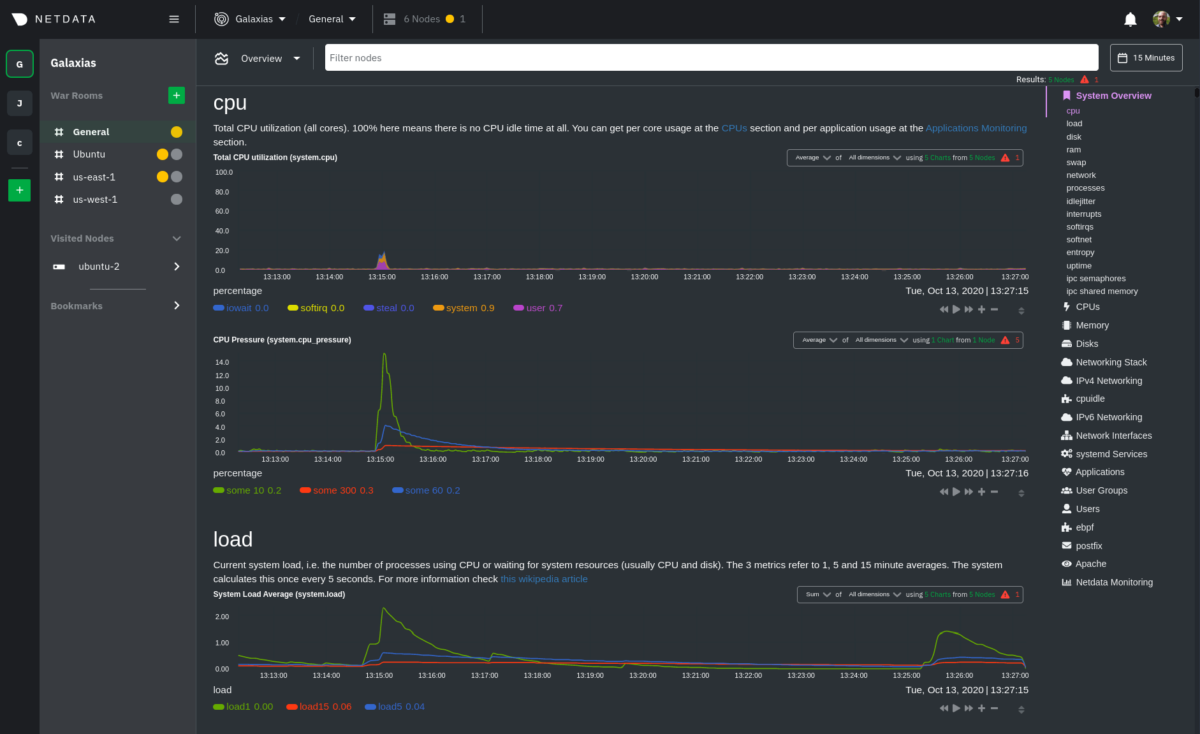
The Overview uses the Agent dashboard, the one our users love, as its foundation, but is even more powerful with composite charts that visualize metrics from all nodes belonging to a War Room, or a configurable subset. Better yet, every composite chart is immediately available and requires zero configuration.
With the Overview, you can:
- Focus on nodes of interest with rich node filtering by hostname, OS, and service.
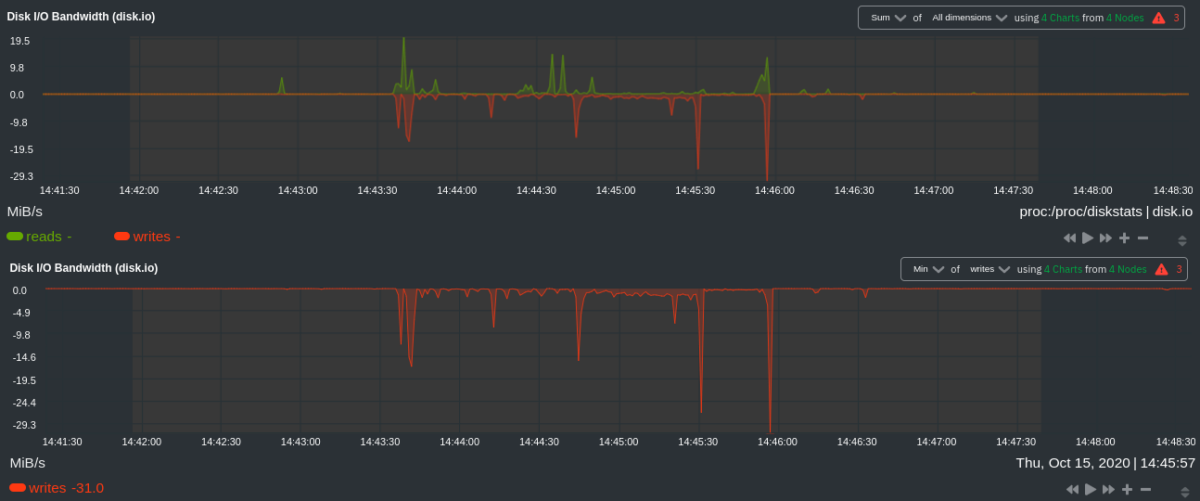
- Have a “helicopter view” for all your infrastructure’s metrics, with composite charts grouped by dimensions across the nodes of interest.
- Navigate through the well-known Netdata menu to the charts you want to analyze, change how a chart is defined, and see which charts and nodes participate.
Focus on troubleshooting, not on organizing your metrics
With other monitoring tools, you need to focus on building dashboards. You need to know exactly what you want to monitor beforehand, have a plan, and do a lot of manual and automated work. After days, and even weeks, of focused work, you’ll finally arrive at a position where you can rely a bit on your IT monitoring.Netdata Cloud does all this work for you, right now, for free.
Netdata Cloud automatically categorizes and organizes thousands of collected metrics, then presents them hundreds of composite charts on a single screen. It’s all the information you need to explore further, investigate, and analyze.
Don’t worry about creating dashboards. Don’t worry about setting everything up. Don’t worry about the scalability of your monitoring stack. Netdata Cloud takes care of everything for you.
Your metric data remains within your infrastructure, on the nodes that collected them. Netdata Cloud does not store your metrics.The Overview, and its composite charts, is one critical step towards democratizing monitoring, as everybody can have the luxury to understand what’s happening within their infrastructure:
- SREs and DevOps engineers can focus on troubleshooting.
- Startups and small-medium enterprises can monitor and troubleshoot without an entire IT operations department.
- Software development teams are one step closer to becoming DevOps engineers, with all this monitoring and troubleshooting support out-of-the-box.
- Enterprises don’t need to rely solely on the ability of operational, SRE, and DevOps teams to set up monitoring systems, which gives them more time and flexibility to focus on critical business objectives.
How can you use Netdata Cloud’s infrastructure monitoring tools?
We’re excited to see how you use the Overview and composite charts. While some of the features supporting these use cases are already available, others are coming soon. Stay tuned!- Have a helicopter view over your infrastructure. You can have a full overview of your infrastructure and then navigate numerous charts created with data from all the nodes in your War Rooms. Use these rich visualizations to spot unexpected patterns and continue the investigation by checking a subset of your infrastructure with filtering.
- Explore charts. Netdata Cloud offers some smart, pre-configured defaults for how each composite chart aggregates metrics, but if you’re the curious type, you can always change these settings. For example, if you expect your filtered nodes to have low/high values for certain metrics, you can change the aggregation functions, see the max/min, and figure out if you want to take a closer look. When you spot a strange pattern, you can drill down with grouping metrics by nodes.
- Dive deeper with Metric Correlations. When you spot an unexpected pattern in a particular node, you can run Metric Correlations to find all the correlated metrics. You’re now one automated step closer to finding the root cause of issues.
- See what happened during incidents. First, set your nodes’ metrics retention to store metrics for a few days. The next time you have an incident on your infrastructure, select a custom timeframe, and see what exactly happened and how your nodes were affected. In the future, with child-parent support on Cloud, you will get even more visibility into the performance of every node.
- Get monitoring data related to blue-green deployments with the use of dashboards. Add composite charts to a dashboard and watch how important metrics relate to each group of nodes after a deployment. With this focused, custom view, you can understand how the deployed code affects system and application performance.
- Investigate after receiving alarm notifications. We’re working hard on centralized alarm dispatch via email. When you receive a notification from Netdata Cloud about a node’s health, use the Overview to see how charts on other nodes with a similar purpose behave during the same timeframe.
What’s next for composite charts?
Soon, we’ll offer new capabilities around composite charts, some of which we described above:- The ability to drill down with grouping metrics by node. For example, if you see a spike in CPU usage across your infrastructure, you can find the problematic node, jump to its single-node dashboard, and find the root cause.
- Composite charts in new dashboards you design.
- Integration with Metric Correlations. When you see abnormal patterns, you can use Metric Correlations to find out any other metrics and charts that have a similar pattern.
Make your infrastructure monitoring easier with Netdata Cloud’s composite charts. They’re available right now, for free, for every infrastructure.