
Introduction to eBPF
Current IT monitoring software lacks the necessary metrics for minimizing downtime for systems and applications. Most provide system and application metrics but there is much more than this required for properly monitoring your infrastructure. With eBPF there is a technological advancement that allows monitoring software to provide rich information from the Linux kernel and present it. eBPF monitoring, specifically, provides a better understanding of what exactly is occurring on internal systems, which helps to identify where performance improvements can be made.
At Netdata we are in the position to leverage the power of eBPF to enable your team to :
- Get the most out of the Linux kernel to offer monitoring insights based on data directly gathered from the Linux kernel that’s been never seen before.
- Have improved monitoring coverage from new, additional metrics and charts that have richer information about areas such as hard disks, filesystems, and more.
- Enrich alerts with a new set of use cases, based on the new eBPF charts,
- Have more information about the Linux kernel and its hidden, but lucrative secrets.
Netdata will be a superset of all eBPF tools out there. Furthermore, we’re simplifying the whole process before you visualize this information by eliminating overhead on configuration. With Netdata, you can install our monitoring Agent with a single command, connect it to a Space in Cloud and get out-of-the-box eBPF monitoring, avoiding the complexity of finding eBPF tools that require compiling, running, collecting, and storing output plus configuration required for developing visualizations for troubleshooting. We take care of all this complexity for you. Simply, enable the eBPF on your agents and you’re good to go!
Disk monitoring and alerting
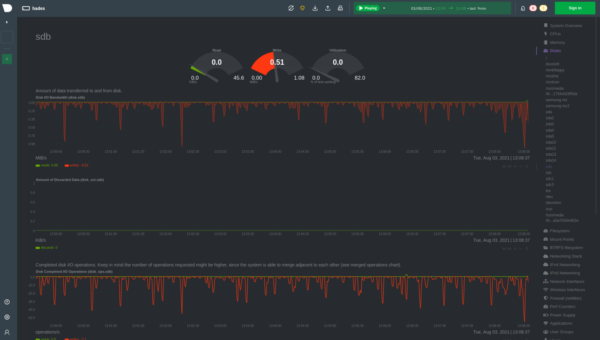
Netdata monitors all your Disks by offering many charts out-of-the-box on ready-made dashboards. This data includes, but is not limited to:
- Disk I/O Bandwidth: how much data is transferred to and from disk
- Amount of Discarded Data: the number of sectors read from, written to, or discard from this block device. To configure discarding, visit this documentation and for more information on using discarding and Netdata dashboards, you can refer to the article to learn more.
- Disk Completed I/O Operations: total number of reads or writes completed successfully
- Disk Completed Extended I/O Operations: the number of discarded blocks and flushes after an I/O operation is completed
- Disk Current I/O Operations with I/O: operations currently in progress.
- Disk Backlog: the duration of pending disk operations
- Disk Busy Time measuring the amount of time the disk was busy
- Disk Utilization Time
- Average Completed I/O Operation Time for reads and writes that were completed successfully
- Average Completed Extended I/O Operation Time with Discards and Flushes time
- Average Completed I/O Operation Bandwidth
- Average Amount of Discarded Data
- Average Service Time for completed I/O operations
- Disk Merged Operations as Reads and writes which are adjacent to each other may be merged for efficiency
- Disk Merged Discard Operations with total I/O time of all completed I/O operations
- Disk Total I/O Time for Extended Operations per flush, discard
Now, with eBPF you also get the following additional metrics:
- Disk Latency (eBPF): Latency chart showing histogram with the time necessary for read and write data.
- Synchronization (eBPF): When data is moved from memory page cache to hard disk.
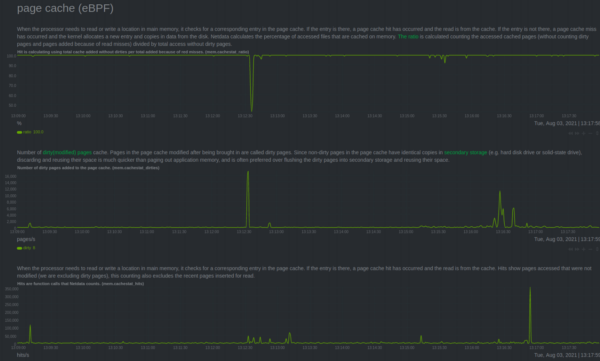
- Page cache (eBPF): How data is changed in real-time on your host.
- Mount point monitoring (eBPF): When partitions/disks are removed and inserted on your host
We provide prebuilt alarms for:
- Disk utilization
- Inode utilization, you can find more information on Disk Inode here.
- Disk backlog
- Latency
Disk Space Usage
Disk space utilization. reserved for root is automatically reserved by the system to prevent the root user from getting out of space.
Disk Files (inodes) Usage – Running out of available inodes (or index nodes) can cause issues so new files cannot be created
inodes (or index nodes) are filesystem objects (e.g. files and directories). On many types of file system implementations, the maximum number of inodes is fixed at filesystem creation, limiting the maximum number of files the filesystem can hold. It is possible for a device to run out of inodes. When this happens, new files cannot be created on the device, even though there may be free space available.
Mount syscalls (eBPF)
- Monitor, when syscalls mount and unmount, are called.
- When a device is inserted or removed from a computer, this can be a hardware issue, security issues.
File System Monitoring
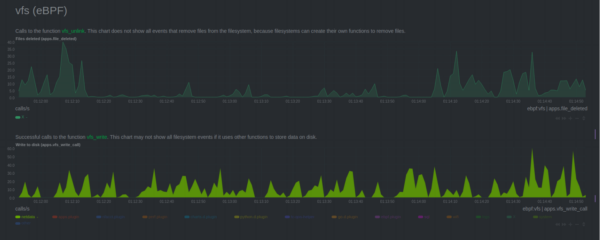
Netdata monitors different filesystems such as:- Virtual File System (eBPF)
- Remove files – Monitor the frequency that files are deleted on Linux;
- Calls to IO – Count the number of events to write (input) and to read (output) from/to hard disk
- Bytes written and read – a complement for the previous chart, but instead to measure calls, it measures the number of bytes.
- Calls to vfs_fsync – Monitor when operate system calls file synchronization to store changed pages on memory to disk.
- Calls to vfs_open – Calls to open a file
- Calls to vfs_create – calls to function that creates new file
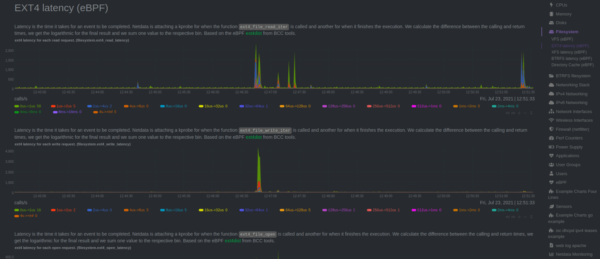
- EXT4, XFS, BTRFS, ZFS Latency (eBPF)
- latency to read requests with time necessary to read data from ext4 filesystem.
- latency to write requests with time necessary to execute a write event.
- latency to open requests with time necessary to execute an open event.
- latency to sync requests time necessary to execute a synchronization.
- NFS (eBPF)
- NFS latency to read request with time necessary to execute a read event.
- NFS latency to write request with time necessary to execute a write event.
- NFS latency to open request with time necessary to execute an open event.
- NFS latency to getattr request with time necessary to execute a getattr request
- Mounting filesystems (eBPF)
- Netdata is monitoring when filesystems are mounted and unmounted on the operating system.
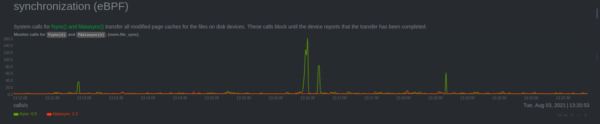
Synchronization
- Synchronization (eBPF): Netdata monitors six different syscalls (fsync, fdatasync, msync, sync, syncfs, and syncfilerange) responsible for synchronizing data from page cache to disk.
- Page Cache (eBPF): Netdata monitors access and changes on page cache that are synchronized to disk.
We now offer more enhanced metrics for monitoring Virtual File System (VFS) and also offer monitoring for the latency that some file systems need to execute actions to open files, write data on disk, read data from disk,delete files and synchronization, and more.
Integration of eBPF with apps.plugin
Some of the charts present filesystem and memory sections and are also shown per application when the integration with apps.plugin is enabled. Thanks to this integration, you can see how specific applications are using the hard disk.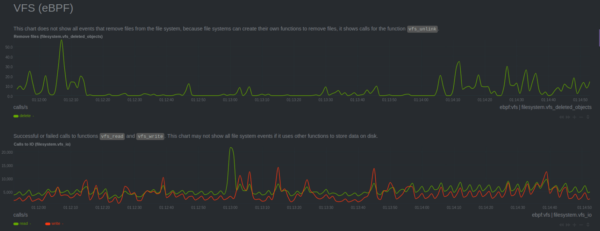
Apps integration
Let’s look at an example:
Latency is the time it takes for an event to be completed. Netdata calculates the difference between the function call and its return. The final result is stored per interval of time.
Each hard disk has its own latency to execute read and write actions, to correctly set your alarms, we suggest you take a look at your hard disk manual.

To compliment information provided for hard disks, Netdata also monitors latency for specific actions on filesystem.
Summary
Thanks for stopping by and learning how to monitor your Disks and File Systems with Netdata! For a rich experience, sign up for Netdata Cloud for free (if you haven’t already) and get access to:
- Metrics from multiple nodes aggregated into a single chart. To do so, simply create an account, connect your nodes to a Space and go to the Overview exploring your metrics
- Run intelligent functions like metric correlations to correlate usage patterns on specific metrics that have the same pattern across all the metrics Netdata collects for your systems