As your infrastructure grows more complex, storing long-term metrics becomes difficult and costly to retain. Your team stars to limit the amount of historical data they archive, causing gaps in coverage. Anomalies start to slip through the cracks.
Version 1.18 of Netdata aims to solve the monitoring metrics storage problem once and for all.
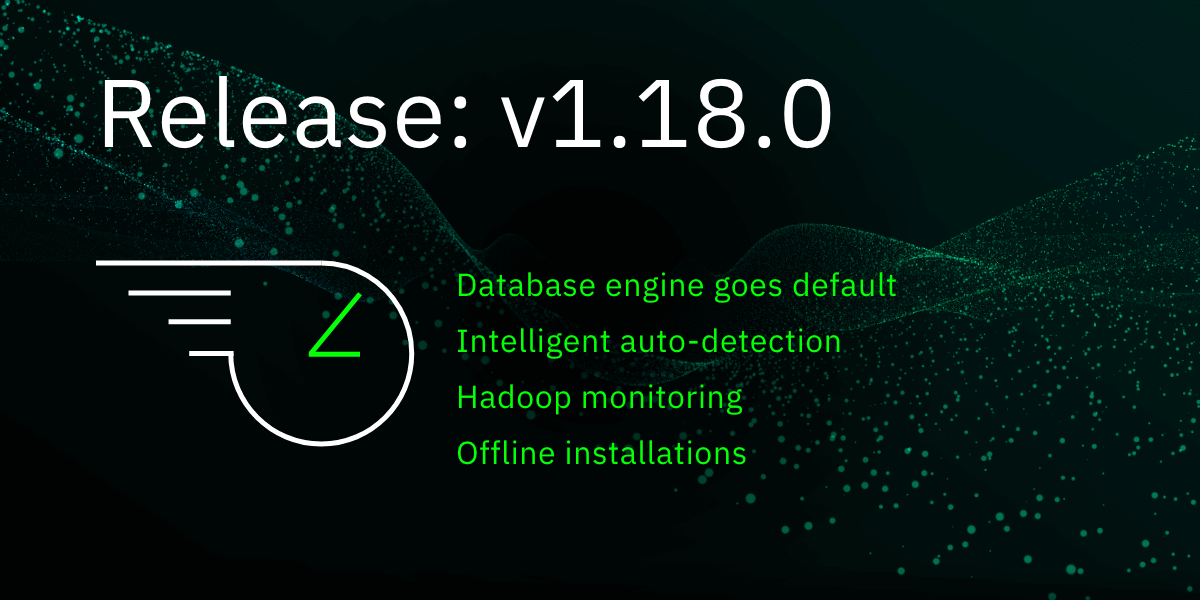
Aside from 5 new collectors, 16 bug fixes, 27 improvements, and 20 documentation updates, here’s what you need to know.
Database engine becomes default metrics storage mode
The database engine is now the default method of storing metrics in Netdata.This database stores metrics for extended periods, at scale. The approach offers better performance and lower memory usage than what Netdata used in the past by saving recent metrics in RAM and “spilling” historical metrics to disk for long-term storage.
We even have a tutorial on switching to the database engine and getting the most from it. Or, just read up on how performant the database engine really is.
We’re continually making improvements to the database engine to help you collect more data, back it up, and validate it. And, of course, avoid the pitfalls of centralized metrics storage via our distributed model.
Plugin history ensures your services stay monitored
Let’s say you had a system where, upon reboot, one of your monitored services took 2 minutes to start up again.Even with Netdata’s auto-detection capabilities, you might have needed to restart Netdata to start collecting metrics from that service.
With v1.18, these kinds of post-reboot papercuts are no more. Our python.d and go.d plugins now periodically dump a list of active modules to disk. Now, when you reboot, the plugins use this list to re-establish metrics collection.
The plugins will keep trying for a few minutes, so that slow-starting service of yours will now get picked up without an intervention on your part.
Monitor big data Hadoop with Netdata
Our new HDFS and Zookeeper collection modules will help those with Hadoop infrastructures monitor these services with almost no required configuration.Our community helped us build insightful default alarms, and the aforementioned auto-detection will take care of most of the rest.
For everything else, check out our HDFS and Zookeeper tutorial.
Dimension templates bring simplicity to alarms
If you rely on a large number of custom alarms to monitor the health of your systems, applications, or infrastructure, you’ll be happy to hear about our new dimension templates for alarms.These might not sound like much, but they dramatically streamline the process of creating alarms. Here’s an example.
In previous versions of Netdata, you needed to create individual alarm entities for each dimension. If the chart/metrics you wanted to monitor had 10 dimensions, you would have to create 10 individual entities. Most users copy-pasted an original alarm and edited the alarm and lookup lines to change the name and dimension to monitor, respectively.
Here’s an example of entities for three dimensions in system.cpu metrics:
alarm: cpu_system
    on: system.cpu
lookup: average -3s percentage of system
 every: 10s
  warn: $this > 50
  crit: $this > 80
alarm: cpu_user
on: system.cpu
lookup: average -3s percentage of user
every: 10s
warn: $this > 50
crit: $this > 80
alarm: cpu_nice
on: system.cpu
lookup: average -3s percentage of nice
every: 10s
warn: $this > 50
crit: $this > 80
And, based on your system, you might have many more than three dimensions in your system.cpu chart. Creating all these entities was an error-prone hassle for our users.
With dimension alarm templates, you can condense these duplicate alarms for different dimensions into a single entity:
 alarm: cpu_template
    on: system.cpu
lookup: average -3s percentage foreach system,user,nice
 every: 10s
  warn: $this > 50
  crit: $this > 80
You’ll save time and reduce the risk you don’t get alerts for critical metrics in your infrastructure.
We have a tutorial on using dimension alarm templates available to read now.
Install Netdata on offline systems
We’ve built in much better support for any offline or air-gapped systems you might want to monitor with Netdata.Our installation scripts can now install Netdata using previously-downloaded tarball and checksums instead of downloading them at runtime.
Want to get started? We have guides for installing offline via kickstart.sh or kickstart-static64.sh in our installation documentation.
What else?
Our new support for offline installations is a great example of why we love our community. The mission to support for offline installations began with a feature request from a user.We validated their request, ensured we could support it, and got to work! And now, we hope, Netdata will get installed in many places that were previously either not possible or very difficult to do.
Same goes for dimension templates, which were first requested in our GitHub issues. This is why we encourage you to share your Netdata experience—let us know how we could make Netdata work even better for you!
To see the rest of this update, visit the full v1.18.0 release notes on GitHub.
We’re pleased to provide you these new improvements and excited for you to check them out. Just a few more ways Netdata is constantly evolving to discover new ways to improve your infrastructure monitoring.


